. 2015 Dec:81:277-291.
doi: 10.1016/j.bone.2015.07.035. Epub 2015 Jul 29.

Phospho1 deficiency transiently modifies bone architecture yet produces consistent modification in osteocyte differentiation and vascular porosity with ageing

Affiliations

Phospho1 deficiency transiently modifies bone architecture yet produces consistent modification in osteocyte differentiation and vascular porosity with ageing

B Javaheri et al. Bone. 2015 Dec.

Abstract

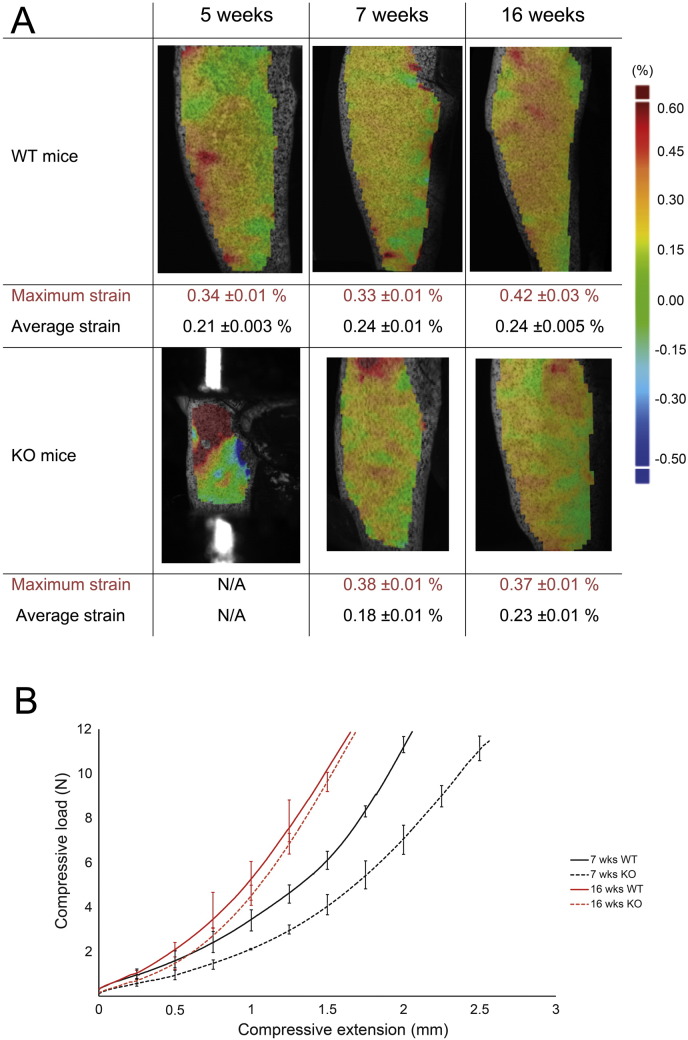
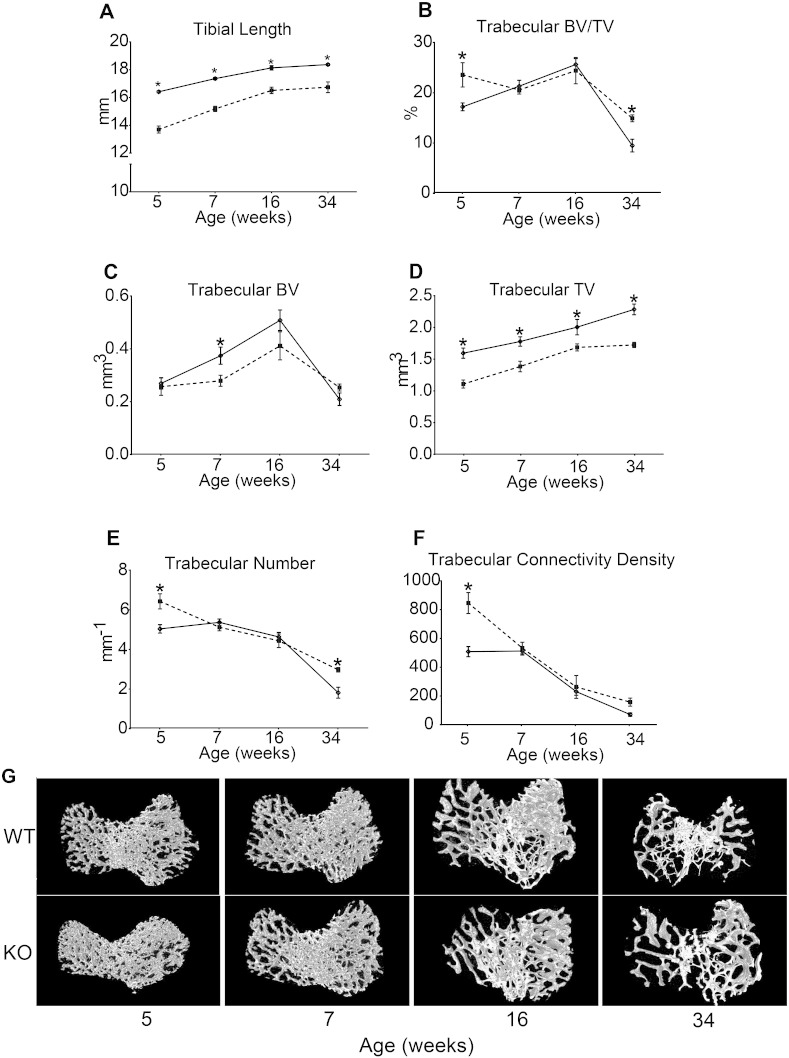
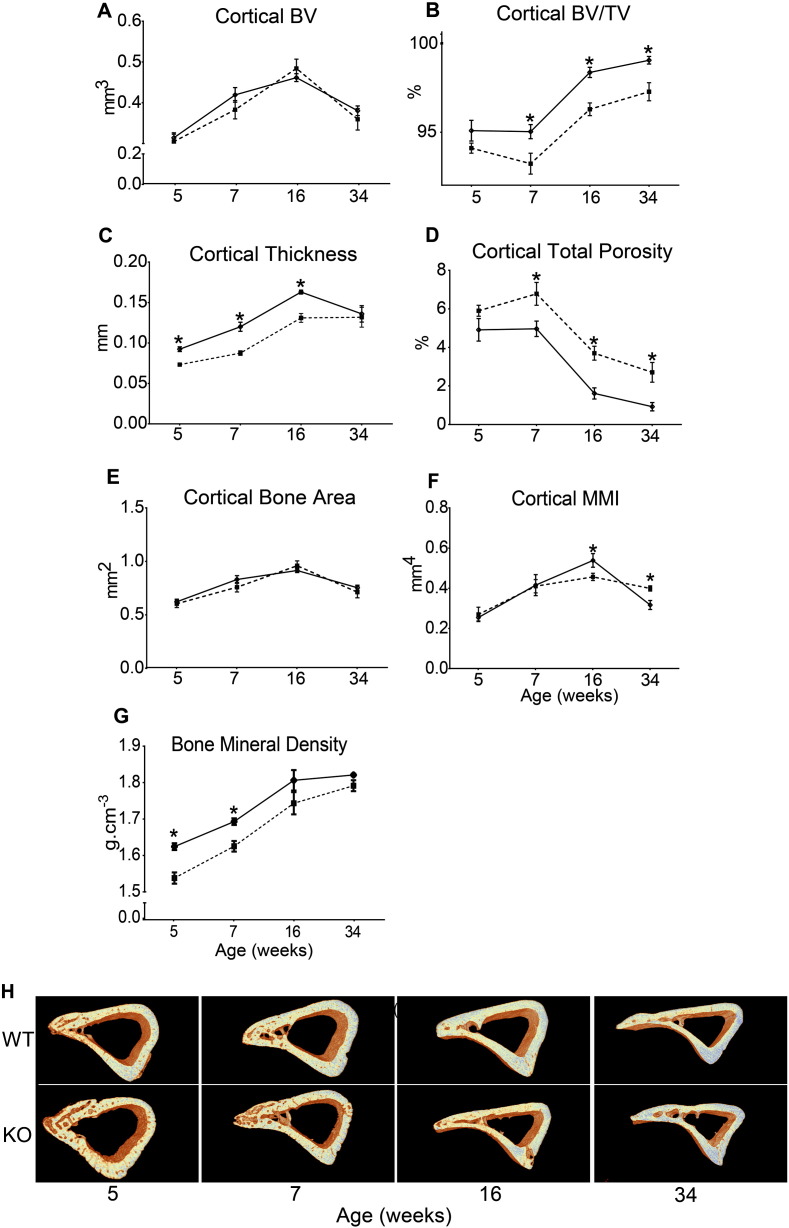
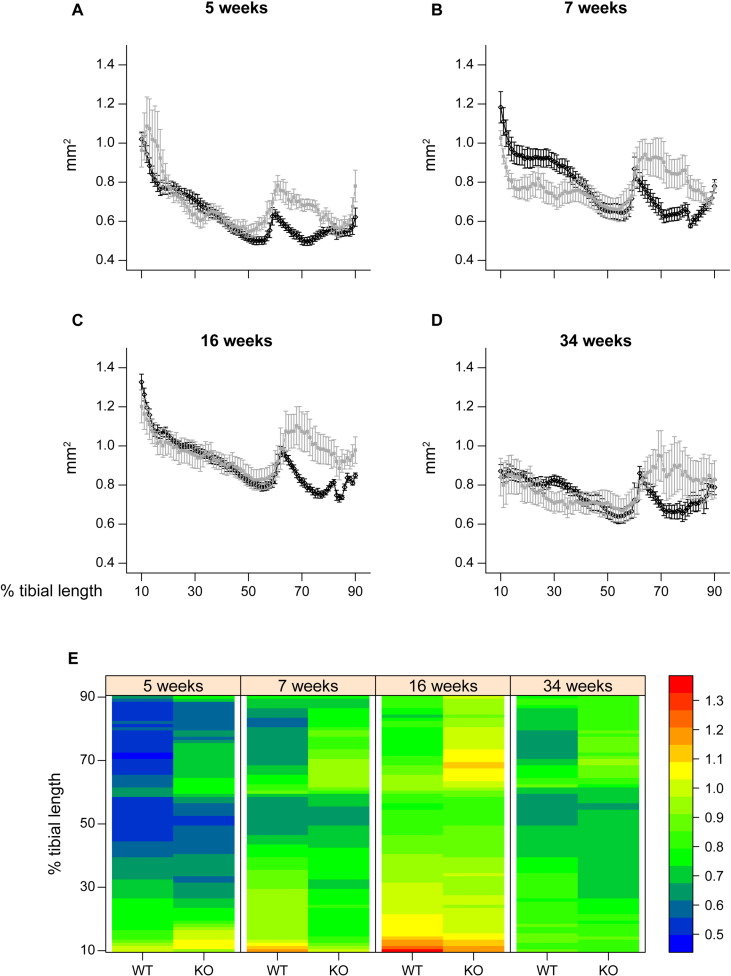
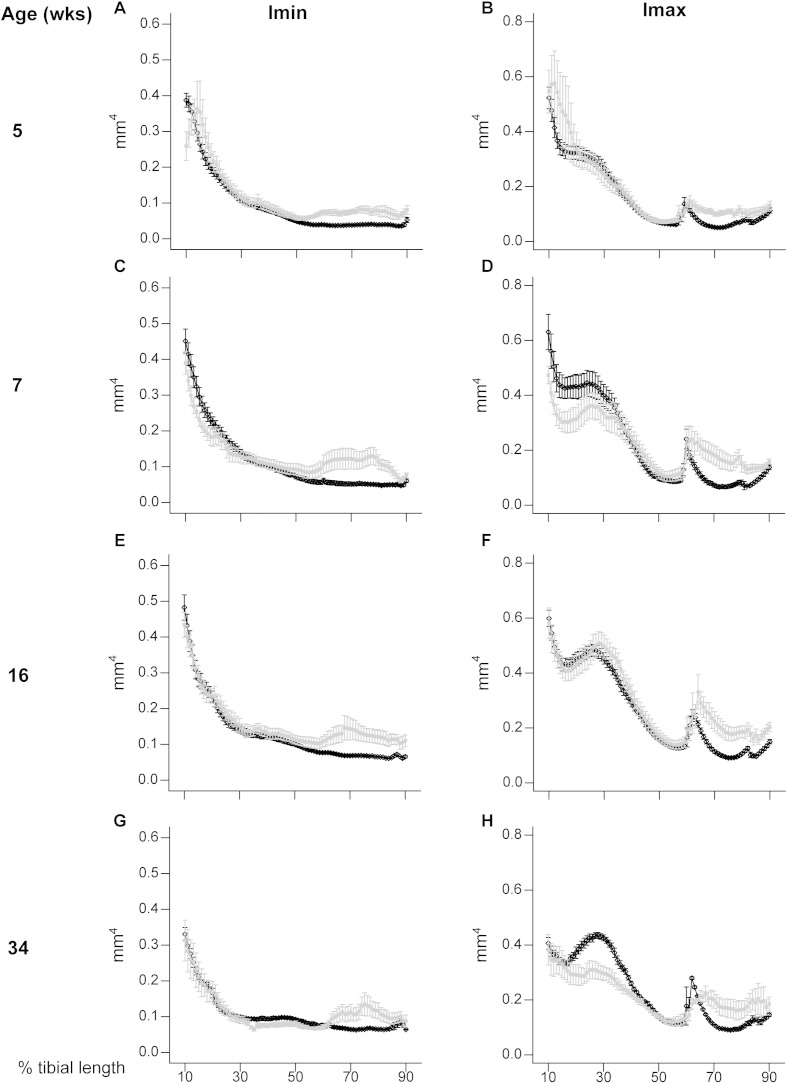
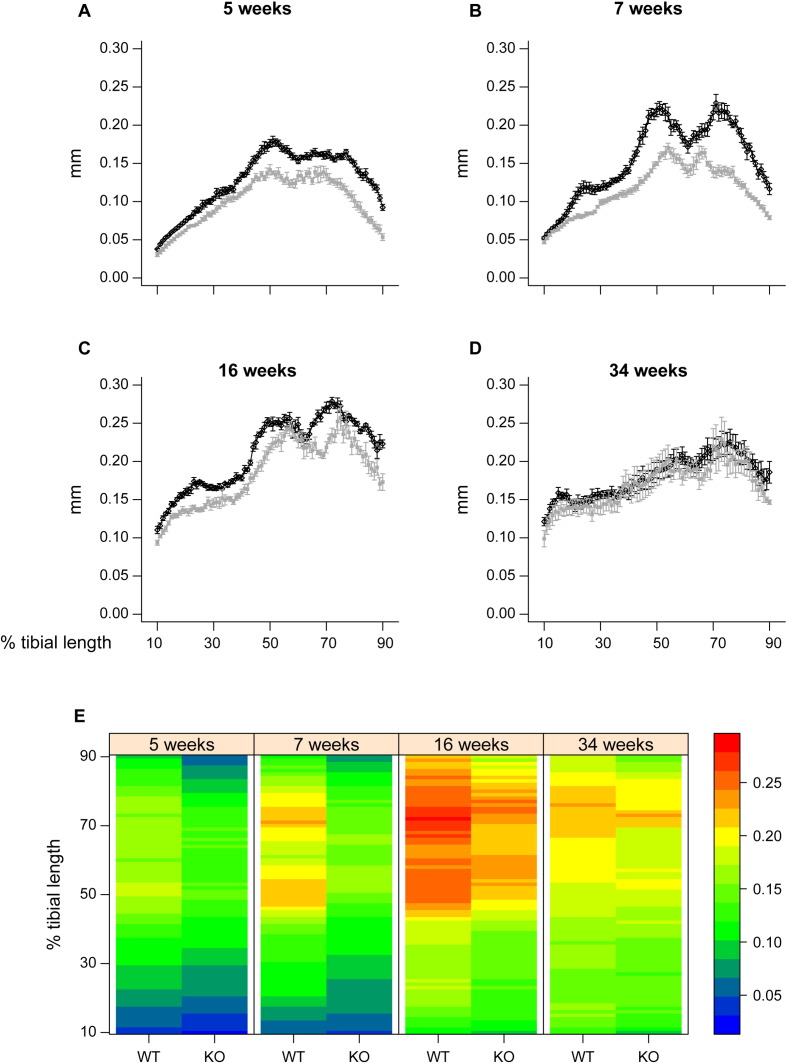
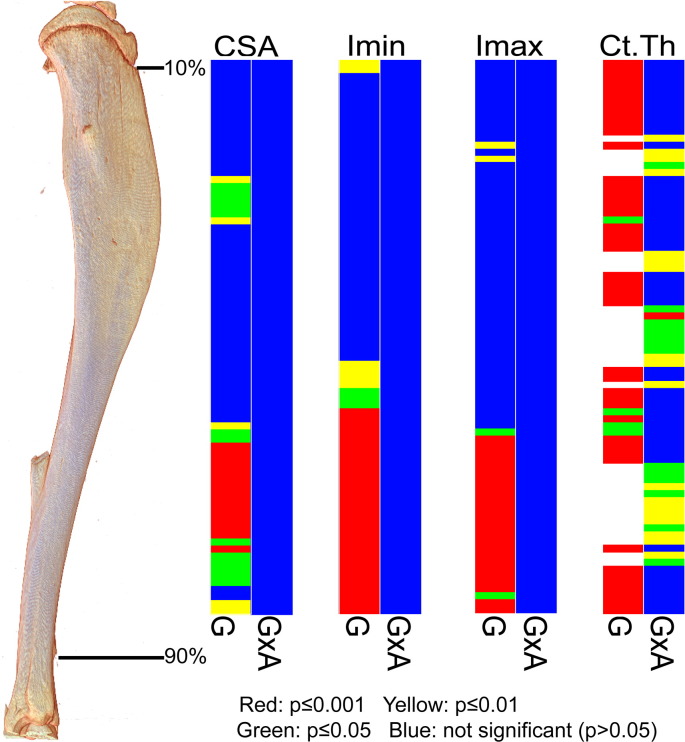
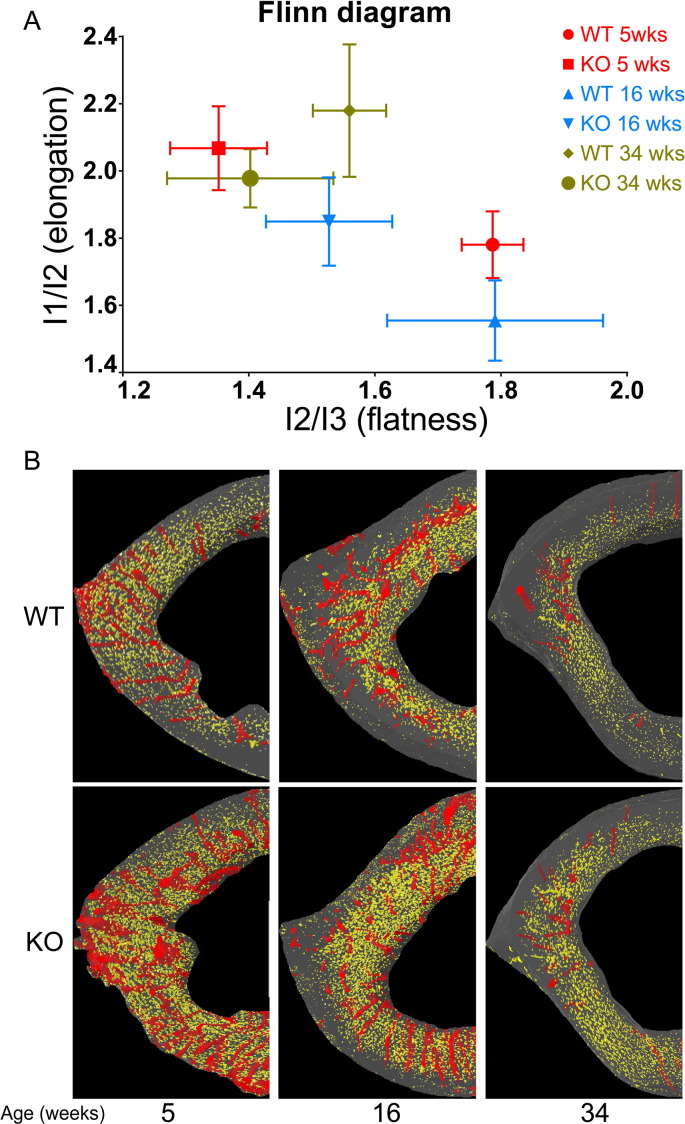
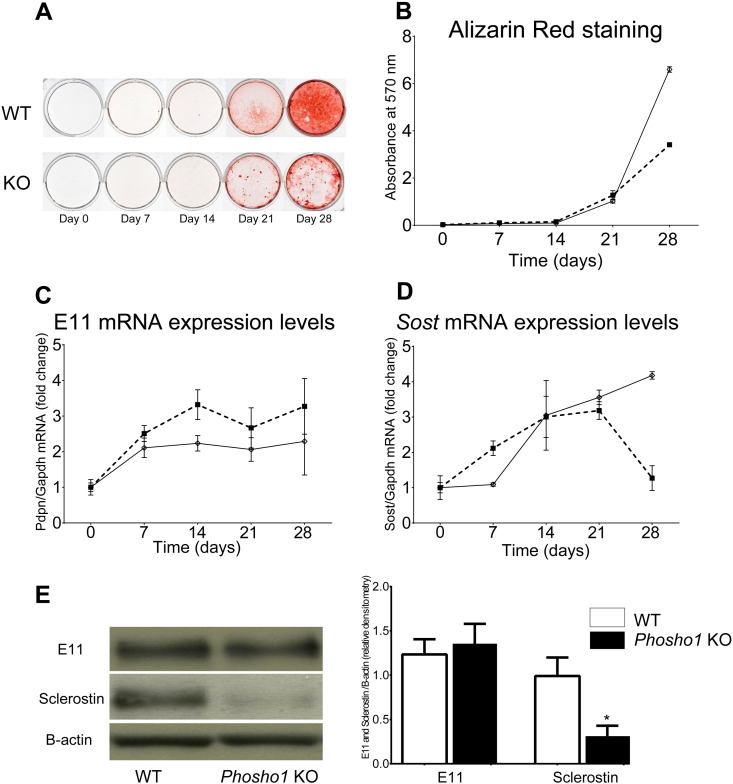
PHOSPHO1 is one of principal proteins involved in initiating bone matrix mineralisation. Recent studies have found that Phospho1 KO mice (Phospho1-R74X) display multiple skeletal abnormalities with spontaneous fractures, bowed long bones, osteomalacia and scoliosis. These analyses have however been limited to young mice and it remains unclear whether the role of PHOSPHO1 is conserved in the mature murine skeleton where bone turnover is limited. In this study, we have used ex-vivo computerised tomography to examine the effect of Phospho1 deletion on tibial bone architecture in mice at a range of ages (5, 7, 16 and 34 weeks of age) to establish whether its role is conserved during skeletal growth and maturation. Matrix mineralisation has also been reported to influence terminal osteoblast differentiation into osteocytes and we have also explored whether hypomineralised bones in Phospho1 KO mice exhibit modified osteocyte lacunar and vascular porosity. Our data reveal that Phospho1 deficiency generates age-related defects in trabecular architecture and compromised cortical microarchitecture with greater porosity accompanied by marked alterations in osteocyte shape, significant increases in osteocytic lacuna and vessel number. Our in vitro studies examining the behaviour of osteoblast derived from Phospho1 KO and wild-type mice reveal reduced levels of matrix mineralisation and modified osteocytogenic programming in cells deficient in PHOSPHO1. Together our data suggest that deficiency in PHOSPHO1 exerts modifications in bone architecture that are transient and depend upon age, yet produces consistent modification in lacunar and vascular porosity. It is possible that the inhibitory role of PHOSPHO1 on osteocyte differentiation leads to these age-related changes in bone architecture. It is also intriguing to note that this apparent acceleration in osteocyte differentiation evident in the hypomineralised bones of Phospho1 KO mice suggests an uncoupling of the interplay between osteocytogenesis and biomineralisation. Further studies are required to dissect the molecular processes underlying the regulatory influences exerted by PHOSPHO1 on the skeleton with ageing.

Keywords: MicroCT; Mineralisation; Osteoblast; Osteocyte; PHOSPHO1; Vascular porosity.


Figures

Fig. 1
Fig. 1
A) Longitudinal strain map on the medial side of the bone surface of WT and Phospho1 KO tibia at 5, 7 and 16 weeks of age with maximum and average values obtained following 12 N compressive load. B) Loading displacement for 7 and 16 week old Phospho1 KO and WT mice.
Fig. 2
Fig. 2
Trabecular bone phenotype of WT (solid) and Phospho1 KO (dashed) tibia at 5, 7, 16 and 34 weeks of age. (A) Tibial length. Ex vivo high-resolution analyses of distal proximal metaphysical tibia to determine (B) trabecular bone volume/total volume (BV/TV), (C) trabecular bone volume (BV), (D) trabecular total volume (TV), (E) trabecular number, (F) trabecular connectivity density and (G) representative 3D μCT images of tibial trabecular bone in WT and KO mice. Linear graphs represent means ± SEM. Group sizes were n = 6 for 5-, 7- and 16- as well as n = 5 for 34-week old WT and KO mice. Statistical comparisons: p < 0.05 WT and KO of same age.
Fig. 3
Fig. 3
Cortical bone phenotype of WT (solid) and Phospho1 KO (dashed) tibia at 5, 7, 16 and 34 weeks of age. Ex vivo high-resolution analyses of cortical bone at 37% of total tibial length showing (A) cortical total volume (TV), (B) cortical bone volume/total volume (BV/TV), (C) cortical cross sectional thickness, (D) cortical total porosity, (E) cortical degree of anisotropy, (F) cortical mean polar moment of inertia, (G) cortical tissue mineral density and (H) representative 3D μCT images of tibial cortical bone at 37% tibial length in WT and KO mice. Linear graphs represent means ± SEM. Group sizes were n = 6 for 5-, 7- and 16- as well as n = 5 for 34-week old WT and KO mice. Statistical comparisons: p < 0.05 WT and KO of same age.
Fig. 4
Fig. 4
Cross sectional area (CSA) of WT (black) and Phospho1 KO (grey) tibia at 5, 7, 16 and 34 weeks of age. Whole bone analyses of cortical bone between 10–90% of total tibial length, excluding proximal and distal metaphyseal bone showing cross sectional area at (A) 5 weeks, (B) 7 weeks, (C) 16 weeks and (D) 34 weeks. Line graphs represent means ± SEM. Group sizes were n = 6 for 5-, 7- and 16- as well as n = 5 for 34-week old WT and KO mice. (E) Graphical heat map representation of average tibial cross sectional area.
Fig. 5
Fig. 5
Minimum and maximum second moments of area (Imin and I max respectively) of WT (black) and Phospho1 KO (grey) tibia at 5, 7, 16 and 34 weeks of age. Whole bone analyses of cortical bone between 10–90% of total tibial length, excluding proximal and distal metaphyseal bone showing Imin and Imax at (A, B) 5 weeks, (C, D) 7 weeks, (E, F) 16 weeks and (G, H) 34 weeks. Line graphs represent means ± SEM. Group sizes were n = 6 for 5-, 7- and 16- as well as n = 5 for 34-week old WT and KO mice.
Fig. 6
Fig. 6
Mean cortical thickness of WT (black) and Phospho1 KO (grey) tibia at 5, 7, 16 and 34 weeks of age. Whole bone analyses of cortical bone between 10–90% of total tibial length, excluding proximal and distal metaphyseal bone showing mean cortical thickness at (A) 5 weeks, (B) 7 weeks, (C) 16 weeks and (D) 34 weeks. Line graphs represent means ± SEM. Group sizes were n = 6 for 5-, 7- and 16- as well as n = 5 for 34-week old WT and KO mice. (E) Graphical heat map representation of average tibial mean cortical thickness.
Fig. 7
Fig. 7
Graphical heat map representation of statistical significance of the effect of genotype (Phospho1 deficiency) (G) and its interaction with age (GxA) on CSA, Imin, Imax and Ct.Th of tibia between 10 and 90% of length. Red p ≤ 0.000–0.001, yellow p ≤ 0.001–0.01, green p ≤ 0.01–0.05 and blue p > 0.05.
Fig. 8
Fig. 8
A) Flinn diagram displaying lacunar shapes in WT and Phospho1 KO tibia at tibia–fibula junction from various ages. The x axis represents lacunar flatness which was calculated by dividing lacunar intermediate radius (l2: length of best-fit ellipsoid's intermediate radius) with lacunar minor radius (l3: length of best-fit ellipsoid's minor radius). The y axis represents lacunar elongation which was calculated by dividing lacunar major radius (l1: length of best-fit ellipsoid's major radius) with lacunar intermediate radius (l2: length of best-fit ellipsoid's intermediate radius). Data represent means with group sizes of n = 4 for WT and KO mice from different ages. B) Surface representation of the lacunar (yellow) and red (vascular porosity) segmented from 300 consecutive images from tibia–fibula junction from both genotypes and each age.
Fig. 9
Fig. 9
Characterisation of primary osteoblast-like cells isolated from WT and Phospho1 KO mice to determine (A) mineralisation of cells, (B) E11/Pdpn mRNA expression levels, (D) Sost mRNA expression levels and (E) Western blots of E11 and sclerostin. For in vitro culture studies (A, B, C and D) results are the means ± SEM of three independent experiments (n = 4 per study). For Western blots (E) data represent means ± SEM with group sizes of n = 4 for WT and KO mice.

References

    1. Kawasaki K., Buchanan A.V., Weiss K.M. Biomineralization in humans: making the hard choices in life. Annu. Rev. Genet. 2009;43:119–142. - PubMed
    1. Anderson H.C., Garimella R., Tague S.E. The role of matrix vesicles in growth plate development and biomineralization. Front. Biosci. 2005;10:822–837. - PubMed
    1. Millan J.L. The role of phosphatases in the initiation of skeletal mineralization. Calcif. Tissue Int. 2013;93:299–306. - PMC - PubMed
    1. Boskey A.L., Maresca M., Ullrich W., Doty S.B., Butler W.T., Prince C.W. Osteopontin–hydroxyapatite interactions in vitro: inhibition of hydroxyapatite formation and growth in a gelatin-gel. Bone Miner. 1993;22:147–159. - PubMed
    1. Gorski J.P. Biomineralization of bone: a fresh view of the roles of non-collagenous proteins. Front. Biosci. (Landmark Ed.) 2011;16:2598–2621. - PMC - PubMed

Publication types

Substances