. 2015 Aug 13;162(4):849-59.
doi: 10.1016/j.cell.2015.07.012. Epub 2015 Jul 30.

Mechanistic Origin of Microtubule Dynamic Instability and Its Modulation by EB Proteins

Affiliations

Mechanistic Origin of Microtubule Dynamic Instability and Its Modulation by EB Proteins

Rui Zhang et al. Cell. .

Abstract

Microtubule (MT) dynamic instability is driven by GTP hydrolysis and regulated by microtubule-associated proteins, including the plus-end tracking end-binding protein (EB) family. We report six cryo-electron microscopy (cryo-EM) structures of MTs, at 3.5 Å or better resolution, bound to GMPCPP, GTPγS, or GDP, either decorated with kinesin motor domain after polymerization or copolymerized with EB3. Subtle changes around the E-site nucleotide during hydrolysis trigger conformational changes in α-tubulin around an "anchor point," leading to global lattice rearrangements and strain generation. Unlike the extended lattice of the GMPCPP-MT, the EB3-bound GTPγS-MT has a compacted lattice that differs in lattice twist from that of the also compacted GDP-MT. These results and the observation that EB3 promotes rapid hydrolysis of GMPCPP suggest that EB proteins modulate structural transitions at growing MT ends by recognizing and promoting an intermediate state generated during GTP hydrolysis. Our findings explain both EBs end-tracking behavior and their effect on microtubule dynamics.


Figures

Figure 1
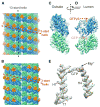
Figure 1. High-Resolution Cryo-EM Structure of EB3-Decorated GTPγS-MT
(A) Overview of the cryo-EM reconstruction of EB3-GTPγS-MT, with pseudo-helical symmetry applied. α-tubulin, β-tubulin and EB3 are colored green, blue and orange, respectively. (B) The asymmetric (C1) reconstruction of (A) viewed from the seam. (C and D) Density for an αβ-tubulin dimer segmented from a merged map of EB3-GTPγS-MT (with and without kinesin), viewed from the outside (C) and from the lumen (D) of the MT. (E) Cryo-EM density segmented from (C) and atomic model of H4, H7 and T7 of α-tubulin, as well as the N-site GTP and coordinating Mg2+ ion. See also Figure S1 and Tables S1 and S3.
Figure 2
Figure 2. Interactions between the CH Domain of EB3 and the Four Tubulin Molecules It Contacts on the MT Surface
(A–E) Cryo-EM map (A) and models (B–E) of EB3-GTPγS-MT. Color scheme is the same as Figure 1. In (D) the crystal structure of EB3 (Protein Data Bank: 3CO1) is shown in magenta. See also Figure S2 and Movie S2.
Figure 3
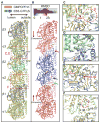
Figure 3. Lattice Compaction between the GMPCPP-K and EB3-GTPγS-MT States
(A) Comparison of the Cα traces of three consecutive tubulin dimers between the GMPCPP-K state (gold) and EB3-GTPγS state (green and blue for α- and β-tubulin, respectively), superimposed on the intermediate domain of β2-tubulin (cyan). Regions marked with red boxes are further visualized in the indicated panels. (B) Cα-atoms-RMSD between the two models shown in (A), with deviations colored from blue to red (same for all figures). Features marked by arrows are further visualized in (C)–(G). (C) Zoom-in view around the E-site. The red circle marks the position of the anchor point. (D) Detailed view of the hydrophobic interactions at the anchor point. (E) Same as (C), but from a different angle. Part of α-tubulin is hidden to improve clarity. (F) Local change of the α:H5 helix. See also Figures S3, S4, and S5, Table S2, and Movie S3.
Figure 4
Figure 4. Lattice Twist between the EB3-GTPγS-MT and GDP-K-MT States
(A) Comparison of the Cα traces of three consecutive tubulin dimers between the EB3-GTPγS state (green and blue for α- and β-tubulin, respectively) and GDP-K state (light purple), superimposing on the intermediate domain of the bottom β1-tubulin (cyan) so that the lattice twist is more apparent in the top β3-α3 dimer. (B) Cα-atoms-RMSD between the two models shown in (A). Differences marked by arrows are further visualized in (C)–(E). (C and D) Changes of the M-loops of β-tubulin (C) and α-tubulin (D) due to the difference in PF number. (E) Local change of the α:H10 helix likely due to EB3 binding. (F) Zoom-in view around the E-site. Part of the α-tubulin is hidden to improve clarity. The red circle marks the position of the anchor point. (G and H) Cα-atoms RMSD between the EB-binding pocket in the EB3-GTPγS-MT structure (13-PF) and the equivalent regions in the EB-free structures for (G) 13-PF GDP-K and (H) 13-PF GMPCPP-K MTs. The models are superimposed on the intermediate domain of the bottom-right β-tubulin (cyan dashed circle), whose EB-contact region (H3′-H3 helices) does not move between all the EM structures analyzed. The Cα-atoms of tubulin residues that are within 5 Å distance from the EB3 CH domain (orange) are shown as balls. See also Figures S3, S4, and S5 and Table S2.
Figure 5
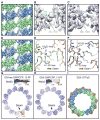
Figure 5. Densities and Atomic Models around the E-Site and N-Site Nucleotides for the Different MT Reconstructions
In all cases, the N-site displays clear density for both the γ-phosphate and the Mg2+ ion (green). Concerning the E-site, only the GMPCPP-K structure shows both the γ-phosphate and Mg2+ (top left panel), while both elements are missing in the GDP-K (top middle panel), EB3-GDP (bottom middle panel) and interestingly, the EB3-GMPCPP state (bottom left panel, black arrow). In the EB3-GTPγS structure (with and without kinesin, top right and bottom right panels), the γ-phosphate is clearly visible, while the Mg2+ ion is not present (red arrows). See also Figure S3 and Tables S1 and S3.
Figure 6
Figure 6. Lateral Interactions between Protofilaments
(A) Cryo-EM density map of merged EB3-GTPγS-MT (with and without kinesin) showing homotypic lateral interactions, viewed from the lumen side. (B and C) Zoom-in view of the density and models of the α-α lateral interactions (B) and β-β lateral interactions (C). (D) Cryo-EM density of the lateral interactions at the seam, obtained from the C1 reconstruction of the “EB-consensus” data. (E and F) Comparisons of the atomic models for the lateral interactions between an α-β contact at the seam (orange) and a non-seam α-α contact (green) (E) or β-β contact (blue) (F). (G and H) Cα-atoms RMSD between models of one helical turn of tubulin dimers for the C1 and the symmetrized reconstructions of the EB-free 13-PF GMPCPP-K-MT (G) and 13-PF EB3-GMPCPP-MT (H). (I) The C1 reconstruction for the EB3-GTPγS-MT (same color scheme as Figure 1), viewed down along the MT axis. See also Figures S6 and S7 and Movie S4.
Figure 7
Figure 7. Schematic of the Conformational Changes Proposed to Accompany GTP Hydrolysis and the Effect of EB Proteins
α- and β-tubulin are illustrated as three domains (N-terminal, Intermediate and C-terminal). The red triangle at the tubulin interdimer interface indicates the anchor point during structural transitions. From GMPCPP (mimicking GTP) to GTPγS (mimicking GDP-Pi) state, changes around the E-site nucleotide (β:T2-H2, β:T5 and α:T7-H8) upon GTP hydrolysis and Mg2+ release accompany a lattice compaction at the interdimer interface (viewed from the side of the MT), with EB (orange) promoting and preferentially binding to the compacted intermediate GDP-Pi state. A subsequent change in lattice twist upon phosphate (Pi) release results in reduced of EB affinity (viewed from the lumen of the MT). See also Figure S3.

References

    1. Akhmanova A, Steinmetz MO. Tracking the ends: a dynamic protein network controls the fate of microtubule tips. Nat Rev Mol Cell Biol. 2008;9:309–322. - PubMed
    1. Allegretti M, Mills DJ, McMullan G, Kühlbrandt W, Vonck J. Atomic model of the F420-reducing [NiFe] hydrogenase by electron cryo-microscopy using a direct electron detector. eLife. 2014;3:e01963. - PMC - PubMed
    1. Alushin GM, Ramey VH, Pasqualato S, Ball DA, Grigorieff N, Musacchio A, Nogales E. The Ndc80 kinetochore complex forms oligomeric arrays along microtubules. Nature. 2010;467:805–810. - PMC - PubMed
    1. Alushin GM, Lander GC, Kellogg EH, Zhang R, Baker D, Nogales E. High-resolution microtubule structures reveal the structural transitions in αβ-tubulin upon GTP hydrolysis. Cell. 2014;157:1117–1129. - PMC - PubMed
    1. Amunts A, Brown A, Bai XC, Llácer JL, Hussain T, Emsley P, Long F, Murshudov G, Scheres SH, Ramakrishnan V. Structure of the yeast mitochondrial large ribosomal subunit. Science. 2014;343:1485–1489. - PMC - PubMed

Publication types

MeSH terms

Substances