. 2015 Aug 13;162(4):751-65.
doi: 10.1016/j.cell.2015.07.009. Epub 2015 Jul 30.

RAG Represents a Widespread Threat to the Lymphocyte Genome

Affiliations

RAG Represents a Widespread Threat to the Lymphocyte Genome

Grace Teng et al. Cell. .

Abstract

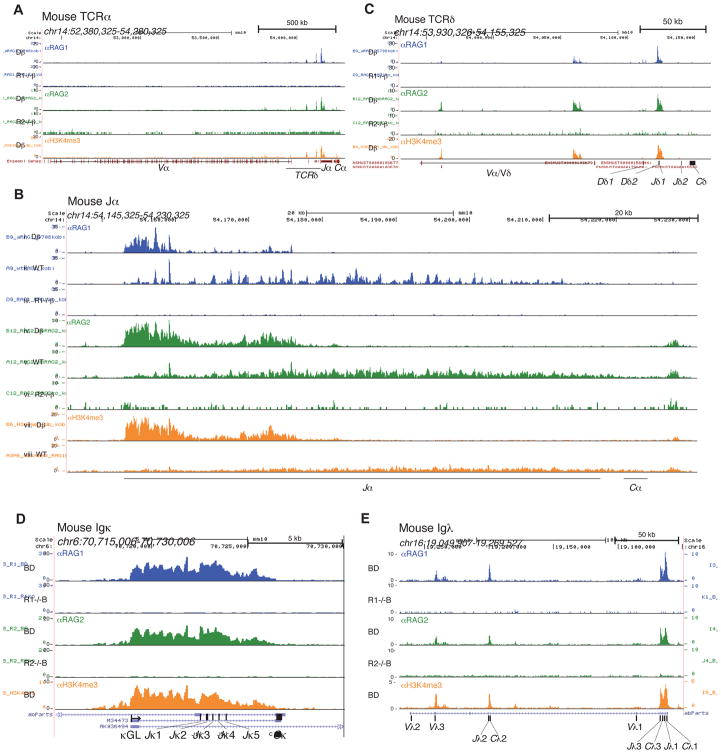
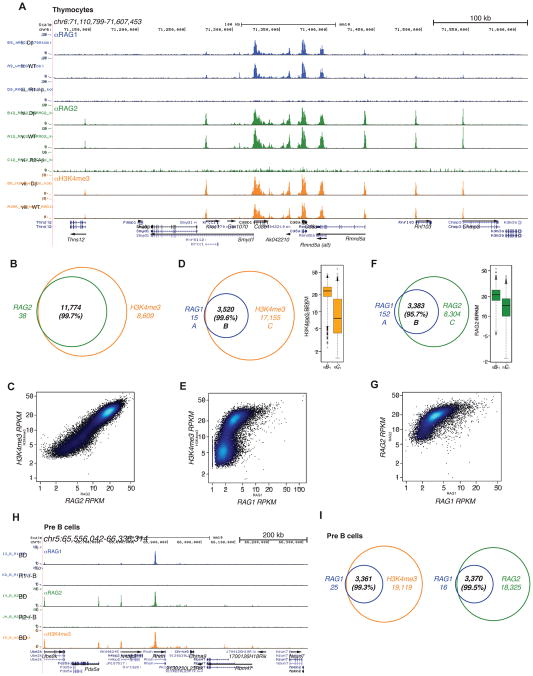
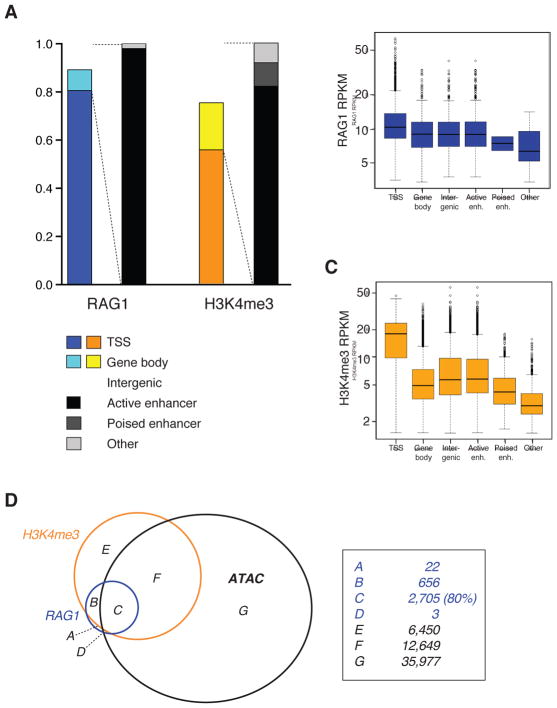
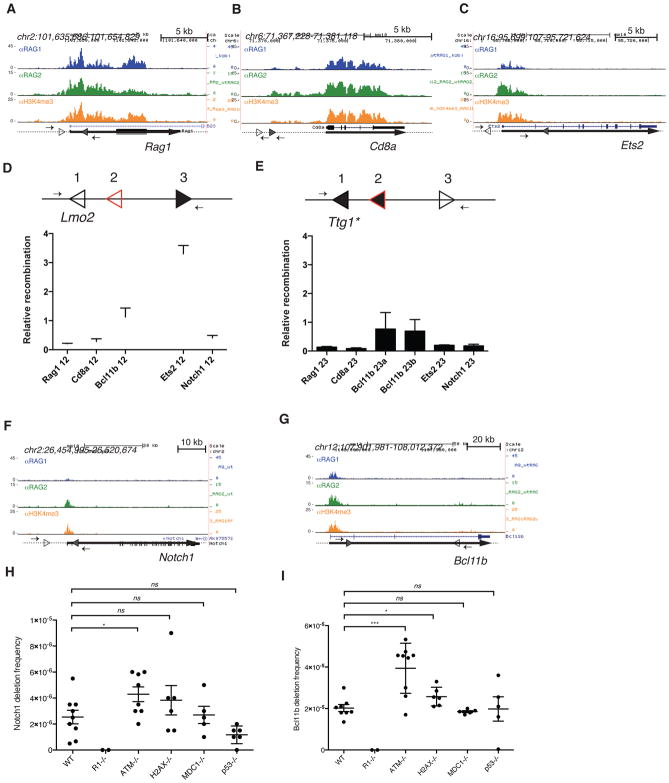
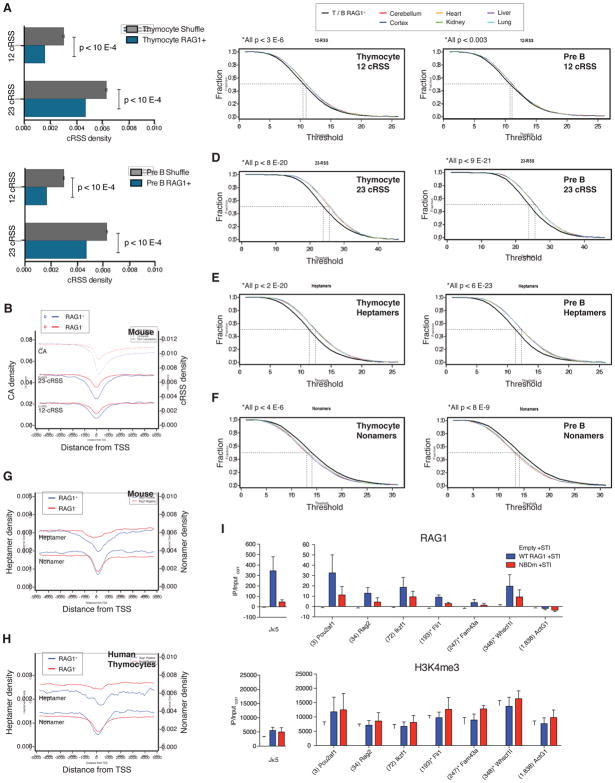
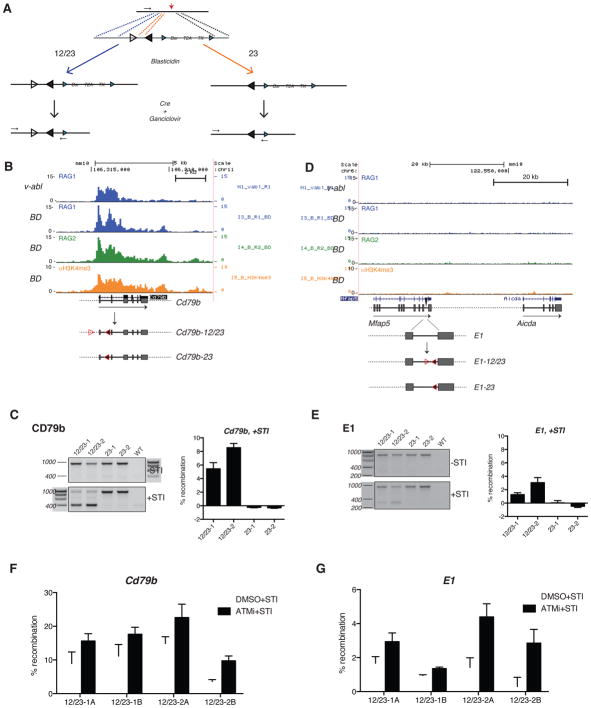
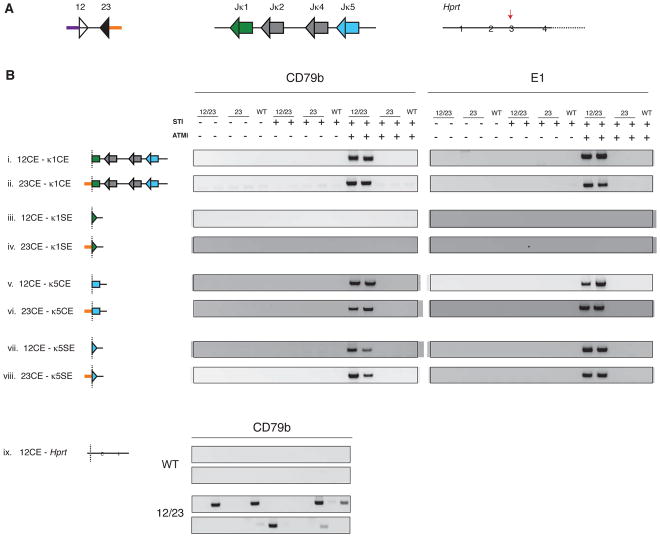
The RAG1 endonuclease, together with its cofactor RAG2, is essential for V(D)J recombination but is a potent threat to genome stability. The sources of RAG1 mis-targeting and the mechanisms that have evolved to suppress it are poorly understood. Here, we report that RAG1 associates with chromatin at thousands of active promoters and enhancers in the genome of developing lymphocytes. The mouse and human genomes appear to have responded by reducing the abundance of "cryptic" recombination signals near RAG1 binding sites. This depletion operates specifically on the RSS heptamer, whereas nonamers are enriched at RAG1 binding sites. Reversing this RAG-driven depletion of cleavage sites by insertion of strong recombination signals creates an ectopic hub of RAG-mediated V(D)J recombination and chromosomal translocations. Our findings delineate rules governing RAG binding in the genome, identify areas at risk of RAG-mediated damage, and highlight the evolutionary struggle to accommodate programmed DNA damage in developing lymphocytes.


Figures

Figure 1
Figure 1. Recombination centers of antigen receptor genes
ChIP-seq (reads per million mapped reads, in raw (unfiltered) form) for RAG1 (blue), RAG2 (green), and H3K4me3 (orange) are shown for selected antigen receptor genes in mouse lymphocytes. (A) The Tcrα/δ locus, (B) Tcrα recombination center (magnified), and (C) TCRδ recombination center (magnified) are shown for thymocytes. (D) The Igκ recombination center (magnified) and (E) Igλ locus are shown for pre-B cells. See also Figure S1.
Figure 2
Figure 2. RAG1 and RAG2 bind to thousands of sites in the lymphocyte genome
(A) ChIP-seq for RAG1, RAG2, and H3K4me3 are shown for a region of chromosome 6 in mouse thymocytes (same color coding as in Figure 1). (B) Overlap and (C) correlation between RAG2 and H3K4me3 peaks. (D) Overlap and (E) correlation between RAG1 and H3K4me3 peaks. (F) Overlap and (G) correlation between RAG1 and RAG2 peaks. Boxplots in (D) and (F) show the H3K4me3 and RAG2 RPKM (reads per kb per million mapped reads), respectively, in sections “B” and “C” of the corresponding Venn diagrams. (H) ChIP-seq for RAG1, RAG2, and H3K4me3 are shown for a selected region of chromosome 5 in mouse pre-B cells. (I) Venn diagrams show the overlap between RAG1 and H3K4me3, and between RAG1 and RAG2 in pre-B cells. The sum of H3K4me3 peaks is not equal between (B) and (D) because one RAG peak can overlap with more than one H3K4me3 peak and vice versa. See also Figure S2 and Table S1.
Figure 3
Figure 3. RAG1 binding sites overlap with TSSs and accessible chromatin
(A) RAG1 and H3K4me3 peaks in mouse thymocytes were characterized by their overlap with TSSs (defined as +/− 2 kb from an annotated gene start position), gene bodies, or intergenic regions. Non-TSS peaks were further categorized as overlapping with active or poised enhancers. (B) RAG1 RPKM and (C) H3K4me3 RPKM are shown for each category of RAG1 peak. (D) Overlap between RAG1, H3K4me3, and accessible chromatin (defined by ATAC-seq) is shown for mouse pre-B cells. See also Figure S3.
Figure 4
Figure 4. Off-target cleavage by RAG is rare and restricted by ATM
RAG1, RAG2, and H3K4me3 ChIP-seq data are shown for (A) Rag1, (B) Cd8a, (C) Ets2, (F) Notch1, and (G) Bcl11b in WT mouse thymocytes. The 12-cRSSs and 23-cRSSs are indicated by open and filled triangles, respectively. Small arrows represent PCR primers used to assay for RAG-dependent deletions or inversions, and thick lines represent gene bodies. (D and E) The intrinsic recombination activity of selected cRSSs was assayed using a plasmid substrate, diagrammed above each panel. Arrows, PCR primers for recombination assay; position 1, reference cRSS (either the Lmo2 12-cRSS or a modified Ttg1 23-cRSS, open triangle); position 2, test 12- or 23-cRSS (red open triangle); position 3, appropriate consensus partner RSS (filled black triangle). Recombination activity (mean +SEM) of each test cRSS is shown relative to that of the reference cRSS. RAG-mediated deletions at the mouse (H) Notch1 and (I) Bcl11b loci were detected using a nested PCR assay. The frequency of deletions (mean ±SEM) is shown for WT, Rag1−/−, Atm−/−, H2ax/, Mdc1−/−, and P53−/− thymocytes. Each point represents data generated from one mouse. Unpaired t-test, *p ≤ 0.05, *** p ≤ 0.001, ns = not significant. See also Figure S4 and Table S3.
Figure 5
Figure 5. Sites of RAG1 binding are preferentially depleted of cryptic RSSs
(A) The density of 12- and 23-cRSSs was calculated for regions of the genome containing a RAG1 binding peak (blue) in mouse thymocytes (top) or pre-B cells (bottom) compared to randomly assigned (Shuffle, gray) genomic regions (10,000 shuffles ± standard deviation). (B) The densities of 12-cRSSs, 23-cRSSs, and CA dinucleotides were plotted across a 10 kb region centered on the TSS in mouse lymphocytes. RAG1+ regions include those bound by RAG1 in either mouse thymocytes or pre-B cells. (C) The 12-cRSS content in RAG1+ H3K4me3+ regions in mouse thymocytes (left) and pre-B cells (right) was compared to the 12-cRSS content in comparable H3K4me3+ regions of non-lymphoid tissues. Cumulative distribution plots show the fraction of regions that contain more than a threshold number (x-axis) of 12-cRSSs. A shift to the left indicates depletion; a shift to the right indicates enrichment. Similar analyses were done for (D) 23-cRSSs, (E) high scoring heptamers, and (F) high scoring nonamers. Densities of high scoring heptamers and nonamers in RAG1+ and RAG1− regions are plotted relative to TSSs for (G) mouse lymphocytes and (H) human thymocytes. (I) RAG1 and H3K4me3 ChIP-qPCR (mean + SEM, n=3) in STI-571-treated Rag1−/− v-abl cells reconstituted with a retrovirus expressing no RAG1 (empty), WT RAG1, or RAG1 NBD mutant (NBDm). See also Figure S5 and Table S4.
Figure 6
Figure 6. Insertion of RSSs into the genome results in ectopic V(D)J recombination
(A) Strategy for targeted introduction of RSSs into the genome. Diagrammed are the target locus (TALEN cleavage site, red arrow) and targeting construct (blue triangles, LoxP sites; Bsr, Blasticidin resistance gene; T2A, self-cleaving peptide; TK, thymidine kinase; black arrows, PCR primers to detect recombination; open and filled triangles, consensus 12 and 23 RSSs, respectively). Depending on the region of crossover in the 5′ homology arm, indicated by the dashed blue and orange lines, homologous recombination results in either 12/23 or 23-RSSki, respectively. RAG1 binding patterns at the mouse (B) Cd79b locus and (D) Aicda E1 enhancer are shown in v-abl-transformed pre-B cells treated with STI-571 for 48 hours. RAG1, RAG2, and H3K4me3 ChIP-seq data are also shown for pre-B cells from BD mice. The RSSki alleles are diagrammed at the bottom. PCR was used to assay for recombination between the knocked-in RSSs in the (C) Cd79b locus and (E) Aidca E1 enhancer pre- and post-treatment with STI-571. The assay is specific to the RSSki allele, and amplifies a product from both the un-recombined (upper band) and recombined (lower band) loci. Two clones are shown for each RSSki cell line, along with the parental v-abl cell line (WT), where the knock-in allele is not amplified by PCR. Histograms show the percent recombination in each cell line after STI-571 treatment, as determined by a semi-quantitative PCR assay. The effects of ATM inhibition (treatment with either ATM inhibitor [black bars] or DMSO [white bars] in combination with STI-571) on recombination are shown for the (F) Cd79b and (G) Aicda E1 12/23-RSSki cell lines. Two subclones (designated “A” and “B”) are shown for each of the 12/23-RSSki cell lines. See also Figure S6 and Table S5.
Figure 7
Figure 7. RAG-dependent breaks at knocked-in RSSs undergo long-range chromosome rearrangements
(A) Three loci were tested for translocations (left to right): the RSSki, Igκ, and Hprt (targeted for cleavage by CRISPR/Cas9). Purple, 12RSS coding end; orange, 23RSS coding end; green triangle, Jκ1 23RSS; green rectangle, Jκ1 gene segment (coding end); blue triangle, Jκ5 23RSS; blue rectangle, Jκ5 gene segment (coding end); red arrow, CRISPR/Cas9 cleavage site. (B) RSSki lines were tested for translocation activity using PCR assays to detect junctions between RSSki DSBs and RAG-dependent DSBs originating from Igκ (i-viii) or RAG-independent DSBs generated at Hprt (ix). The outcome of each translocation is diagrammed. 12/23-RSSki (12/23), 23-RSSki (23), and WT cell lines were assayed with or without treatment with STI-571 (STI) and an ATM inhibitor (ATMi). Translocation products were amplified in at least two independent PCR experiments. To illustrate translocations between the CD79b RSSki and Hprt (ix), a set of 24 PCR reactions are shown for either wild-type (WT) cells or a Cd79b 12/23-RSSki cell line. See also Figure S7 and Table S6.

References

    1. Agard EA, Lewis SM. Postcleavage sequence specificity in V(D)J recombination. Mol Cell Biol. 2000;20:5032–5040. - PMC - PubMed
    1. Ashworth TD, Pear WS, Chiang MY, Blacklow SC, Mastio J, Xu L, Kelliher M, Kastner P, Chan S, Aster JC. Deletion-based mechanisms of Notch1 activation in T-ALL: key roles for RAG recombinase and a conserved internal translational start site in Notch1. Blood. 2010;116:5455–5464. - PMC - PubMed
    1. Askary A, Shimazaki N, Bayat N, Lieber MR. Modeling of the RAG reaction mechanism. Cell Rep. 2014;7:307–315. - PMC - PubMed
    1. Biggin MD. Animal transcription networks as highly connected, quantitative continua. Dev Cell. 2011;21:611–626. - PubMed
    1. Bredemeyer AL, Sharma GG, Huang CY, Helmink BA, Walker LM, Khor KC, Nuskey B, Sullivan KE, Pandita TK, Bassing CH, et al. ATM stabilizes DNA double-strand-break complexes during V(D)J recombination. Nature. 2006;442:466–470. - PubMed

Publication types

Substances

Associated data