. 2015 Aug 12;18(2):157-68.
doi: 10.1016/j.chom.2015.07.001. Epub 2015 Jul 30.

STING Activation by Translocation from the ER Is Associated with Infection and Autoinflammatory Disease

Affiliations

STING Activation by Translocation from the ER Is Associated with Infection and Autoinflammatory Disease

Nicole Dobbs et al. Cell Host Microbe. .

Abstract

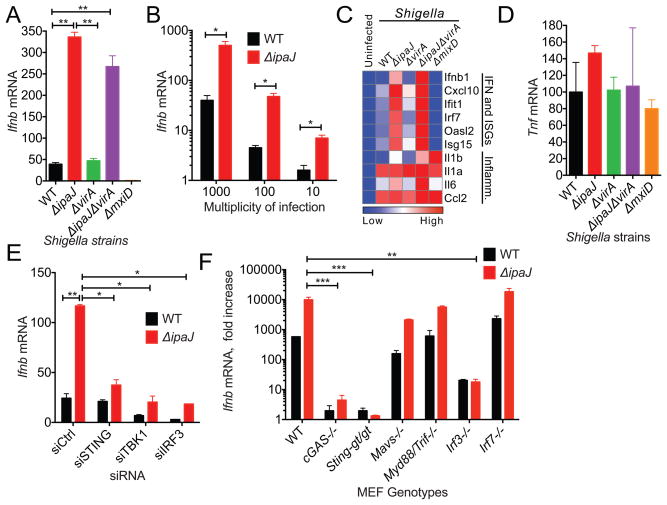
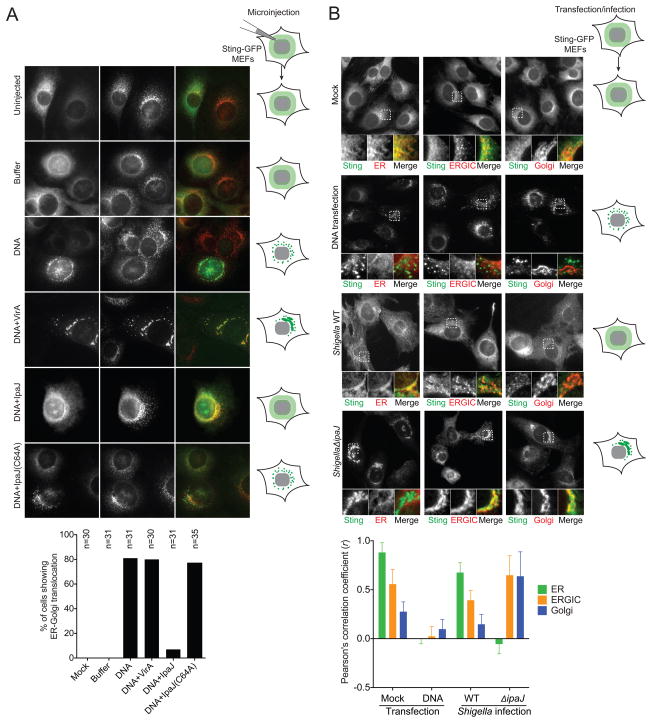
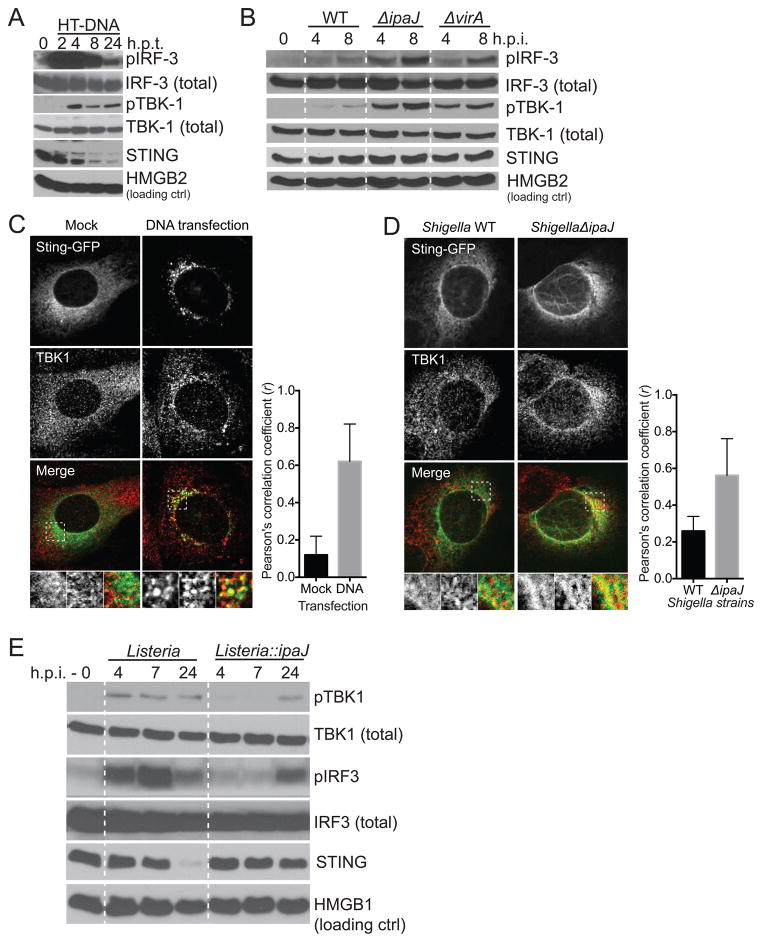
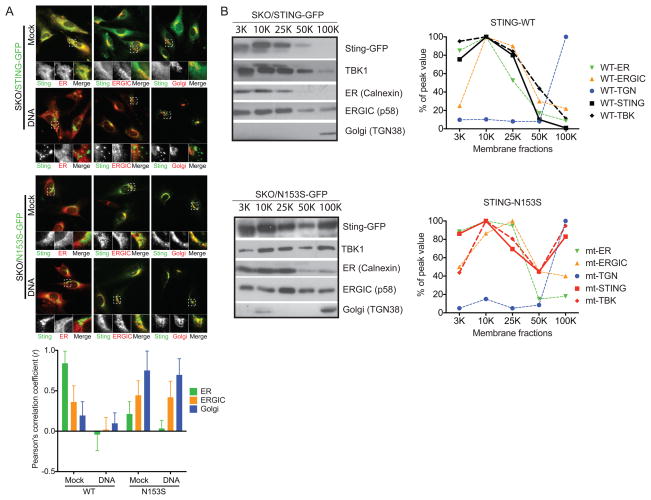
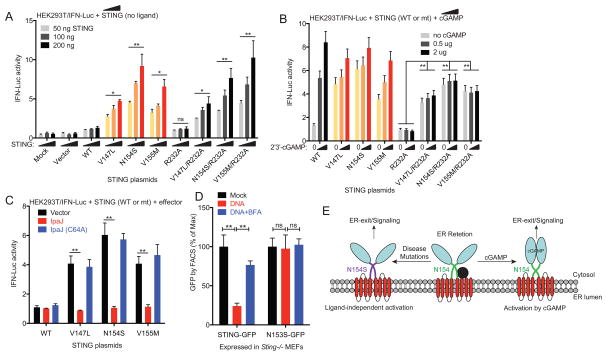
STING is an ER-associated membrane protein that is critical for innate immune sensing of pathogens. STING-mediated activation of the IFN-I pathway through the TBK1/IRF3 signaling axis involves both cyclic-dinucleotide binding and its translocation from the ER to vesicles. However, how these events are coordinated, and the exact mechanism of STING activation, remain poorly understood. Here, we found that the Shigella effector protein IpaJ potently inhibits STING signaling by blocking its translocation from the ER to ERGIC, even in the context of dinucleotide binding. Reconstitution using purified components revealed STING translocation as the rate-limiting event in maximal signal transduction. Furthermore, STING mutations associated with autoimmunity in humans were found to cause constitutive ER exit and to activate STING independent of cGAMP binding. Together, these data provide compelling evidence for an ER retention and ERGIC/Golgi-trafficking mechanism of STING regulation that is subverted by bacterial pathogens and is deregulated in human genetic disease.


Conflict of interest statement

The authors have no conflict of interest.

Figures

Figure 1
Figure 1. Shigella effector IpaJ inhibits STING-mediated IFN activation
(A) Quantitative RT-PCR analysis of Ifnb mRNA in MEFs infected with indicated Shigella strains for 8 hours. Individual gene expression value was normalized to housekeeping gene Gapdh (same throughout). (B) Quantitative RT-PCR analysis of Ifnb mRNA in MEFs infected with Shigella WT or ΔipaJ at indicated m.o.i. for 8 hours. (C) Quantitative RT-PCR array analysis of immune gene expression (indicated on the right) in MEFs infected with various Shigella strains (indicated on the top). (D) Quantitative RT-PCR analysis of Tnf mRNA in MEFs infected with indicated Shigella strains for 8 hours as in A. (E) Quantitative RT-PCR analysis of Ifnb mRNA in siRNA knockdown MEFs infected with Shigella WT or ΔipaJ. MEFs were transfected with indicated siRNA, and two days later infected with Shigella WT or ΔipaJ. Ifnb mRNA was measured 8 h after infection. (F) Quantitative RT-PCR analysis of Ifnb mRNA in WT or knockout MEFs (indicated on the bottom) infected with Shigella WT or ΔipaJ. *P < 0.05, **P < 0.01, ***P < 0.001 (same throughout). Data are representative of at least three independent experiments. Error bars, SEM. Unpaired t-test.
Figure 2
Figure 2. Listeria/ipaJ chimeric bacteria infection blocks STING signaling
(A) A schematic diagram of Shigella subversion and Listeria activation of the STING pathway (left) and Listeria chimera design for expressing Shigella effectors (right). (B) Fluorescent microscope of HeLa cells infected with indicated Listeria strains. The cis-Golgi (red) was detected by α-GM130 antibody. Arrows indicate disrupted Golgi apparatus. (C) Bacteria load in MEFs infected with indicated Listeria strains in a time course. (D) Quantitative RT-PCR analysis of Ifnb and Tnf mRNA in MEFs infected with indicated Shigella strains for 8 hours. Data are representative of at least three independent experiments. Error bars, SEM. Unpaired t-test (D). See also Figure S2.
Figure 3
Figure 3. Reconstituting cytosolic DNA sensing through microinjection
(A) Fluorescent micrographs show STING-GFP localization in MEFs after microinjection. STING-GFP MEFs were microinjected with buffer alone, DNA alone or DNA plus recombinant effector proteins (indicated on the left). Cells were fixed 6 h later and co-strained with an ERGIC marker, ERGIC/p58 (in red). * marks injected cells. Arrows indicate activated STING in vesicles, Arrowheads indicate activated STING on the ERGIC. Schematic models of STING localization under various conditions are shown on the right. Quantitation is shown below (n=30). (B) Fluorescent micrographs show STING-GFP localization in MEFs after DNA transfection or Shigella infection. STING-GFP MEFs were left untreated, transfected with HT-DNA, or infected with Shigella WT or ΔipaJ. Cells were fixed 8 h later and co-stained with ER (Calnexin), ERGIC (P58) or Golgi (GM130). Schematic models of STING localization under various conditions are shown on the right. Quantitation of colocalization was calculated as Pearson’s correlation coefficient (r) shown below (n=15). Images are representative of at least three independent experiments. See also Figure S3.
Figure 4
Figure 4. STING signaling kinetics and activation on ERGIC
(A, B) Immunoblots show kinetics of IRF3 and TBK1 phosphorylation in MEFs after HT-DNA transfection (A) or Shigella infection (B). (C, D) Fluorescent micrographs show STING-GFP and endogenous TBK1 localization in MEFs after DNA transfection (C) or Shigella infection (D). MEFs were transfected or infected as in Figure 3B. Cells were fixed 8 h later and co-stained with an TBK1 antibody. Quantitation of colocalization was calculated as Pearson’s correlation coefficient (r) shown below. (E) Immunoblots show kinetics of IRF3 and TBK1 phosphorylation in MEFs after infection of indicated Listeria strains. Data are representative of at least three independent experiments. See also Figure S4.
Figure 5
Figure 5. Disease-associated STING mutants constitutively localize to the ERGIC
(A) Fluorescent micrographs show WT mSting-GFP or mSting-N153S-GFP localization in MEFs. N153S in mouse Sting corresponds to N154S disease mutation in human STING. WT or mutant mSTING-GFP is stably expressed in Sting-/- MEFs using a retroviral vector following by selection. Each reconstituted MEFs were mock treated or transfected with HT-DNA. Cells were fixed 8 hours later and co-stained with ER (Calnexin), ERGIC (P58) and Golgi (GM130) markers. Quantitation of colocalization was calculated as Pearson’s correlation coefficient (r) shown below (n=15). (C) Membrane fractionation of WT or N153S STING-GFP reconstituted cells by differential centrifugation (see Method for details). Cell organelle pellets at indicated centrifugation speed (top) were analyzed by immunobloting. Distribution of WT and N153S STING in relationship to ER, ERGIC and Golgi markers is shown on the right based on quantitation of immunoblot in ImageJ. Data are representative of at least two independent experiments.
Figure 6
Figure 6. STING disease mutants activate IFN signaling independent of ligand binding
(A) IFNβ-Luc reporter assay. HEK293T cells were transfected with IFNβ-Firefly Luc, CMV-Renilla Luciferase and increasing amount of indicated human STING plasmid (50–200 ng). Luciferase activity was determined by Dual-luc assay 24 h post transfection. (B) IFNβ-Luc reporter assay. Similar to A, except that various WT and mutant STING plasmids are fixed at 100 ng, and 24 h after STING expression, cells were stimulated with increasing amount of 2′3′-cGAMP for 20 h. (C) IFNβ-Luc reporter assay. Similar to A, except that IpaJ or IpaJ(C46A) plasmid (as indicated) were also co-transfected with STING plasmids. (D) FACS analysis of WT or N153S STING-GFP degradation after HT-DNA transfection. WT or N153S STING-GFP cells were mock treated (Mock), transfected with HT-DNA (DNA), or treated with BFA then transfected with HT-DNA (DNA+BFA). GFP fluorescent intensity was measured 24 hours later by FACS. (E) A model that illustrates two modes of STING activation: by cGAMP binding or by disease mutations. Data are representative of at least three independent experiments. Error bars, SEM. Paired t-test (A–D). See also Figure S6.

Comment in

  • STING Signaling the enERGIC Way.
    Hiller B, Hornung V. Hiller B, et al. Cell Host Microbe. 2015 Aug 12;18(2):137-9. doi: 10.1016/j.chom.2015.07.014. Cell Host Microbe. 2015. PMID: 26269948

References

    1. Burdette DL, Monroe KM, Sotelo-Troha K, Iwig JS, Eckert B, Hyodo M, Hayakawa Y, Vance RE. STING is a direct innate immune sensor of cyclic di-GMP. Nature 2011 - PMC - PubMed
    1. Burdette DL, Vance RE. STING and the innate immune response to nucleic acids in the cytosol. Nat Immunol. 2013;14:19–26. - PubMed
    1. Burnaevskiy N, Fox TG, Plymire DA, Ertelt JM, Weigele BA, Selyunin AS, Way SS, Patrie SM, Alto NM. Proteolytic elimination of N-myristoyl modifications by the Shigella virulence factor IpaJ. Nature. 2013;496:106–109. - PMC - PubMed
    1. Burnaevskiy N, Peng T, Reddick LE, Hang HC, Alto NM. Myristoylome profiling reveals a concerted mechanism of ARF GTPase deacylation by the bacterial protease IpaJ. Molecular Cell. 2015 In Press. - PMC - PubMed
    1. Cai X, Chiu YH, Chen ZJ. The cGAS-cGAMP-STING pathway of cytosolic DNA sensing and signaling. Mol Cell. 2014;54:289–296. - PubMed

Publication types