. 2015 Aug 3;16(1):145.
doi: 10.1186/s13059-015-0719-9.

Estrogen-induced chromatin decondensation and nuclear re-organization linked to regional epigenetic regulation in breast cancer

Affiliations

Estrogen-induced chromatin decondensation and nuclear re-organization linked to regional epigenetic regulation in breast cancer

Sehrish Rafique et al. Genome Biol. .

Abstract

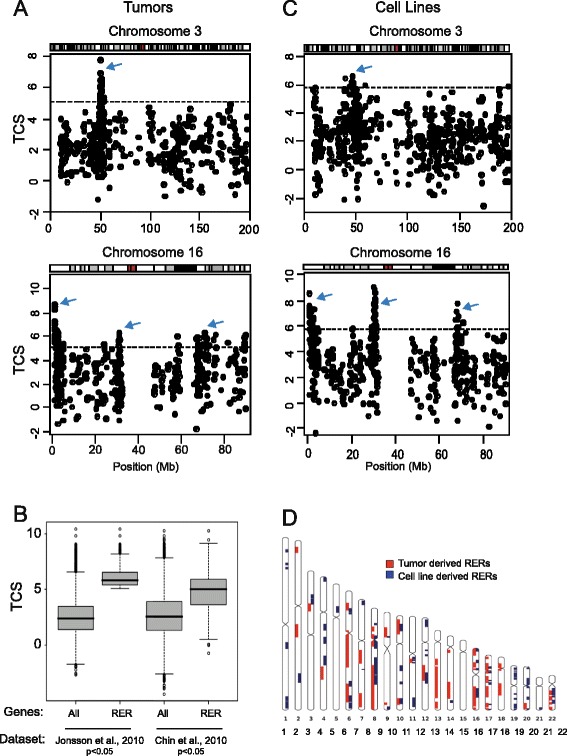
Background: Epigenetic changes are being increasingly recognized as a prominent feature of cancer. This occurs not only at individual genes, but also over larger chromosomal domains. To investigate this, we set out to identify large chromosomal domains of epigenetic dysregulation in breast cancers.

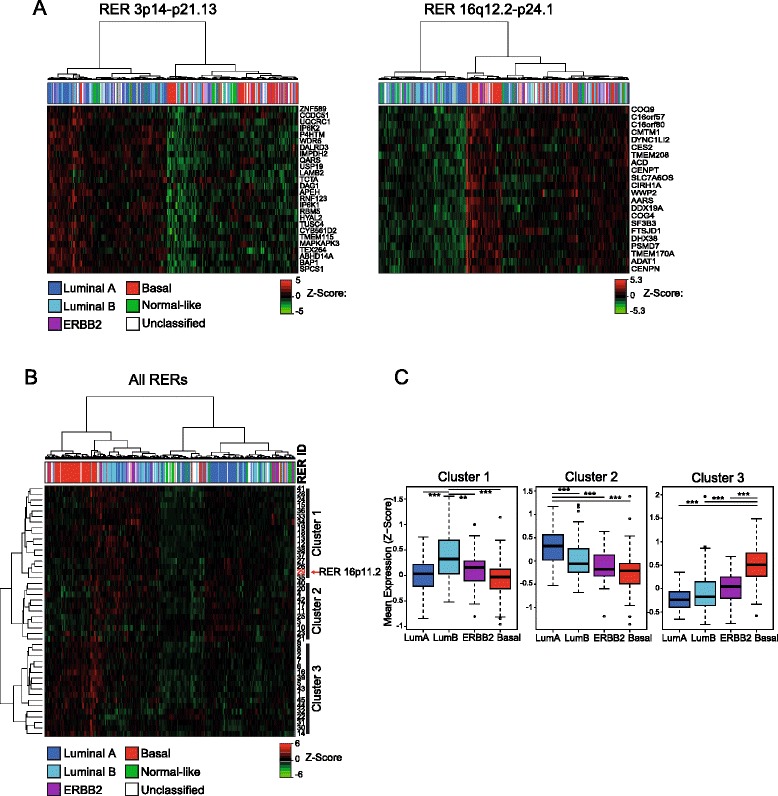
Results: We identify large regions of coordinate down-regulation of gene expression, and other regions of coordinate activation, in breast cancers and show that these regions are linked to tumor subtype. In particular we show that a group of coordinately regulated regions are expressed in luminal, estrogen-receptor positive breast tumors and cell lines. For one of these regions of coordinate gene activation, we show that regional epigenetic regulation is accompanied by visible unfolding of large-scale chromatin structure and a repositioning of the region within the nucleus. In MCF7 cells, we show that this depends on the presence of estrogen.

Conclusions: Our data suggest that the liganded estrogen receptor is linked to long-range changes in higher-order chromatin organization and epigenetic dysregulation in cancer. This may suggest that as well as drugs targeting histone modifications, it will be valuable to investigate the inhibition of protein complexes involved in chromatin folding in cancer cells.


Figures

Fig. 1
Fig. 1
Identifying RER in breast tumors and cancer cell lines. a, c Transcription correlation score (TCS) maps for chromosomes 3 and 16 using data from breast tumors [22] (a) and breast cancer cell lines [20] (c). The horizontal dotted line indicates the significance threshold. Arrows indicate regions containing genes with significant TCSs. b Boxplots showing the distribution of TCSs generated for all genes and for RER genes using two independent breast tumor datasets [22, 23]. d Ideograms showing the location of the 45 RER regions identified in breast tumors (red) and the 71 RER regions identified in breast cancer cell lines (blue)
Fig. 2
Fig. 2
Gene expression changes in tumors and normal tissue. Box plots show the distribution of mean centered z scores of gene expression in tumor samples and normal breast tissue and breast organoids [28] for genes in the RER regions at 2p24.2-p25.1 (a), 12q15-q21.33 (b) and 16p11.2 (c). Data for tumors are separated according to ER status and Wilcoxon tests were used to determine whether or not there was a significant difference between tumor and normal samples taken together
Fig. 3
Fig. 3
Properties of RER regions and tumor subtypes. a Unsupervised hierarchical cluster analysis of breast tumor samples for RER regions at 3p14-p21.31 (left) and 16q12.2-q24.1 (right). Heat maps of gene expression z scores with hierarchical clustering of samples (red high expression, green low expression). Genes are ordered by their position in the genome. Subtype information [22] for each tumor sample is identified by the color-coded matrix: luminal A (blue), luminal B (turquoise), ERBB2 (purple), basal (red), normal-like (green). Only genes in the regions with significant TCSs are shown. b As in (a) but for mean expression (mean z score of genes with significant TCSs) for all RER regions in each breast tumor sample, showing clustering of RER regions into three groups. Both the RER regions and samples were subject to hierarchical clustering. c Box plots showing mean expression (mean z score of genes with significant TCSs) of RER regions from clusters 1, 2 and 3 in breast tumors of different subtypes; luminal A (LumA, blue), luminal B (LumB, turquoise), ERBB2 (purple), basal-like (red). **p < 0.01, ***p < 0.001, Wilcoxon test)
Fig. 4
Fig. 4
Properties of RER regions in breast cancer cell lines. Analysis of mean expression (mean z score of genes with significant TCSs) levels in breast cancer cell lines for cluster 1 RER regions (a) and RER regions of clusters 2 and 3 (c). RER regions were subject to hierarchical clustering and cell lines were ordered by their overall level of expression of each RER cluster. Box plots showing mean expression (mean z score of genes with significant TCSs) of RER regions from cluster 1 (b) and clusters 2 and 3 (d) in ER+ (gray) and ER− (white) breast cancer cell lines (*p < 0.05, ***p < 0.001)
Fig. 5
Fig. 5
Refinement and analysis of the 16p11.2 RER region in breast cancer cell lines. a Black bars indicate genes along 16p11.2, oriented from centromere (top) to telomere (bottom), which have significant TCSs at varying window (2n + 1) size with n from 1 to 10. Gene expression data are from tumor cell lines [20]. Gene names are listed to the right, as are the position of fluorescence in situ hybridization (FISH) probes that were used to examine the four RER subregions. b Box plots show the distribution of normalized FISH interprobe distances (d 2 /r 2) [31, 32] measured across the four subregions of the 16p11.2 RER region in MCF7 and MDAMB231 breast cancer cell lines. n = 45–60 nuclei. The significance of differences between datasets was assessed by Wilcox test (Table S3 in Additional file 1). c Unsupervised cluster analysis of gene expression z scores for subregion 2 in 48 breast cancer cell lines (red ER−, blue ER+) [20]. Cell line names are indicated along the bottom of the heat map. Red/green z scores equate to increased/decreased gene expression, respectively. Genes are ordered by their position on the chromosome and listed to the right. The yellow boxes indicate cell lines examined by FISH. d Example FISH images using probe pairs (red and green) that delineate subregion 2 (as in (a)) in ER+ cell lines MCF7 and LY2 (upper panels), and ER− cell lines MDAMB231 and MDAMB468 (lower panels). DNA is stained with DAPI (blue). Scale bar = 5 μm. The boxplots to the right show the distribution of normalized FISH interprobe distances (d 2 /r 2) across subregion 2 in the four cell lines. n = 45–60 nuclei. The significance of differences between datasets was assessed by Wilcox test (Table S3 in Additional file 1)
Fig. 6
Fig. 6
Chromatin compaction at subregion 2 of the 16p11.2 RER region in breast cancer cell lines, in normal breast tissue and in primary breast tumors. a Box plots comparing the distribution of normalized FISH interprobe distances (d 2 /r 2) measured across subregion 2 of the 16p11.2 RER region in a normal breast cell line (HMLE) and in ER+ (MCF7, LY2, MDAMB361) and ER− (MDAMB231 and MDAMB468) breast cancer cell lines. n = 45–60 cells. The significance of differences between datasets was assessed by Wilcox test (Table S3 in Additional file 1). b Box plots showing the distribution of normalized FISH interprobe distances (d 2 /r 2) measured across subregion 2 of the 16p11.2 RER region in normal breast tissue and in ER+ and ER− tumor tissues. n = 250–300 alleles. Distances in the ER+ tumor were significantly greater than in normal tissue (p < 0.0001) or in the ER− tumor (p = 0.004). Differences between normal and ER− tumor tissue were not significant (p = 0.24). c Example FISH images using probe pairs (red and green) that delineate subregion 2 in normal breast tissue and in ER+ and ER− tumor tissue. DNA is stained with DAPI (blue). Scale bar = 5 μm
Fig. 7
Fig. 7
The effect of estrogen on chromatin compaction and nuclear organization at subregion 2 of the 16p11.2 RER region. a Map of the 16p11.2 RER subregion 2 showing the location of ER binding sites (red) in MCF7 cells (from [38]). Below, the location of genes in the region is shown from the UCSC Genome Browser NCBI36/hg18 assembly of the human genome. b, c Box plots comparing the distribution of normalized FISH interprobe distances (d 2 /r 2) measured across subregion 2 of the 16p11.2 RER region in ER+ MCF7 (b) and ER− MDAMB231 (c) breast cancer cell lines. Data are shown for cells grown in normal serum, in media stripped of hormone for 3 days (−E2), and after addition of 100 nm estrogen for 24 hours (+E2). n = 60 cells for each sample. d, e The percentage of FISH hybridization signals for subregion 2 of the 16p11.2 RER region found in each of five shells of equal area eroded from the edge of the nucleus (shell 1) through to the nuclear center (shell 5), in MCF7 (d) and MDAMB231 cells (e) grown in normal serum (grey shaded bars), hormone stripped media (−E2, white) and after addition of 100 nm estrogen for 24 hours (+E2, black)
Fig. 8
Fig. 8
RER regions and TADs do not overlap. Diagrams of the RER regions at 6q23 (top) and 16p11.2 (bottom), showing the extent of the two RER regions and the location of TADs in the T47D breast cancer line (purple), IMR90 fibroblasts (red) and human ESCs (blue). TAD data are from [43, 44]

References

    1. Timp W, Feinberg AP. Cancer as a dysregulated epigenome allowing cellular growth advantage at the expense of the host. Nat Rev Cancer. 2013;13:497–510. doi: 10.1038/nrc3486. - DOI - PMC - PubMed
    1. Clark SJ. Action at a distance: epigenetic silencing of large chromosomal regions in carcinogenesis. Hum Mol Genet. 2007;16:R88–95. doi: 10.1093/hmg/ddm051. - DOI - PubMed
    1. Coolen MW, Stirzaker C, Song JZ, Statham AL, Kassir Z, Moreno CS, et al. Consolidation of the cancer genome into domains of repressive chromatin by long-range epigenetic silencing (LRES) reduces transcriptional plasticity. Nat Cell Biol. 2010;12:235–46. - PMC - PubMed
    1. Ghanbarian AT, Hurst LD. Neighboring genes show correlated evolution in gene expression. Mol Biol Evol. 2015;32:1748–66. doi: 10.1093/molbev/msv053. - DOI - PMC - PubMed
    1. Sproul D, Gilbert N, Bickmore WA. The role of chromatin structure in regulating the expression of clustered genes. Nat Rev Genet. 2005;6:775–81. doi: 10.1038/nrg1688. - DOI - PubMed

Publication types