. 2015 Aug 3:6:7922.
doi: 10.1038/ncomms8922.

Structural and mechanistic insights into phospholipid transfer by Ups1-Mdm35 in mitochondria

Affiliations

Structural and mechanistic insights into phospholipid transfer by Ups1-Mdm35 in mitochondria

Yasunori Watanabe et al. Nat Commun. .

Abstract

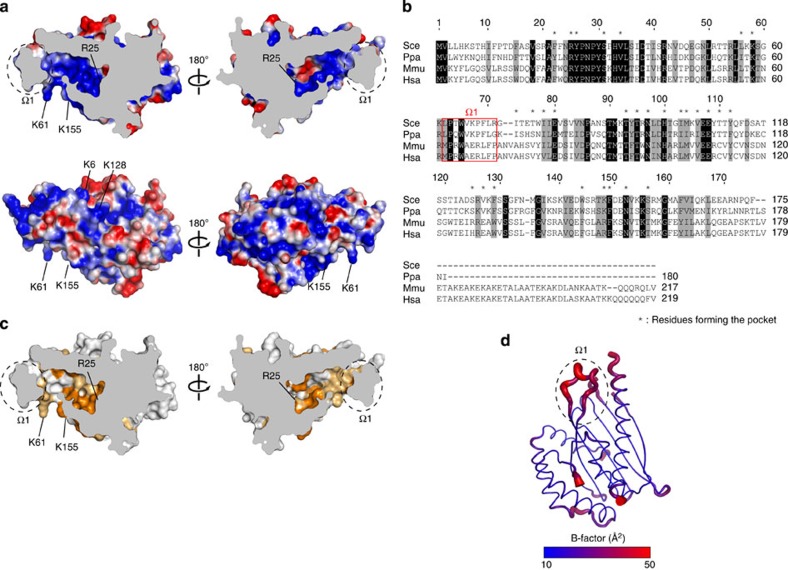
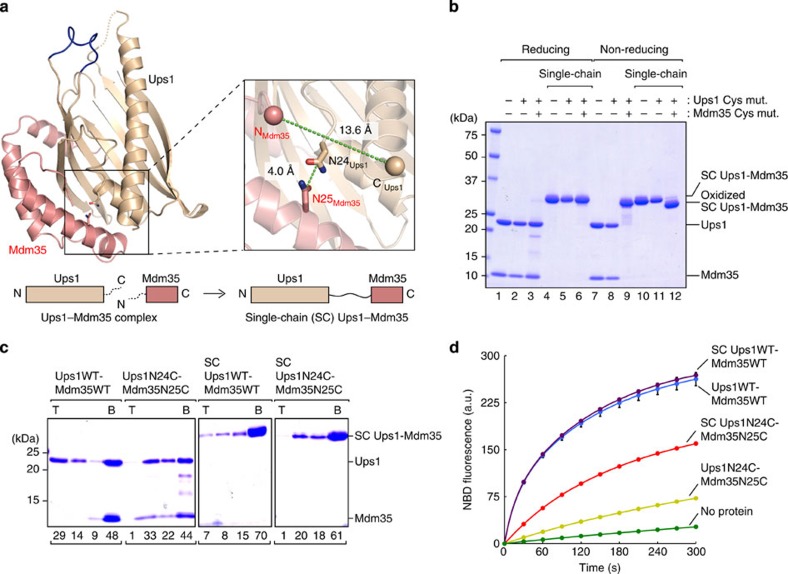
Eukaryotic cells are compartmentalized into membrane-bounded organelles whose functions rely on lipid trafficking to achieve membrane-specific compositions of lipids. Here we focused on the Ups1-Mdm35 system, which mediates phosphatidic acid (PA) transfer between the outer and inner mitochondrial membranes, and determined the X-ray structures of Mdm35 and Ups1-Mdm35 with and without PA. The Ups1-Mdm35 complex constitutes a single domain that has a deep pocket and flexible Ω-loop lid. Structure-based mutational analyses revealed that a basic residue at the pocket bottom and the Ω-loop lid are important for PA extraction from the membrane following Ups1 binding. Ups1 binding to the membrane is enhanced by the dissociation of Mdm35. We also show that basic residues around the pocket entrance are important for Ups1 binding to the membrane and PA extraction. These results provide a structural basis for understanding the mechanism of PA transfer between mitochondrial membranes.


Figures

Figure 1
Figure 1. Crystal structures of Mdm35 and the Ups1–Mdm35 complex.
(a) A ribbon diagram of the structure of Mdm35. The four Cys residues and α-helices are labelled. (b) A ribbon diagram of the structure of the Ups1–Mdm35 complex. Ups1 and Mdm35 are coloured in light brown and pink, respectively, and Ω-loop of Ups1 in blue. The α-helices, β-strands, and Ω-loop are labelled. (c) The Ups1 (molecular surface)–Mdm35 (ribbon diagram) complex viewed from different angles. Hydrophobic residues of Ups1 are coloured in yellow, and those of Mdm35 are shown by stick model with N blue and O red.
Figure 2
Figure 2. Interactions of Ups1 and Mdm35.
(a) Interaction surface between Ups1 and Mdm35. Residues in Ups1 and Mdm35 are labelled in black and red, respectively. Conserved residues and type-conserved residues are indicated by boxes and dashed boxes, respectively. (b) Sequence alignment of Mdm35 homologues. Gaps are introduced to maximize the similarity. Conserved residues are shaded in black, and Type-conserved residues in grey. Residues marked by asterisks are involved in the interaction with Ups1. Sce, Saccharomyces cerevisiae; Ppa, Pichia pastoris; Mmu, Mus musculus; Hsa, Homo sapiens. (c) Mapping of the residues conserved (blue) or type-conserved (light blue) among the Mdm35 homologues on the Mdm35 structure. (d) 10 μM of GST-Mdm35 mutants and 10 μM of His6–Ups1–Mdm35 in 20 mM Tris-HCl, pH 7.5, and 150 mM NaCl were incubated with 50 μl of GS4B resin at 37 °C for 15 min. Proteins bound to the resin were eluted by 10 mM glutathione and analysed by SDS-PAGE followed by immunoblotting with the anti-His-tag antibody. Amounts of eluted proteins were quantified and shown below the gel (WT is set to 100). (e) mdm35Δ cells expressing Ups1-FLAG or Ups2-FLAG and indicated Mdm35 mutants (under the control of the GAL1 promoter) were grown in SCGal containing 2% sucrose. Whole-cell lysates were subjected to SDS–PAGE and immunoblotting with the indicated antibodies.
Figure 3
Figure 3. Lid and pocket of Ups1–Mdm35.
(a) Cutaway representation of the Ups1–Mdm35 complex at the level of the pocket, and coloured according to the surface electrostatic potential. (b) Sequence alignment of Ups1 homologues. The conserved residues and type-conserved residues are shaded in black and grey, respectively. Residues constituting the Ω1 loop are indicated by red box, and residues forming the pocket by asterisks. Sce, S. cerevisiae; Ppa, P. pastoris; Mmu, M. musculus; Hsa, H. sapiens. (c) Mapping of the residues conserved among the Ups1 homologues (orange, conserved residues; light orange, type-conserved residues) on the molecular surface of Ups1–Mdm35 in a cutaway representation as in a. (d) The crystallographic B-factors of Ups1–Mdm35 are coloured in a gradient ranging from blue (10 Å2) to red (50 Å2).
Figure 4
Figure 4. Structure of the Ups1–Mdm35–PA complex.
(a) Ribbon diagram of the Ups1–Mdm35 complex with DLPA. The DLPA molecule is shown in space-filling form with C yellow, O red and P orange. (b) Electron density map of the DLPA molecule. The simulated annealing FoFc difference Fourier map was calculated by omitting the DLPA molecule, and is shown with blue meshes countered at 3.0σ. DLPA is superimposed in stick model. (c) Bound DLPA in stick model with the cutaway representation of Ups1–Mdm35 as in Fig. 3a. (d) Superposition of the apo-form (red) and PA-bound form (light blue) of Ups1–Mdm35. (e) Magnified view showing the detailed interaction around the phosphate group of the DLPA molecule. Residues responsible for DLPA recognition are shown as stick models. Broken lines designate possible hydrogen bonds.
Figure 5
Figure 5. Lipid binding, PA extraction, and PA transfer activities of Ups1 mutants.
(a) A schematic diagram of the fluorescent-based PA transfer assay between liposomes (see details in Methods). (b) PA transfer activities of the Ups1–Mdm35 complex for wild-type (WT) and the indicated mutant Ups1 were measured at 25 °C by the assay shown in a. At 0 s, the protein or buffer was added to the reaction mixture, and NBD fluorescence intensities were set to 0 at 0 s. Traces show means±s.d. of three independent experiments. (c) A schematic diagram of the liposome flotation assay (see details in Methods). (d) The Ups1–Mdm35 complex was incubated with liposomes containing PC alone (PC only) or PC/PA=80/20 (PC+PA) at pH 5.5 or pH 6.5 and binding was analysed by liposome flotation as in c. T, top; B, bottom. The amounts of Ups1 are shown below the gel (total Ups1 amounts were set to 100). (e) WT and the indicated mutant Ups1 proteins in a complex with Mdm35 were incubated with cardiolipin-containing liposomes (PC/CL=80/20) and binding was analysed as in c. (f) Mitochondria isolated from WT or crd1Δ cells were sonicated to form OM and IM vesicles. The vesicles were subjected to sucrose-gradient centrifugation, fractionated (left, top; right, bottom) and analysed by SDS–PAGE and immunoblotting using the indicated antibodies. (g) A schematic diagram of the assay for PA-extraction activities of the Ups1–Mdm35 complex from liposomes (see details in Methods). (h) The protein supernatant separated from the donor liposomes in g was subjected to gel-filtration using a Superdex 200 10/300 GL column. Absorbance at 280 and 460 nm indicating the Ups1–Mdm35 complex (blue) and NBD-PA (red), respectively, were monitored. Vo, void volume. Arrowheads indicate non-specific peaks.
Figure 6
Figure 6. Lipid binding and PA transfer activities of single-chain Ups1–Mdm35 derivatives.
(a) Magnified view around Asn24 and the C-terminal Glu169 of Ups1 (the C-terminal one residue is disordered in Ups1ΔC5) and Asn25 and the N-terminal Asn3 of Mdm35 (the N-terminal two residues are disordered in Mdm35ΔC5). Cα atoms of Glu169 of Ups1 and Asn3 of Mdm35 are shown as sphere. Distances between the C terminus of Ups1 and the N terminus of Mdm35 and between Cγ atoms of Asn24 in Ups1 and Asn25 in Mdm35 are indicated. Schematic diagrams of the Ups1ΔC5– Mdm35ΔC5 hetero-dimeric complex and single-chain Ups1–Mdm35 consisting of full-length Ups1 (1–175) fused to full-length Mdm35 (1–86) are shown at the bottom. (b) Ups1 with and without N24C mutation and Mdm35 with and without N25C mutation in separate chains or a single-chain polypeptide were analysed by SDS–PAGE with (Reducing) or without (Non-reducing) β-mercaptoethanol and CBB staining. (c) Ups1WT–Mdm35WT, Ups1N24C–Mdm35N25C, single-chain Ups1WT–Mdm35WT and single-chain Ups1N24C–Mdm35N25C were incubated with cardiolipin-containing liposomes (PC/CL=80/20) and binding was analysed at 25 °C and pH 6.5 by flotation assay as in Fig. 5d. T, top; B, bottom. The amounts of Ups1 are shown below the gel (total Ups1 amounts were set to 100). (d) PA transfer activities of Ups1WT–Mdm35WT, Ups1N24C–Mdm35N25C, single-chain Ups1WT–Mdm35WT and single-chain Ups1N24C–Mdm35N25C were analysed as in Fig. 5b. Traces show means±s.d. of three independent experiments.

Similar articles

Cited by

References

    1. Henry S. A., Kohlwein S. D. & Carman G. M. Metabolism and regulation of glycerolipids in the yeast Saccharomyces cerevisiae. Genetics 190, 317–349 (2012). - PMC - PubMed
    1. Tatsuta T., Scharwey M. & Langer T. Mitochondrial lipid trafficking. Trends. Cell Biol. 24, 44–52 (2014). - PubMed
    1. Flis V. V. & Daum G. Lipid transport between the endoplasmic reticulum and mitochondria. Cold Spring Harb. Perspect. Biol 5, a013235 (2013). - PMC - PubMed
    1. Tamura Y., Sesaki H. & Endo T. Phospholipid transport via mitochondria. Traffic 15, 933–945 (2014). - PMC - PubMed
    1. Vance J. E. Phospholipid synthesis and transport in Mammalian cells. Traffic 16, 1–18 (2015). - PubMed

Publication types

MeSH terms