. 2015 Aug 11;12(6):1056-68.
doi: 10.1016/j.celrep.2015.07.019. Epub 2015 Jul 30.

In Silico Reconstruction of the Viral Evolutionary Lineage Yields a Potent Gene Therapy Vector

Affiliations

In Silico Reconstruction of the Viral Evolutionary Lineage Yields a Potent Gene Therapy Vector

Eric Zinn et al. Cell Rep. .

Abstract

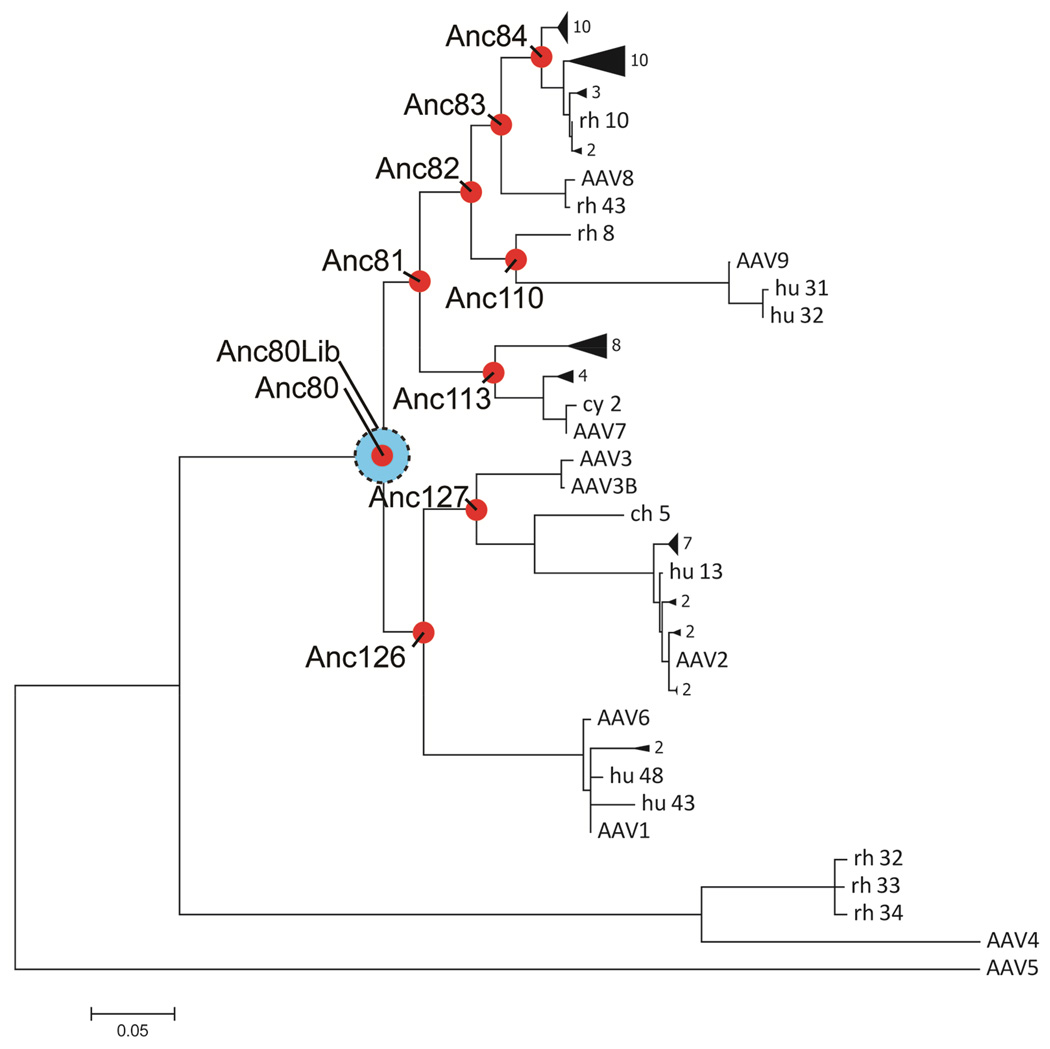
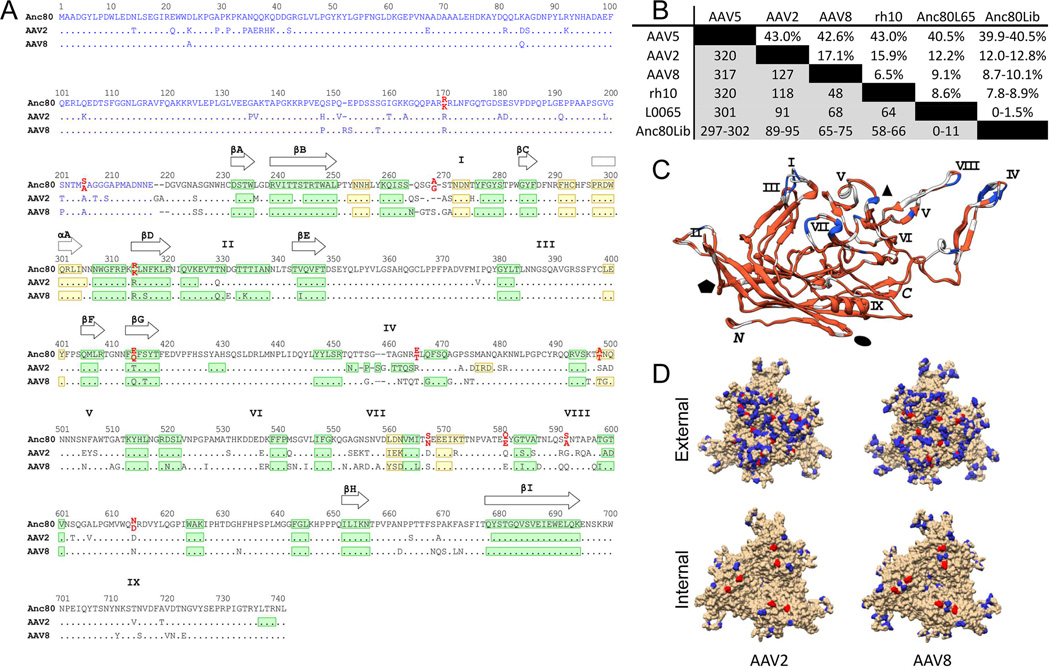
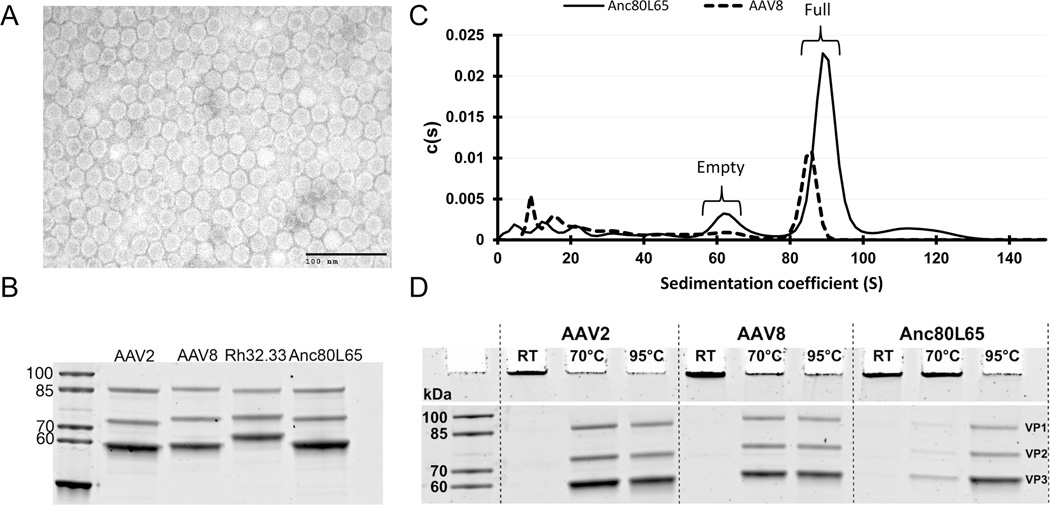
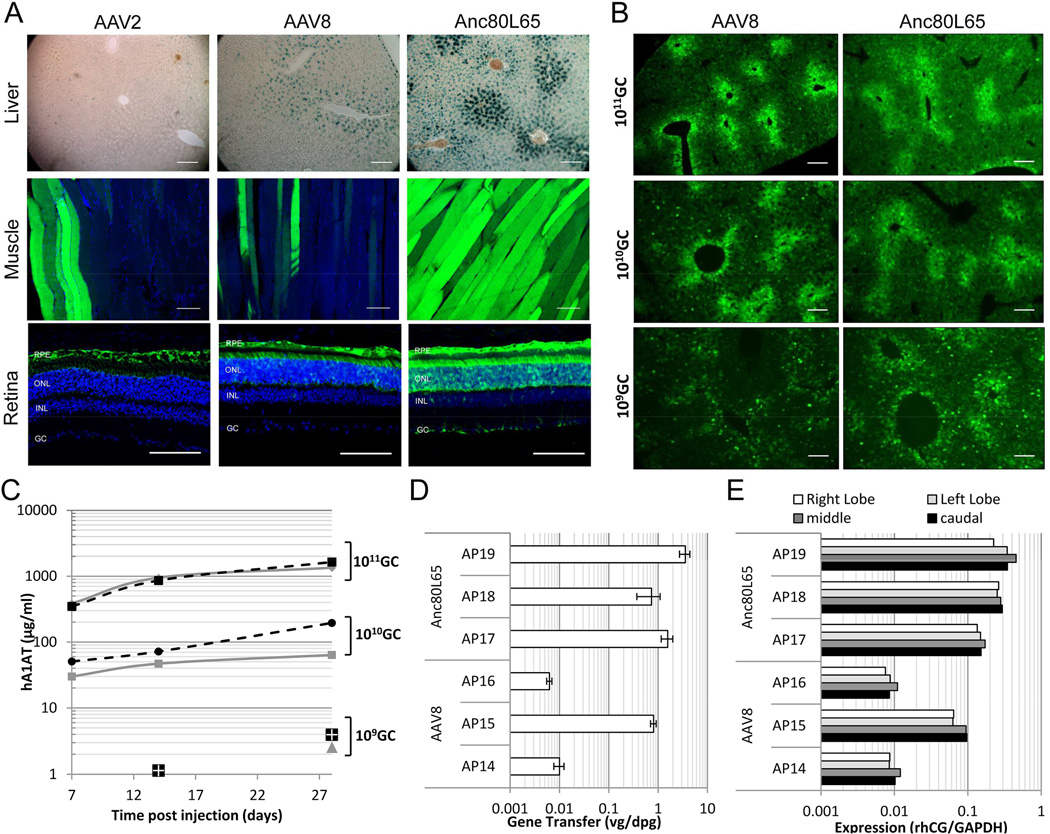
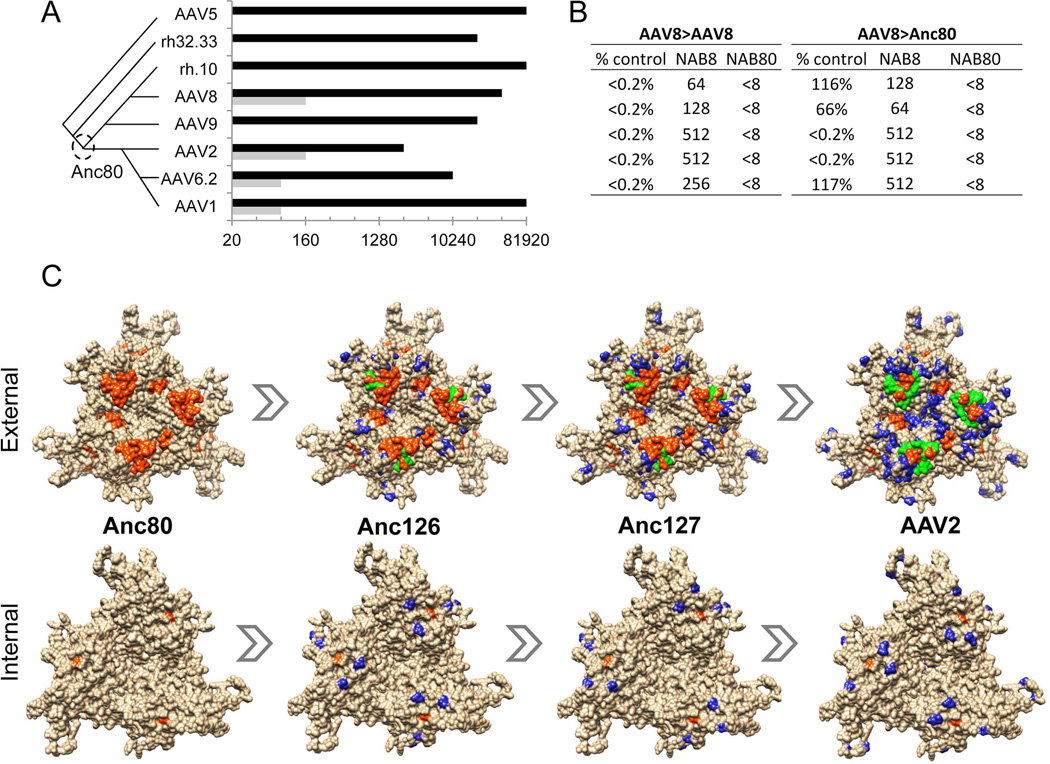
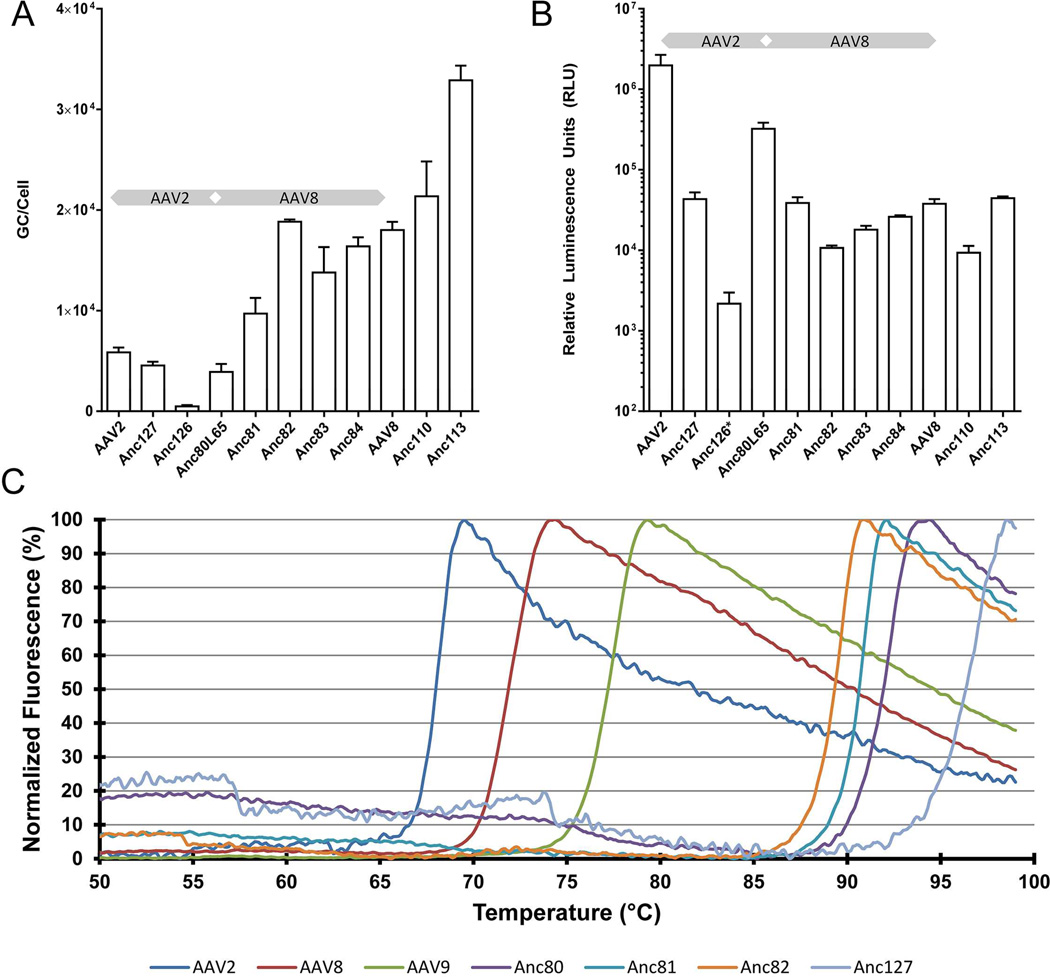
Adeno-associated virus (AAV) vectors have emerged as a gene-delivery platform with demonstrated safety and efficacy in a handful of clinical trials for monogenic disorders. However, limitations of the current generation vectors often prevent broader application of AAV gene therapy. Efforts to engineer AAV vectors have been hampered by a limited understanding of the structure-function relationship of the complex multimeric icosahedral architecture of the particle. To develop additional reagents pertinent to further our insight into AAVs, we inferred evolutionary intermediates of the viral capsid using ancestral sequence reconstruction. In-silico-derived sequences were synthesized de novo and characterized for biological properties relevant to clinical applications. This effort led to the generation of nine functional putative ancestral AAVs and the identification of Anc80, the predicted ancestor of the widely studied AAV serotypes 1, 2, 8, and 9, as a highly potent in vivo gene therapy vector for targeting liver, muscle, and retina.


Conflict of interest statement

CONFLICT OF INTEREST STATEMENT

LHV and EZ are inventors on a patent describing some of the methods and reagents described here. LHV is inventor on several patents on gene therapy technologies. LHV is co-founder, shareholder, member of the Scientific Advisory Board, and consultant of GenSight Biologics, an ophthalmology gene therapy company.

Figures

Figure 1
Figure 1. Phylogeny and ASR of AAV evolutionary lineage
Maximum-likelihood phylogeny relating 75 isolates of AAV). Red circles represent evolutionary intermediates reconstructed through ASR. Blue circle represents library of probabilistic sequence space around Anc80. Subclades are collapsed for clarity. Full phylogeny and sequence alignment is presented in Supplementary Figure S3 and S2.
Figure 2
Figure 2. Sequence and structural analysis of Anc80 vectors
A. Sequence alignment of Anc80, AAV2 and AAV8 VP3 proteins. A structural alignment derived from the crystal structures of AAV2 (PDB 1LP3) and AAV8 (PDB 2QA0) VP3 and the predicted structure of Anc80L65 VP3 was generated with UCSF Chimera (Pettersen et al., 2004) and is represented in black print. The blue region is a non-structural alignment of the VP1/VP2 domains of AAV2, AAV8 and An80 (Notredame et al., 2000). Ambiguous residues in Anc80Lib are in red print with the lower position corresponding to Anc80L65 residues. β-strands and α-helices are represented in green and yellow, respectively. The positions of the nine β-strands forming the AAV antiparallel β-barrel are depicted with plain arrows whereas the position of the conserved core α-helix is depicted with a dotted arrow. The approximate positions of variable regions (VR) I-IX are represented by the roman numerals above the sequence alignment. B. AAV Cap Sequence divergence matrix: Table represents above the diagonal the percent sequence divergence from selected AAV serotypes, as well as rh.10, most homologous VP1 sequence as by BLAST. Below the diagonal, the number of amino-acid differences per position is presented. C. Superimposition of AAV2 and AAV8 VP3 crystal structures with Anc80L65 VP3 predicted structure. The color code depicts the amino acid conservation between the 3 aligned sequences of panel A (red: highest conservation; blue: lowest conservation). Variables regions I-IX and C/M-termini are indicated in black. The approximate positions of the two, three and five-fold axis are represented by the black ellipse, triangle and pentagon, respectively. D. Structural mapping of amino-acid changes as compared to AAV2 (left) and AAV8 (right) on VP1 trimer visualizing the external (top) and internal (bottom) of the virion. Colored residues are divergent in Anc80. Red colored residues are ambiguous via ASR and therefore dimorphic in Anc80Lib.
Figure 3
Figure 3. Biophysical and biochemical characterization of Anc80L65
A. Negative staining Transmission Electron Microscopy (TEM) of Anc80L65 particles. B. Anc80L65 viral protein composition by SDS PAGE: Purified AAV preparations were analyzed by SDS-PAGE demonstrating similar incorporation levels of monomers VP1, 2, and 3. C. Anc80L65 sedimentation and empty:full particle profile: Sedimentation coefficient distributions were derived from the refractive index optical measurement systems during analytical ultracentrifugation of AAV8 and Anc80L65 iodixanol purified preparations. D. Anc80L65 thermostability: SDS page thermostability assessment of AAV particle illustrates dissociation into monomers for AAV2 and 8 at temperatures below 70°C for AAV2 and 8 but requirin g 95°C melting temperatures for Anc80L65.
Figure 4
Figure 4. Anc80L65 in vivo transduction biology
A, top panel: Mouse liver transduction and lacZ transgene expression comparison of AAV2, AAV8 and Anc80L65.TBG.nLacZ in liver 28 days after intraperitoneal delivery at a dose of 3.9 × 10¹⁰ GC (C57Bl/6, n=3). A, middle panel: AAV2, AAV8 and Anc80L65 muscle tropism in mouse 28 days following an intramuscular delivery at a dose of 1010 GC to the rear-right thigh (gastrocnemius) (n=5). See also Figure S1. A, lower panel: Comparison of eGFP transgene expression between AAV2, AAV8, and Anc80L65 in the murine retina after subretinal delivery at a dose of 2×10⁹ GC. AAV2 shows high affinity for RPE cells while both RPE and photoreceptors are targeted using AAV8 and Anc80L65 vectors with Anc80L65 showing higher transduction efficiency compared to the AAV2 and 8 (C57Bl/6, n=4 eyes). B. Qualitative dose response hepatic eGFP-expression analysis following dosing of 1011 (top panel), 1010 (middle panel), and 109 (bottom panel) GC comparing AAV-8 and Anc80L65 by retro-orbital intravenous injection in mouse. Both AAV8 and Anc80L65 lead to comparable eGFP expression at equal dose throughout the dose ranging. (C57Bl/6, n=3) C. Quantitative AAV dose response analysis measuring mouse serum levels of recombinant human alpha 1-antitrypsin (hA1AT) transgene expression from AAV-8 (black symbols: square-1011 GC, circle-1010 GC, and four-square-109 GC) and Anc80L65 (grey symbols: diamond-1011 GC, square-1010 GC, and triangle-109 GC). (C57Bl/6, n=5). See also Table S1, S3, S4 and S5. D. Rhesus macaque liver gene transfer of AAV-8 and Anc80L65 expressing Rhesus chorionic-gonadotropin (rhCG) following saphenous vein injection of a dose of 1 × 10¹² GC/kg. Genomic DNA was harvested from macaque liver-lobes and viral genome (vg) per diploid genome (dpg) was measured by qPCR assay. One AAV8 and all three Anc80L65 animals successfully received ~1–3 vg per diploid cell of the caudal liver lobe, while 2 AAV8 animals likely had low level NAB resulting in vector neutralization and limited liver gene transfer. See also Table S2, S6 and S7. E. Transgene mRNA expression of AAV8 and Anc80L65 in NHP caudal, right, left and middle liver-lobes by TaqMan probe-specific, quantitative reverse-transcriptase PCR (qRT-PCR). Protein levels are not available due to lacking antibody and rhCG standards. Quantitation of rhCG transcript is normalized with endogenous GAPDH mRNA levels.
Figure 5
Figure 5. Immunological characterization of Anc80L65
A. Rabbit anti-AAV serum cross-reactivity: Rabbit antiserum raised against AAV serotypes (Y-axis) was tested for NAB to Anc80L65 (grey bars) versus the homologous AAV serotype (black bars) in order to assess relative sero-cross-reactivity. Values (X-axis) represent highest dilution at which >50% neutralization is achieved. Phylogenetic relationship between immunizing serotypes is depicted schematically on the left. B. Mouse in vivo gene transfer cross-neutralization: C57Bl/6 mice received an IV injection of AAV8 or Anc80L65.CASI.EGFP.2A.A1AT 25 days following an IM injection with either saline or AAV8.TBG.nLacZ. 14 days following the second injections serum was titrated by ELISA for hA1AT expression. Table presents the relative hA1AT levels of the pre-immunized mice versus the non-immunized for each vector (% control), and the NAB titer dilutions for AAV8 (NAB8) and Anc80L65 (NAB80) 24 h prior to the second injection in the immunized group (n=5). C. A non-structural multiple sequence alignment between Anc80, Anc126, Anc127 and AAV2 VP3 sequences was generated using the Tcoffee alignment package. AAV2 trimer structure was generated using UCSF Chimera. The blue residues represent residues different from Anc80. The orange residues are defined T and B-cell epitopes on AAV2 (Gurda et al., 2013; Mingozzi et al., 2007). Green residues show the overlap between orange and blue residues to highlight mapped epitopes altered in the putative evolutionary intermediates. Human T-cell epitopes with MHC haplotype: VPQYGYLTL (B*0702), SADNNNSEY (A*0101), YHLNGRDSL (B*1501), and TTSTRTWAL (B*0801). (Mingozzi et al., 2007) Mouse B-cell epitopes of defined AAV2 antibody SADNNNS plus RGNRQ for C37B Fab (Gurda et al., 2013). In bold are the residues within each epitope that are distinct between Anc80L65 and AAV80.
Figure 6
Figure 6. AAV lineage reconstruction modulates production, infectivity, and thermostability
A. Production of nine ancestral and two extant viral vectors containing a luciferase reporter gene driven by a CMV promoter determined by qPCR. Error bars represent standard deviation of three biological replicates. B. Ancestral and extant viral vectors were used to transduce HEK293 cells at a particle to cell ratio of 1.9 × 10³. Error bars represent standard deviation of three distinct lots of vector. *Anc126, was added at ratios between 2.1 × 10² and 3.5 × 10² GC/cell due to low vector yield. Grey diverging arrow in A and B panels schematically illustrate AAV2 and AAV8 lineage phenotypic evolution. C. Sypro orange thermostability assay indicating denaturation temperatures of selected ncestral and extant AAV vectors. See also Figure S2.

References

    1. Adachi K, Enoki T, Kawano Y, Veraz M, Nakai H. Drawing a high-resolution functional map of adeno-associated virus capsid by massively parallel sequencing. Nature communications. 2014;5:3075. - PMC - PubMed
    1. Allocca M, Mussolino C, Garcia-Hoyos M, Sanges D, Iodice C, Petrillo M, Vandenberghe LH, Wilson JM, Marigo V, Surace EM, et al. Novel adeno-associated virus serotypes efficiently transduce murine photoreceptors. J Virol. 2007;81:11372–11380. - PMC - PubMed
    1. Anisimova M, Gascuel O. Approximate likelihood-ratio test for branches: A fast, accurate, and powerful alternative. Systematic biology. 2006;55:539–552. - PubMed
    1. Asuri P, Bartel MA, Vazin T, Jang JH, Wong TB, Schaffer DV. Directed evolution of adeno-associated virus for enhanced gene delivery and gene targeting in human pluripotent stem cells. Mol Ther. 2012;20:329–338. - PMC - PubMed
    1. Auricchio A, Kobinger G, Anand V, Hildinger M, O'Connor E, Maguire AM, Wilson JM, Bennett J. Exchange of surface proteins impacts on viral vector cellular specificity and transduction characteristics: the retina as a model. Hum Mol Genet. 2001;10:3075–3081. - PubMed

Publication types