

doi: 10.1038/ncomms8923.
Large-volume en-bloc staining for electron microscopy-based connectomics
Affiliations
- PMID: 26235643
- PMCID: PMC4532871
- DOI: 10.1038/ncomms8923
Item in Clipboard
Large-volume en-bloc staining for electron microscopy-based connectomics
Nat Commun.
.
Abstract
Large-scale connectomics requires dense staining of neuronal tissue blocks for electron microscopy (EM). Here we report a large-volume dense en-bloc EM staining protocol that overcomes the staining gradients, which so far substantially limited the reconstructable volumes in three-dimensional (3D) EM. Our protocol provides densely reconstructable tissue blocks from mouse neocortex sized at least 1 mm in diameter. By relaxing the constraints on precise topographic sample targeting, it makes the correlated functional and structural analysis of neuronal circuits realistic.
Figures
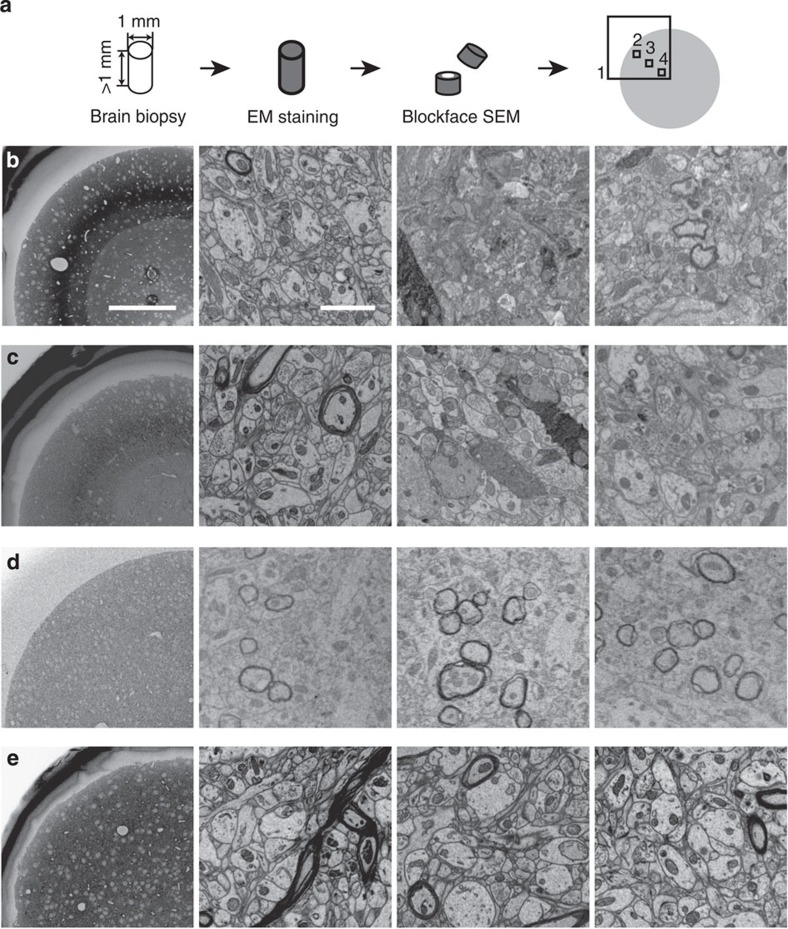
(a) Screening strategy for brain biopsy samples >1 mm in smallest dimension. Samples were screened after cutting the sample in about half, such that the core of the sample was exposed and could be tested for staining quality. Samples were screened in overview (1), periphery (2), intermediate (3) and core regions (4). (b–e) Scanning electron microscopy images from mouse cortex biopsy samples screened as indicated in a (regions 1–4, left to right columns) and stained with en-bloc protocols from ref. (b, rOTO), ref. (c, rOTO) and ref. (d, PATCO) and this protocol (e) Note the good staining quality in the periphery (first column) in b,c but the strong over-staining in the intermediate region yielding stain uptake of a subset of neurons (b,c) and a substantial staining gradient, which is relieved in this protocol. (e) PATCO provides good stain penetration but stains myelinated neurites only, (d) Scale bars, 200 μm in b–e left column and 2 μm in other columns.
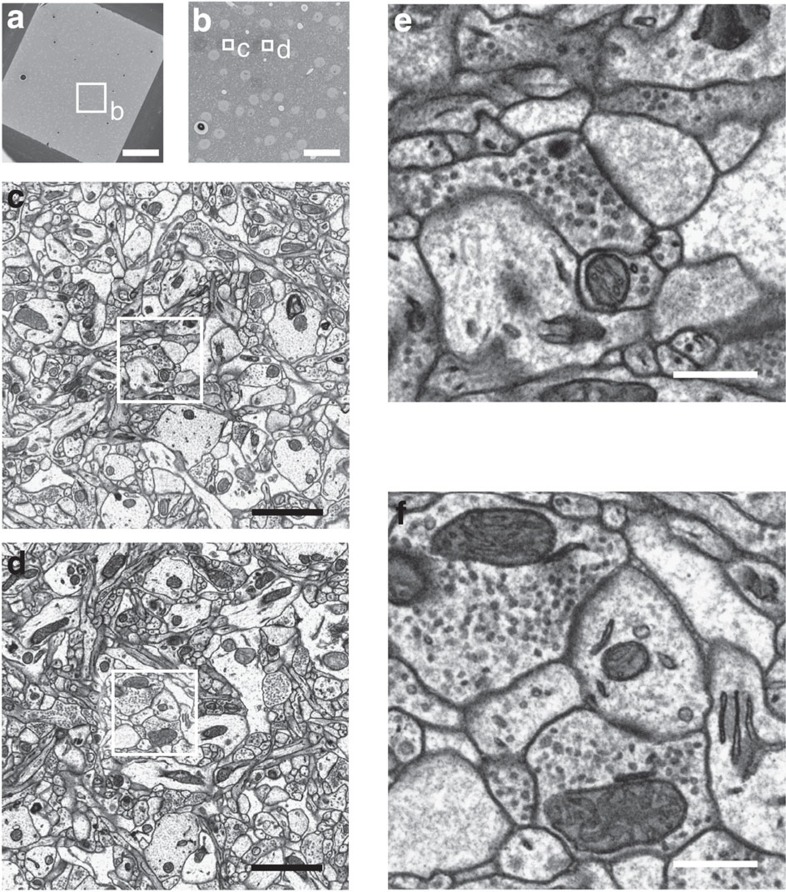
(a–d) Position of screening region within sample. (e,f) Two example high-resolution scanning electron microscopy images (imaged at voxel size of 1.35 × 1.35 nm) showing continuous strong membrane contrast in plasma and vesicle membranes, indications of postsynaptic density, and intracellular organelles. Images in e,f were imaged first on a freshly cut block face, and images in a–d were taken afterwards to avoid effects of multiple exposure in the high-resolution images. See Supplementary Fig. 1 for further high-resolution screening results. Scale bars, 200 μm in a, 40 μm in b, 2 μm in c,d and 500 nm in e,f.
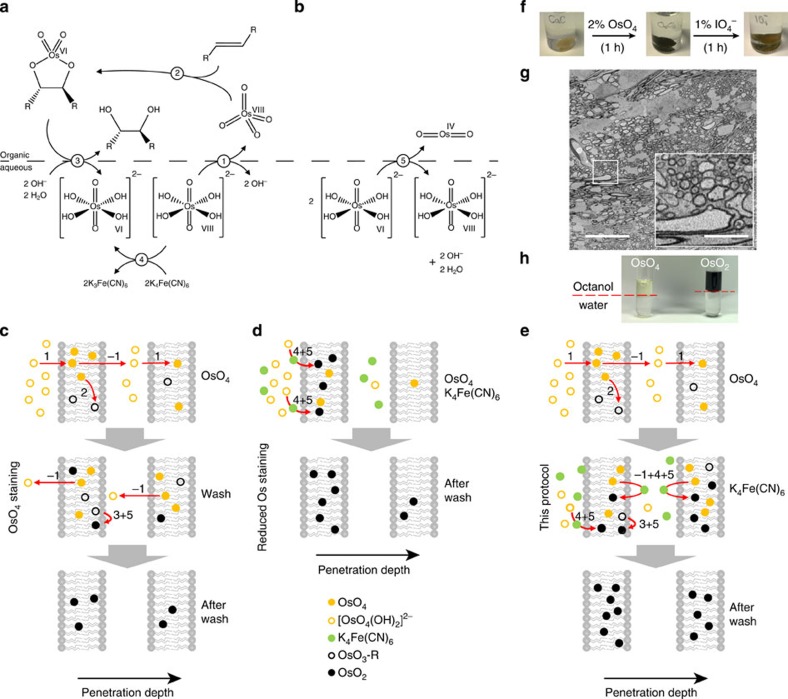
(a) Sharpless-dihydroxilation (modified from ref. 9) and possible effect of reducing agents such as ferrocyanide. Note that reaction steps 1–5 are referred to in Results, and inverse reaction steps are referred to as ‘−1' to ‘−5'. (b) OsIV dismutation suggested to be critical for deposition of OsO2 in the membrane (after ref. 12) (c–e) Possible reaction and diffusion steps involved in stain penetration and contrast enhancement in the conventional OTO protocol, (c) rOTO protocol (d, see also Fig. 1b,c) and this protocol (e, compare with Fig. 1e). Two membranes are visualized to indicate penetration of successive plasma and intracellular membrane bilayers. Only key reaction steps are indicated. (f) Simple test experiment that lead us to consider OsO2 as a main source of membrane contrast. After Os impregnation, the tissue obtains a dark black colour under bright-field illumination (middle). This is reversed by periodic acid application (right), suggesting that OsO2 is oxidized to colourless Os species. (g) EM contrast after periodic acid application was decreased, staining only myelinated fibres (inset, note region between myelinated fibres has very low contrast making the detection of single neurites impossible), suggesting that OsO2 had been essential for Os membrane contrast. (h) Simple octanol/water partition test: equal fractions of OsO4 in aqueous solution and octanol partition into organic (top) and aqueous (bottom) phase. After several hours (right) the lipophilic phase is deep black, supporting the notion that OsO2 (which is the product of OsO4 reduction by octanol) can be dissolved in lipophilic membranes and may contribute crucially to membrane contrast. Scale bars, 20 μm and 5 μm in g and insert, respectively.
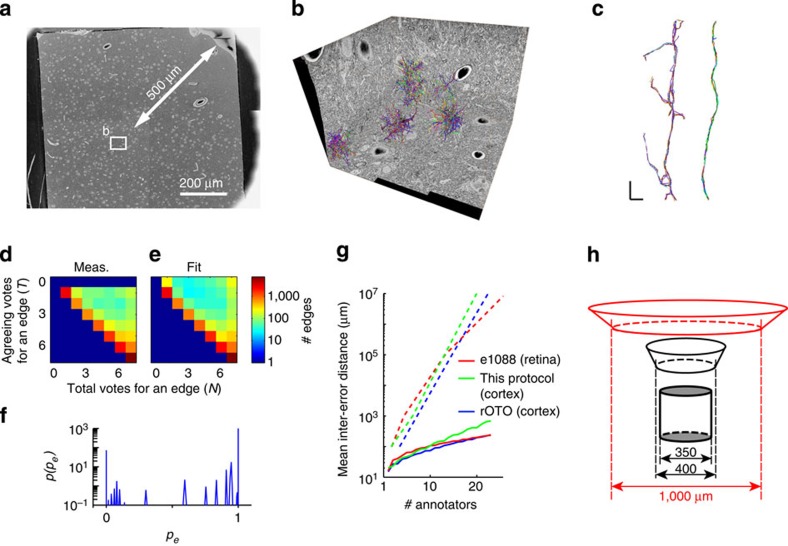
(a,b) Dense neurite reconstruction in a SBEM data set sized 65 × 51 × 41 μm3 from the core (>500 μm from the closest sample surface) of a sample from mouse somatosensory cortex. (a) Overview of sample location (stitched from four overview images); (b) 3D display of SBEM-data set boundaries and all locally dense neurite tracings used for tracing test. (c) Two example neurites reconstructed by seven independent annotators. Note complete agreement (right) and local disagreement when tracing spines (left). (d,e) Measured (d) and fitted (e) vote histogram of tracer agreement reporting the total number of tracers (N) and the agreeing number of tracers (T) for each skeleton-edge (redundancy-corrected, see Methods). (f) fitted distribution of skeleton-edge difficulty (or edge probability) p(pe) from the tracings summarized in d, yielding the fitted vote histogram (e, see RESCOP and Methods for details). (g) Prediction of tracing accuracy (for full neurite tracings, continuous lines and for focused re-annotation of the disagreeing locations, dashed lines, see ref. 21) from test tracings for this data set compared with published retina tracings (‘e1088' from ref. 21) and a comparison cortex data set stained with the protocol as shown in Fig. 1b (Boergens et al., unpublished data set). (h) Illustration of sampling challenge when targeting modules in cortex (here: ‘barrels' in mouse S1 layer 4, grey cylinder) using a protocol that can only stain about 400-μm-wide samples (black) compared with the procedural relief when obtaining about 1-mm-wide samples (red). Scale bars, 200 μm (a), 1 μm (c).
References
-
- Briggman K. L. & Bock D. D. Volume electron microscopy for neuronal circuit reconstruction. Curr. Opin. Neurobiol. 22, 154–161 (2012). - PubMed
-
- Mikula S. & Denk W. High-resolution whole-brain staining for electron microscopic circuit reconstruction. Nat. Methods 12, 541–546 (2015). - PubMed
-
- Helmstaedter M. Cellular-resolution connectomics: challenges of dense neural circuit reconstruction. Nat. Methods 10, 501–507 (2013). - PubMed
MeSH terms
LinkOut - more resources
Full Text Sources
Other Literature Sources
Molecular Biology Databases
Research Materials
Miscellaneous
