

doi: 10.1542/neo.16-2-e94.
Epidemiology and Clinical Research Design, Part 2: Principles
Affiliations
- PMID: 26236171
- PMCID: PMC4517623
- DOI: 10.1542/neo.16-2-e94
Item in Clipboard
Epidemiology and Clinical Research Design, Part 2: Principles
Neoreviews.
2015.
Abstract
This is the third article covering core knowledge in scholarly activities for neonatal physicians. In this article, we discuss various principles of epidemiology and clinical research design. A basic knowledge of these principles is necessary for conducting clinical research and for proper interpretation of studies. This article reviews bias and confounding, causation, incidence and prevalence, decision analysis, cost-effectiveness, sensitivity analysis, and measurement.
Figures
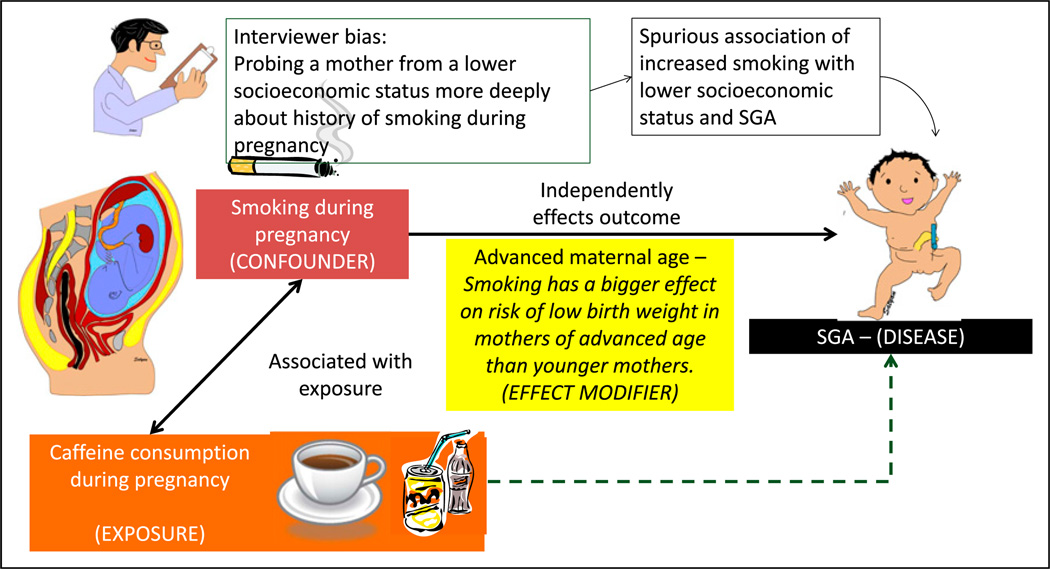
Bias, confounders, and effect modifiers. The association with caffeine consumption during pregnancy and fetal growth restriction is being evaluated. If we assume that smoking is associated with increased caffeine consumption during pregnancy and that smoking is directly associated with fetal growth restriction and small for gestational age (SGA) status, the observed association between caffeine consumption and SGA status may be positively influenced by maternal smoking. In this example, caffeine consumption is the exposure and SGA status is the outcome; smoking is the confounder. The association between maternal smoking during pregnancy and fetal growth restriction is evaluated. The interviewer is biased that mothers of lower socioeconomic status smoke more frequently during pregnancy. The researcher may probe lower socioeconomic mothers more deeply and elicit a history of smoking, leading to a spurious association of economic status, smoking, and SGA. This bias is a systematic error and is not overcome by increasing sample size. It can be prevented by blinding (masking) or educating the interviewer. Smoking has a bigger effect on risk of SGA offspring in mothers of advanced age compared with younger mothers. Advanced maternal age is an effect modifier.
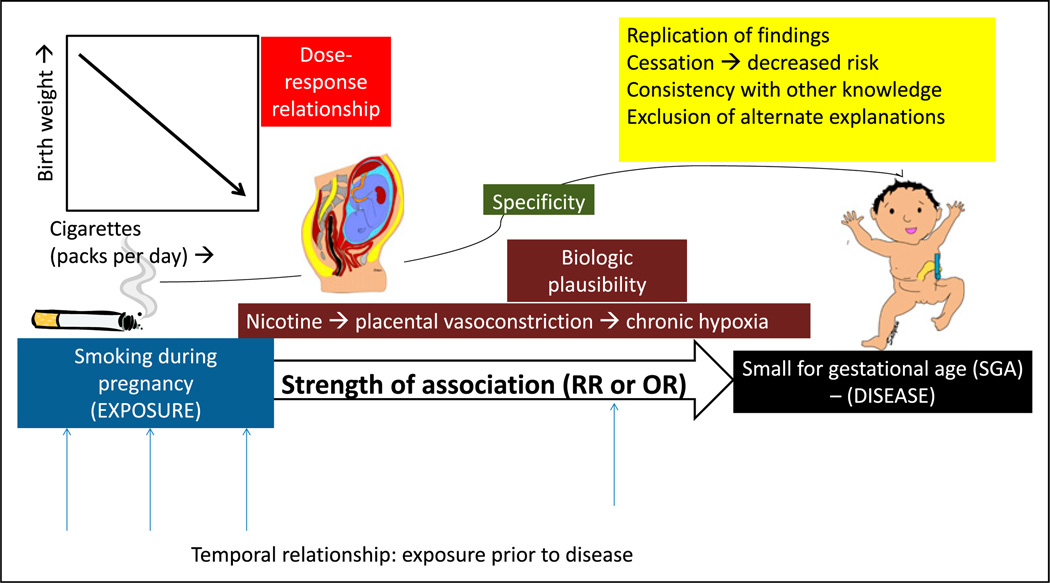
Causal association. The association between maternal smoking during pregnancy and small for gestational age (SGA) offspring is more likely to be causal if there is a temporal relationship between exposure and outcome or disease; high strength of association as measured by relative risk (RR) or odds ratio (OR); specific 1:1 association between smoking and SGA; dose-response relationship (decreasing birth weight with increased cigarette smoking per day; biologic plausibility (nicotine can lead to placental vasoconstriction and chronic fetal hypoxia leading to growth restriction); replication of findings in different populations and different studies; cessation of exposure (the risk of disease decreases with decreasing or removing the exposure); consistency with other knowledge (association found in different subgroups, for example, men and women); and finally exclusion of alternate explanations.
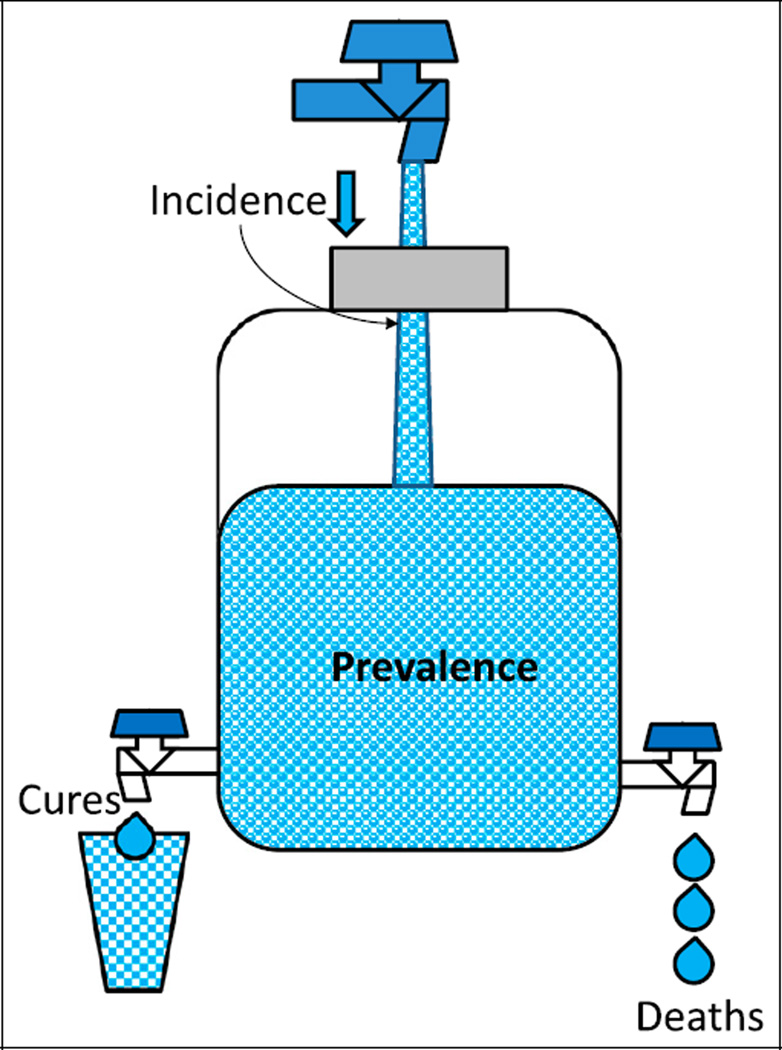
The relationship between incidence and prevalence. The water content of a jug is similar to the prevalence of a disease (affected individuals in a population at a given time). Prevalence can be increased by increasing incidence (new cases during a period or increasing flow from the inlet) or by decreasing deaths and cures (outflow of water). Improving health care can decrease prevalence by decreasing incidence and increasing cures. Improved health care may also lead to better control of disease (such as diabetes or cystic fibrosis), reduce mortality, and increase prevalence.
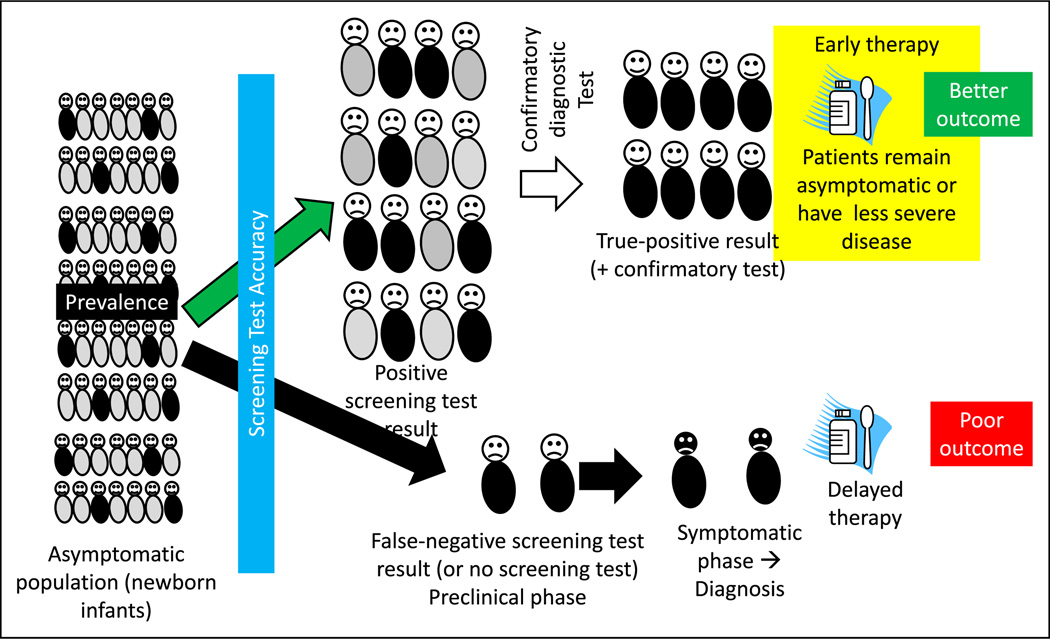
The rationale for and factors that influence a screening test. A screening test, such as newborn screening for hypothyroidism, is administered to asymptomatic infants after birth before discharge from the hospital. The screening test result is positive in some infants (true-positive results shown as neonates with black trunks and false-positive results as neonates with gray trunks). The screening test may also miss a few infants with hypothyroidism (false-negative results). A confirmatory diagnostic test is performed in infants with a positive screen result. Once the diagnosis is confirmed, early intervention before the onset of symptoms typically leads to better outcome. False-negative screening test results will cause some patients to be missed. These patients later become symptomatic, leading to a specific diagnosis and delayed therapy. Factors that influence a screening test include prevalence of the disease, accuracy of the screening test, risk-benefit ratio (Figure 6), and duration of the presymptomatic phase.
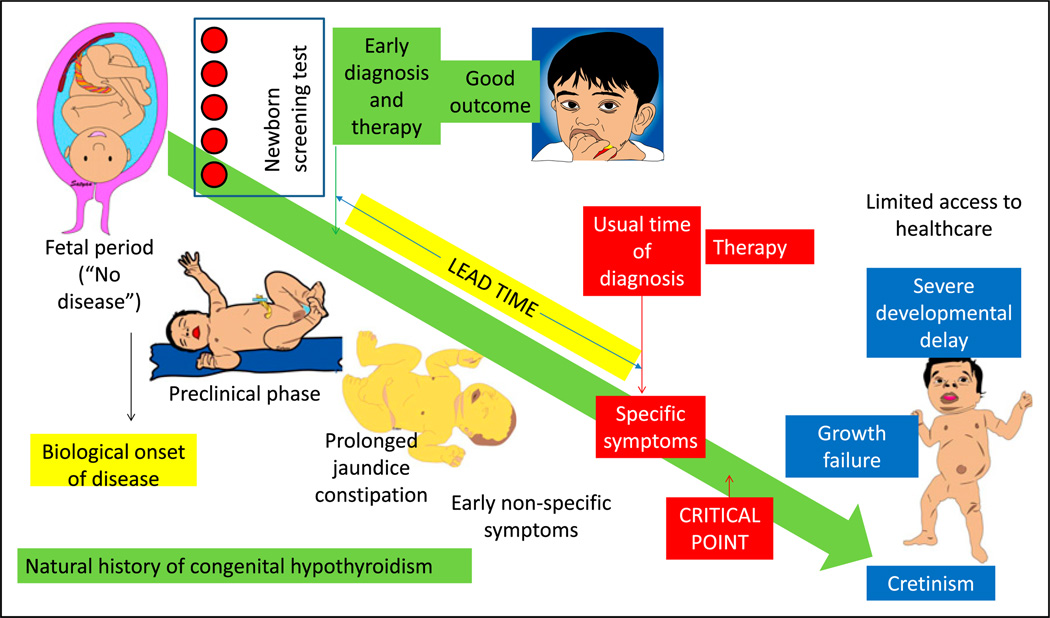
Natural history of the disease and influence of screening and early treatment on outcome. Before the availability of specific therapy (and in health care shortage areas), congenital hypothyroidism if left untreated leads to growth failure and severe developmental delay (cretinism). Newborn screen using blood spots can diagnose the disease in the presymptomatic or preclinical phase, leading to early diagnosis and therapy in the neonatal period. In the absence of a screening test, patients with hypothyroidism can present with nonspecific symptoms, such as prolonged hyperbilirubinemia and constipation. Eventually, with the onset of specific symptoms, diagnosis is suspected, confirmatory tests are performed, and therapy is initiated. The difference between the time of early diagnosis and therapy with screening and the usual time of diagnosis and treatment is called the lead time. Diagnosis and therapy before a critical point in the natural history of the disease are more effective compared with delayed therapy.
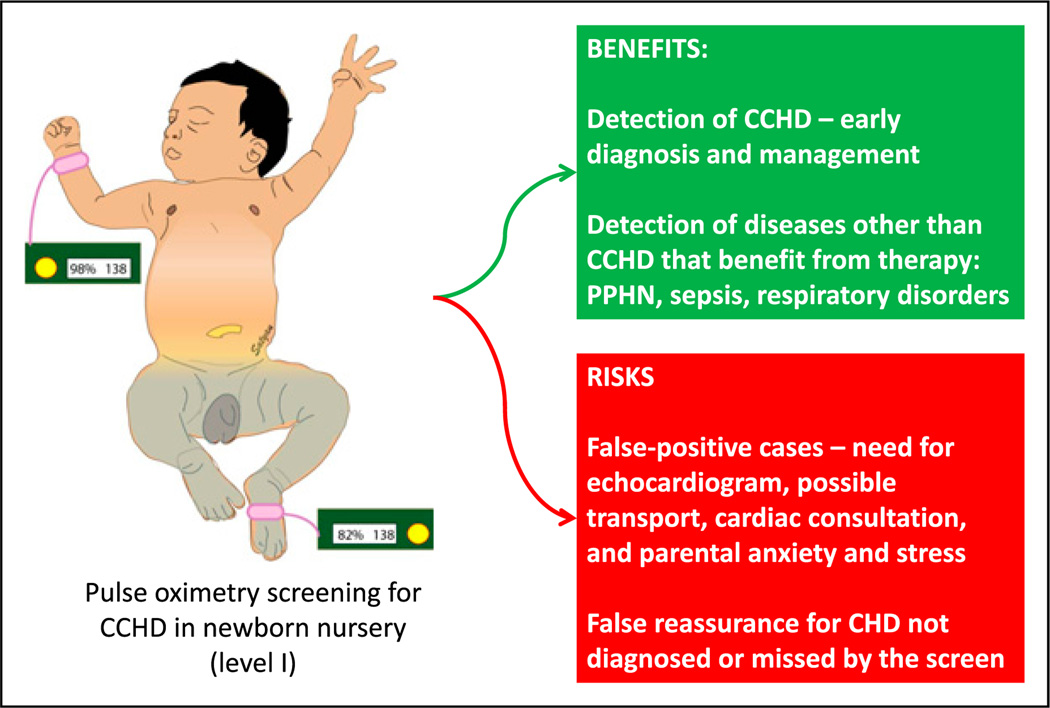
Benefits and risks of pulse oximetry screening for critical congenital heart disease (CCHD) for asymptomatic neonates in a newborn nursery. CHD = congential heart disease; PPHN = persistent pulmonary hypertension of the newborn.
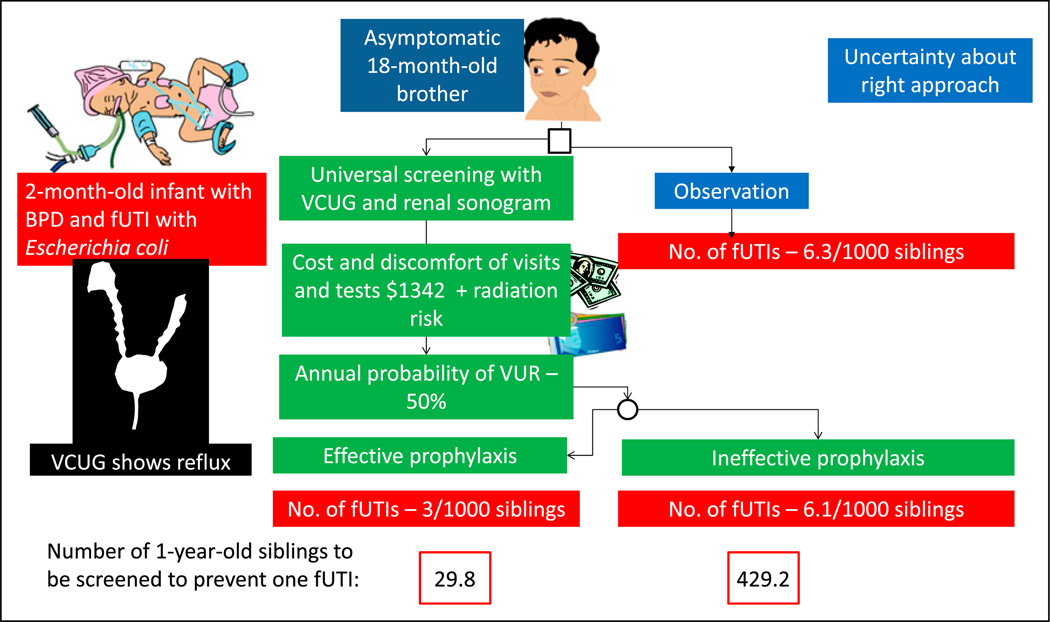
Factors to be considered when uncertainty exists regarding approach to a problem using decision analysis. A 2-month-old infant born prematurely with febrile urinary tract infection (fUTI) is diagnosed as having vesicoureteral reflux (VUR). A decision is needed on appropriate approach to his 18-month-old asymptomatic brother based on available evidence. (19) BPD = bronchopulmonary dysplasia; VCUG = voiding cystourethrography.
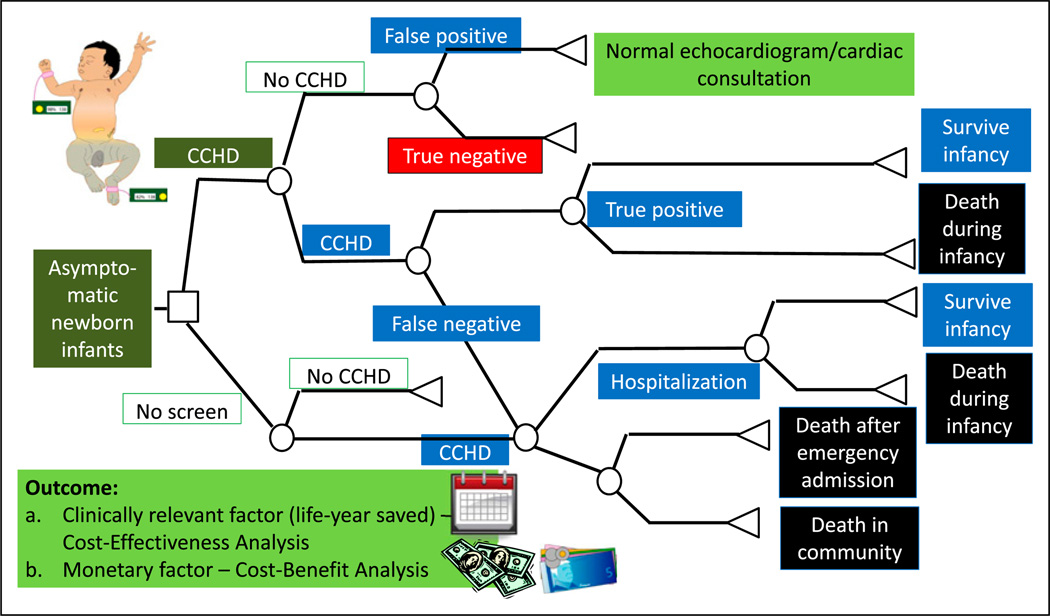
A simplified cohort state transition model for critical congenital heart disease (CCHD) screening in asymptomatic newborn infants. (18) These models are typically created using TreeAge Pro (Williamstown, MA) or Microsoft Excel (Redmond, WA) software. By convention, the following nodes are built into a decision tree. A square depicts a decision node, a circle depicts an event node, and a triangle is a terminal node (often indicating a disability, utility, or an outcome). The output of a cost analysis is a clinically relevant factor (such as life-year saved) in a cost-effectiveness analysis. In a cost-benefit analysis, the output is usually a monetary factor.
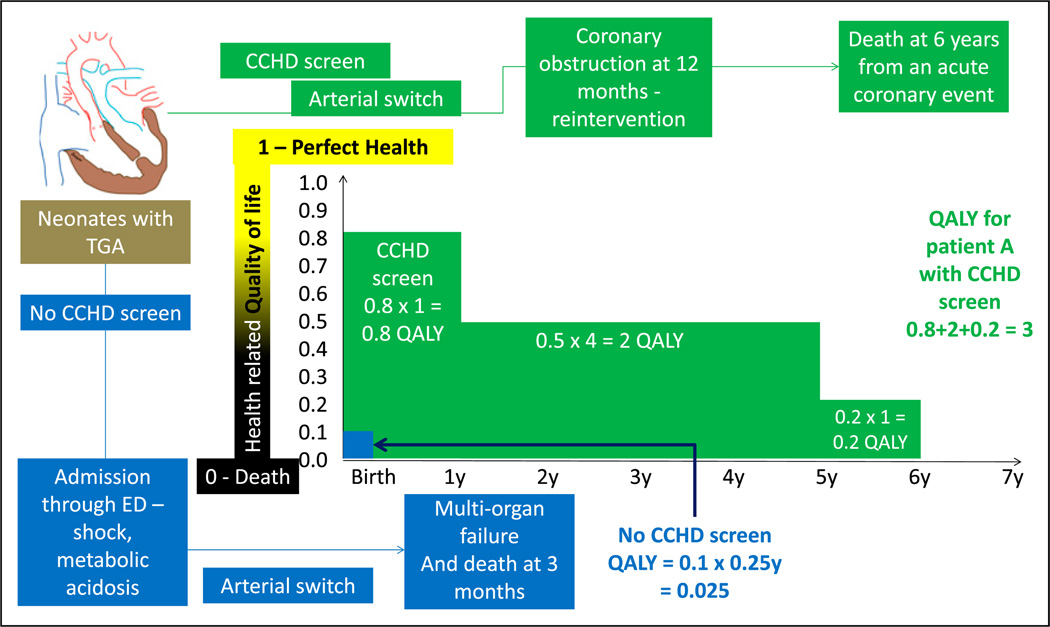
Quality-adjusted life-years (QALYs). Health-related quality of life is rated from 0 (death) to 1 (perfect health). This number is multiplied by life-years to get QALYs. A comparison is made regarding the outcome of 2 neonates with transposition of great arteries (TGA). Before the performance of CCHD screen, an infant with TGA was discharged home at 36 hours and was admitted in a critical state through the emergency department (ED). He subsequently underwent cardiac surgery under suboptimal state of health and succumbed to multiorgan failure at age 3 months (0.25 years). His QALY is calculated as follows: quality of life (0.1 - poor quality of life) X 0.25 years = 0.025 (shown in blue). In a second infant with TGA, CCHD screen resulted in early diagnosis before onset of circulatory compromise. This patient (shown in green) had a good quality of life (0.8) during the first year. After an acute coronary event, his quality of life decreased to 0.5 for 4 years and 0.2 for 1 year. The patient died at age 6 years of an acute coronary event. His QALY shown in green font is 3.
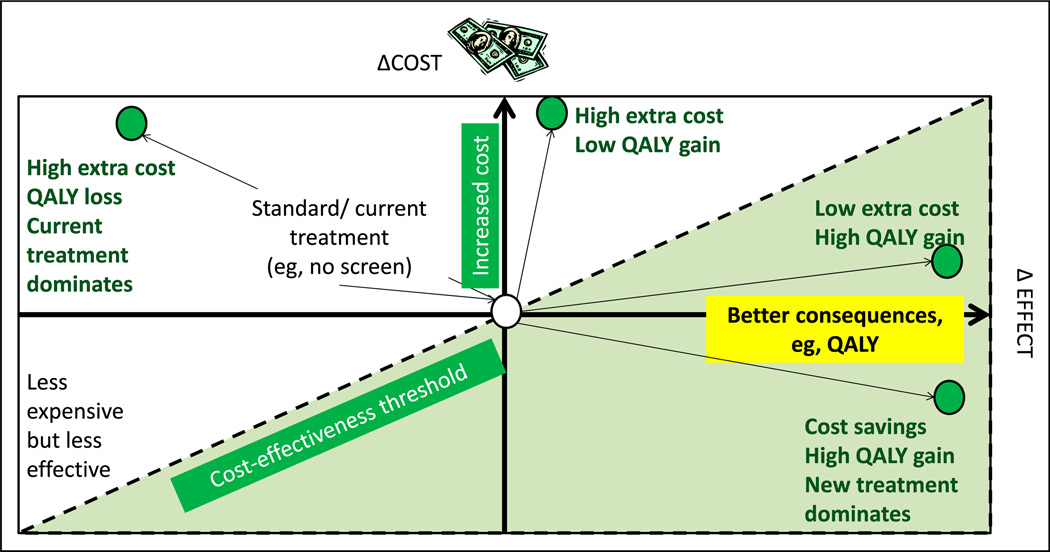
Cost-effectiveness model or plane. Increasing cost is depicted on the y-axis and better effect or consequences (such as quality-adjusted life-years [QALY]) on the x-axis. The central point is the cost and effect of current (“standard”) management. The left upper quadrant represents more expensive and less effective alternative to the current intervention. The left lower quadrant represents less expensive but less effective intervention. The right upper quadrant shows 2 new interventions (green circles) with extra cost but better QALY gain. The right lower quadrant intervention provides high QALY with cost savings. The dotted line is referred to as the cost-effectiveness threshold.
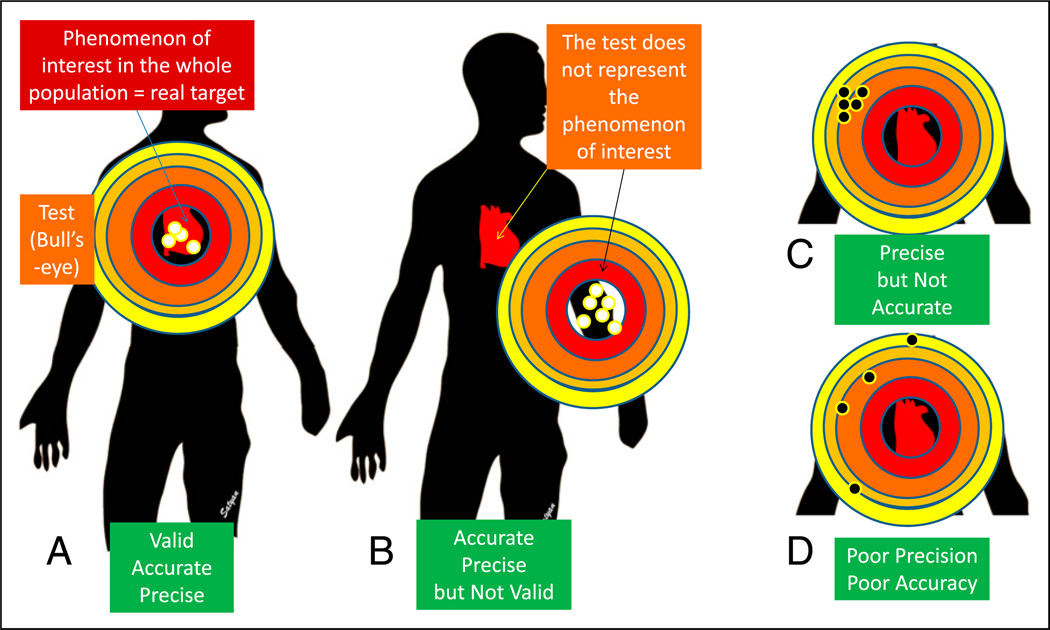
Validity, precision, and accuracy. Validity is an assessment of how well a measurement represents the phenomenon of interest. A. The bull’s-eye (test or study) is located over the target practice manikin’s heart (phenomenon of interest). The pattern of tightness in the bullet holes indicates precision, and the location close to the center of the bull’s eye indicates accuracy. B. The bull’s-eye (test/study) is located away from the manikin’s heart and is not representing the phenomenon of interest, suggesting poor validity. The bullet hole pattern suggests high accuracy and precision. C. The pattern of tightness indicates precision, but these holes are located away from the center, suggesting poor accuracy. D. The test shows neither precision (wide scatter) nor accuracy (the holes are biased to the left). (21).
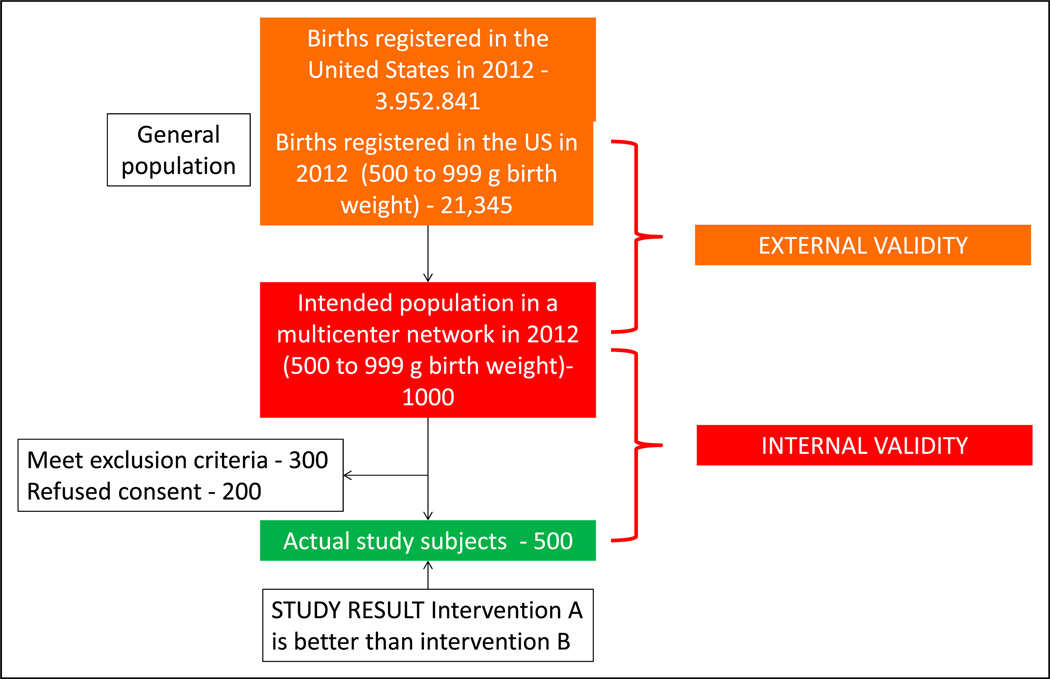
External and internal validity: External validity refers to the generalizability of the study findings to the population (eg, all preterm extremely low birth weight - VLBW neonates in the US). Internal validity depends on the design and conduct of the study; it represents the degree to which the results of the study accurately reflect the truth in the study. A study with high internal validity has a lower likelihood of bias.
Similar articles
-
The future of Cochrane Neonatal.Early Hum Dev. 2020 Nov;150:105191. doi: 10.1016/j.earlhumdev.2020.105191. Epub 2020 Sep 12. Early Hum Dev. 2020. PMID: 33036834
-
Causation, bias and confounding: a hitchhiker's guide to the epidemiological galaxy Part 2. Principles of causality in epidemiological research: confounding, effect modification and strength of association.J Fam Plann Reprod Health Care. 2008 Jul;34(3):185-90. doi: 10.1783/147118908784734873. J Fam Plann Reprod Health Care. 2008. PMID: 18577320 Review. No abstract available.
-
Good research practices for comparative effectiveness research: approaches to mitigate bias and confounding in the design of nonrandomized studies of treatment effects using secondary data sources: the International Society for Pharmacoeconomics and Outcomes Research Good Research Practices for Retrospective Database Analysis Task Force Report--Part II.Value Health. 2009 Nov-Dec;12(8):1053-61. doi: 10.1111/j.1524-4733.2009.00601.x. Epub 2009 Sep 10. Value Health. 2009. PMID: 19744292
-
Causation, bias and confounding: a hitchhiker's guide to the epidemiological galaxy. Part 1. Principles of causality in epidemiological research: time order, specification of the study base and specificity.J Fam Plann Reprod Health Care. 2008 Apr;34(2):83-7. J Fam Plann Reprod Health Care. 2008. PMID: 18413019 Review. No abstract available.
-
[Clinical epidemiology--the basis for evidence-based medicine].Cas Lek Cesk. 2003 Feb;142(2):67-9. Cas Lek Cesk. 2003. PMID: 12698530 Czech.
Cited by
-
The Impact of Dairy Products in the Development of Type 2 Diabetes: Where Does the Evidence Stand in 2019?Adv Nutr. 2019 Nov 1;10(6):1066-1075. doi: 10.1093/advances/nmz050. Adv Nutr. 2019. PMID: 31124561 Free PMC article. Review.
-
Validity of the Brief Child and Family Phone Interview by comparison with Longitudinal Expert All Data diagnoses in outpatients.Scand J Child Adolesc Psychiatr Psychol. 2020 Oct 18;6(2):83-90. doi: 10.21307/sjcapp-2018-009. eCollection 2018. Scand J Child Adolesc Psychiatr Psychol. 2020. PMID: 33520755 Free PMC article.
References
-
- Brodsky D, Martin C. Neonatology Review. Kidlington, United Kingdom: Hanley & Belfus; 2003.
-
- Cordis L. Epidemiology: With Student Consult Online Access. Amsterdam, the Netherlands: Elsevier Health Sciences; 2013.
-
- Guyatt GH, Rennie D, Meade MO, Cook DJ. User’s Guide to the Medical literature a manual for evidence-based clinical practice. 2nd edition. New York: NY McGraw Hill; 2008.
-
- Hermansen M. Biostatistics: Some Basic Concepts. Gainesville, FL: Caduceus Medical Publishers; 1990.
-
- Hulley SB, Cummings SR, Browner WS, Grady DG, Newman TB. Designing Clinical Research. Baltimore, MD: Wolters Kluwer Health; 2013.
Grants and funding
LinkOut - more resources
Full Text Sources
Other Literature Sources
