. 2015 Jul 14:9:244.
doi: 10.3389/fnins.2015.00244. eCollection 2015.

Tuning properties and dynamic range of type 1 vomeronasal receptors

Affiliations

Tuning properties and dynamic range of type 1 vomeronasal receptors

Sachiko Haga-Yamanaka et al. Front Neurosci. .

Abstract

The mouse vomeronasal organ (VNO) expresses chemosensory receptors that detect intra-species as well as inter-species cues. The vomeronasal neurons are thought to be highly selective in their responses. The tuning properties of individual receptors remain difficult to characterize due to the lack of a robust heterologous expression system. Here, we take a transgenic approach to ectopically express two type 1 vomeronasal receptors in the mouse VNO and characterize their responses to steroid compounds. We find that V1rj2 and V1rj3 are sensitive to two sulfated estrogens (SEs) and can be activated by a broad variety of sulfated and glucuronidated steroids at high concentrations. Individual neurons exhibit narrow range of concentration-dependent activation. Collectively, a neuronal population expressing the same receptor covers a wide dynamic range in their responses to SEs. These properties recapitulate the response profiles of endogenous neurons to SEs.

Keywords: GCaMP2; calcium imaging; glucuronidated steroid; sulfated steroids; transgenic mice; vomeronasal receptor.


Figures
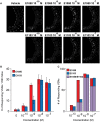
Figure 1
Figure 1
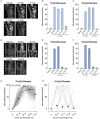
Activation of VSN by E1050 and E1103. (A) Representative imaging experiments showing the VSN responses to E1050 (top) and E1103 (bottom). Scale bar, 50 μm. (B) Bar graph showing the number of VSNs activated by E1050 (red) and E1103 per slice (blue; n = 3 slices). Error bars, S.E.M. (C) Bar graph showing the number of E1050- and/or E1103-responding VSNs in 3 slices. Red, blue, and purple indicate VSNs activated by E1050, E1103, and both E1050 and E1103, respectively.
Figure 2
Figure 2
Activation of VSN by E1050. (A,B) Examples of sigmoidal (A) and bell-shaped (B) dose-response curves to E1050. (C) Dose-response curves of individual cells (gray) and a sigmoidal curve (black) fitted to the average amplitude from all cells. Error bar, S.E.M. (D) Pie charts showing the number of cells exhibiting sigmoidal (S, blue), bell-shaped (B, red), and other (O, green) types of dose responses. Cells with FRC of 10−7 M are shown in gray. Concentration above each pie chart represents the first response concentration of the cells.
Figure 3
Figure 3
Activation of VSN by E1103. (A,B) Examples of sigmoidal (A) and bell-shaped (B) dose-response curves to E1103. (C) Dose-response curves of individual cells (gray) and a sigmoidal curve (black) fitted to the average amplitude from all cells. Error bar, S.E.M. (D) Pie charts showing the number of cells exhibiting sigmoidal (S, blue), bell-shaped (B, red) and other (O, green) types of dose responses. Cells with FRC of 10−7 M are shown in gray. (E,F) Raw traces (left) and dose-response curves (right) of two representative cells simulated by E1050 and E1103 in a sequence with increasing concentrations. Arrows indicate the onset of stimulus delivery.
Figure 4
Figure 4
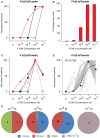
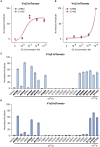
Activation of V1rj2 by E1050. (A) Examples of sigmoidal dose-response curves to E1050 in V1rj2 cells. (B) Bar graph showing the percentage of E1050 activated V1rj2 cells (n = 200). (C) Examples of bell-shaped dose- response curves to E1050 in V1rj2 cells. (D) Dose-response curves of individual cells (gray) and a sigmoidal curve (black) fitted to the average amplitude from all cells. Error bar, S.E.M. (E) Pie charts showing the number of cells exhibiting sigmoidal (S, blue), bell-shaped (B, red), and other (O, green) types of dose responses. Cells with FRC of 10−7 M are shown in gray.
Figure 5
Figure 5
Activation of V1rj2 by E1103. (A) Examples of sigmoidal dose-response curves to E1103 in V1rj2 cells. (B) Bar graph showing the percentage of E1103 activated V1rj2 cells (n = 129). (C) Examples of bell-shaped dose-dependent responses of V1rj2 cells to E1103. (D) Dose-response curves of individual cells (gray) and a sigmoidal curve (black) fitted to the average amplitude from all cells. Error bar, S.E.M. (E) Pie charts showing the number of cells exhibiting sigmoidal (S, blue), bell-shaped (B, red), and other (O, green) types of dose responses. Cells with FRC of 10−7 M are shown in gray.
Figure 6
Figure 6
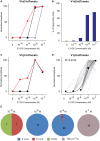
Activation of V1rj3 by E1050. (A) Examples of sigmoidal dose-response curves to E1050 in V1rj3 cells. (B) Bar graph showing the percentage of E1050 activated V1rj3 cells (n = 256). (C) Examples of bell-shaped dose-dependent responses of V1rj3 cells to E1050. (D) Dose-response curves of individual cells (gray) and a sigmoidal curve (black) fitted to the average amplitude from all cells. Error bar, S.E.M. (E) Pie charts showing the number of cells exhibiting sigmoidal (S, blue), bell-shaped (B, red), and other (O, green) types of dose responses. Cells with FRC of 10−7 M are shown in gray.
Figure 7
Figure 7
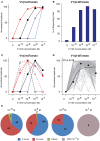
Activation of V1rj3 by E1103. (A) Examples of sigmoidal dose-response curves to E1103 in V1rj3 cells. (B) Bar graph showing the percentage of E1103 activated V1rj3 cells (n = 256). (C) Examples of bell-shaped dose-dependent responses of V1rj3 cells to E1103. (D) Dose-response curves of individual cells (gray) and a sigmoidal curve (black) fitted to the average amplitude from all cells. Error bar, S.E.M. (E) Pie charts showing the number of cells exhibiting sigmoidal (S, blue), bell-shaped (B, red), and other (O, green) types of dose responses. Cells with FRC of 10−7 M are shown in gray.
Figure 8
Figure 8
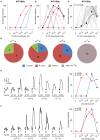
Activation of V1rj2 and V1rj3 by Glucuronidated Estrogens. (A) Representative imaging experiments showing the responses of V1rj2 cells to vehicle control, E1050, E1103, E1072, and E1073 at 10−7 M. Scale bar, 50 μm. (B) Bar graph showing the normalized response to E1050, E1103, E1072, and E1073 in V1rj2 cells at indicated concentration (n = 409). (C) Bar graph showing the normalized response to E1050, E1103, E1072, and E1073 in V1rj2 cells at indicated concentrations (n = 409). (D) Representative imaging experiments showing the responses of V1rj3 cells to vehicle control, E1050, E1103, E1072, and E1073 at 10−7 M. (E) Bar graph showing the normalized response to E1050, E1103, E1072, and E1073 in V1rj3 cells at indicated concentration (n = 204). (F) Bar graph showing the normalized response to E1050, E1103, E1072, and E1073 in V1rj3 cells at indicated concentrations (n = 318). (G,H) Dose-response curve of V1rj2 (G) and V1rj3 (H) cells activated by E1072. Error bars, S.E.M.
Figure 9
Figure 9
Activation of V1rj2 and V1rj3 by Other Sulfated Steroids. (A) Dose-response curves of V1rj2 cells activated by A7864 (n = 201) and E1100 (n = 199). (B) Dose-response curves of V1rj3 cells activated by A7864 (n = 249) and E1100 (n = 249). (C,D) Bar graphs showing the normalized response of V1rj2 (C; n = 183) and V1rj3 (D; n = 373) cells a panel of sulfated steroid compounds. Error bars, S.E.M.
Figure 10
Figure 10
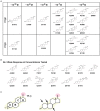
Structural elements of steroid compounds that activate V1rj2 and V1rj3 receptors. (A) Steroid compounds that activate V1rj2 and V1rj3 receptors. The minimal concentrations of activation are indicated. (B) Molecular structures of sulfated or glucuronidated steroids that induce no or weak responses. (C) Schematic illustration of important structural elements required to activate the V1rj2 and V1rj3 receptors. The estradiol backbone (yellow) and 17-β hydroxyl group (pink) are highlighted. Structural permutations that are permissible are indicated by arrows in the right panel.

Similar articles

Cited by

References

    1. Arnson H. A., Holy T. E. (2013). Robust encoding of stimulus identity and concentration in the accessory olfactory system. J. Neurosci. 33, 13388–13397. 10.1523/JNEUROSCI.0967-13.2013 10.1523/JNEUROSCI.0967-13.2013 - DOI - DOI - PMC - PubMed
    1. Belluscio L., Koentges G., Axel R., Dulac C. (1999). A map of pheromone receptor activation in the mammalian brain. Cell 97, 209–220. 10.1016/S0092-8674(00)80731-X 10.1016/S0092-8674(00)80731-X - DOI - DOI - PubMed
    1. Blair I. A. (2010). Analysis of estrogens in serum and plasma from postmenopausal women: past present, and future. Steroids 75, 297–306. 10.1016/j.steroids.2010.01.012 10.1016/j.steroids.2010.01.012 - DOI - DOI - PMC - PubMed
    1. Chamero P., Marton T. F., Logan D. W., Flanagan K., Cruz J. R., Saghatelian A., et al. . (2007). Identification of protein pheromones that promote aggressive behaviour. Nature 450, 899–902. 10.1038/nature05997 10.1038/nature05997 - DOI - DOI - PubMed
    1. Dey S., Matsunami H. (2011). Calreticulin chaperones regulate functional expression of vomeronasal type 2 pheromone receptors. Proc. Natl. Acad. Sci. U.S.A. 108, 16651–16656. 10.1073/pnas.1018140108 10.1073/pnas.1018140108 - DOI - DOI - PMC - PubMed

LinkOut - more resources