. 2015 Jul 17:9:272.
doi: 10.3389/fncel.2015.00272. eCollection 2015.

Interaction of electrically evoked activity with intrinsic dynamics of cultured cortical networks with and without functional fast GABAergic synaptic transmission

Affiliations

Interaction of electrically evoked activity with intrinsic dynamics of cultured cortical networks with and without functional fast GABAergic synaptic transmission

Thomas Baltz et al. Front Cell Neurosci. .

Abstract

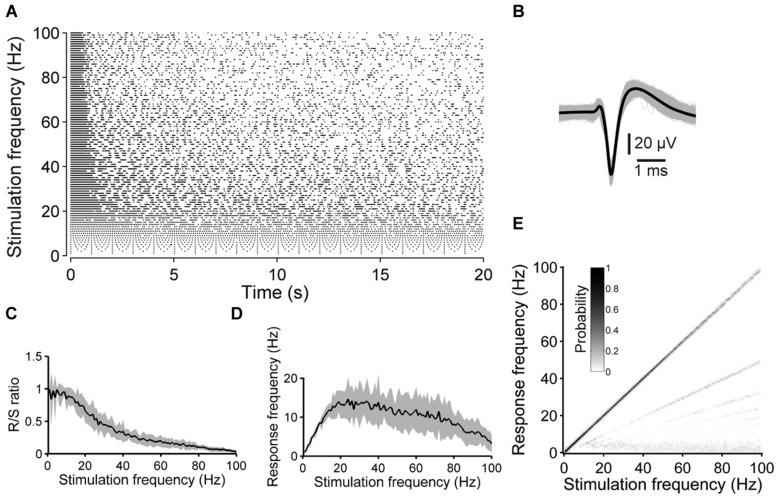
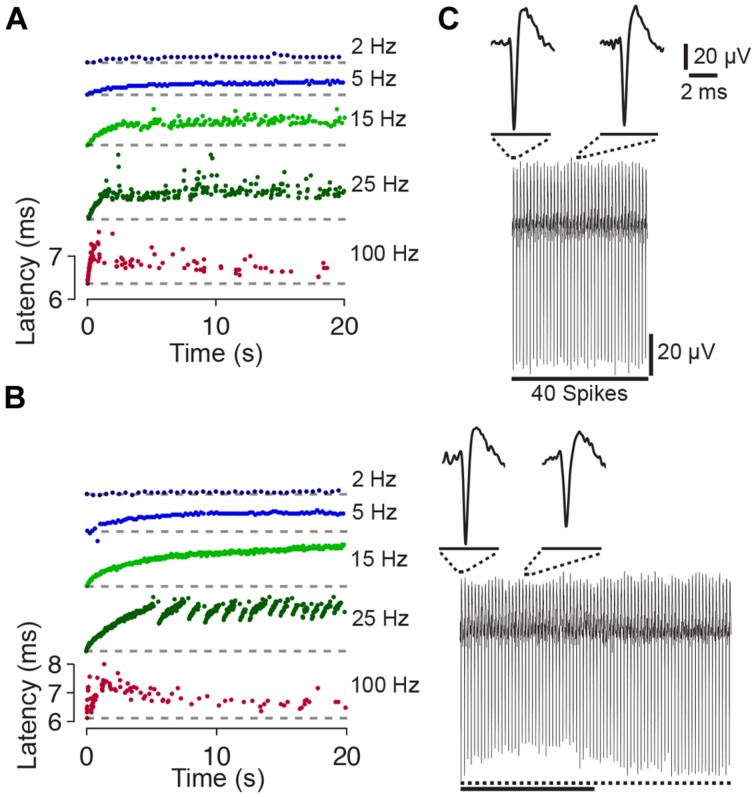
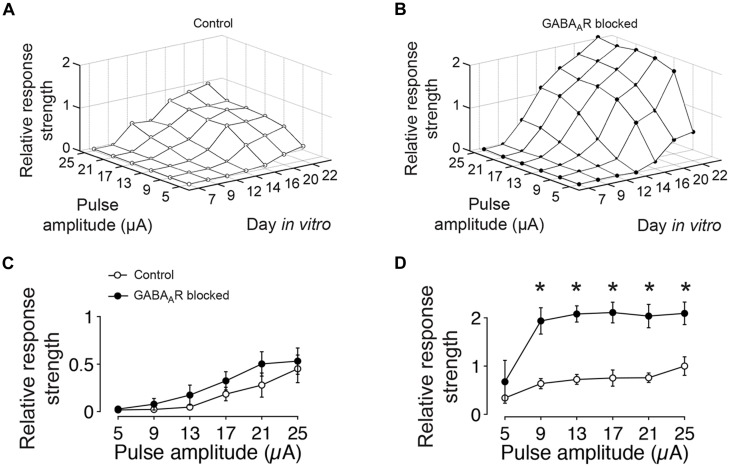
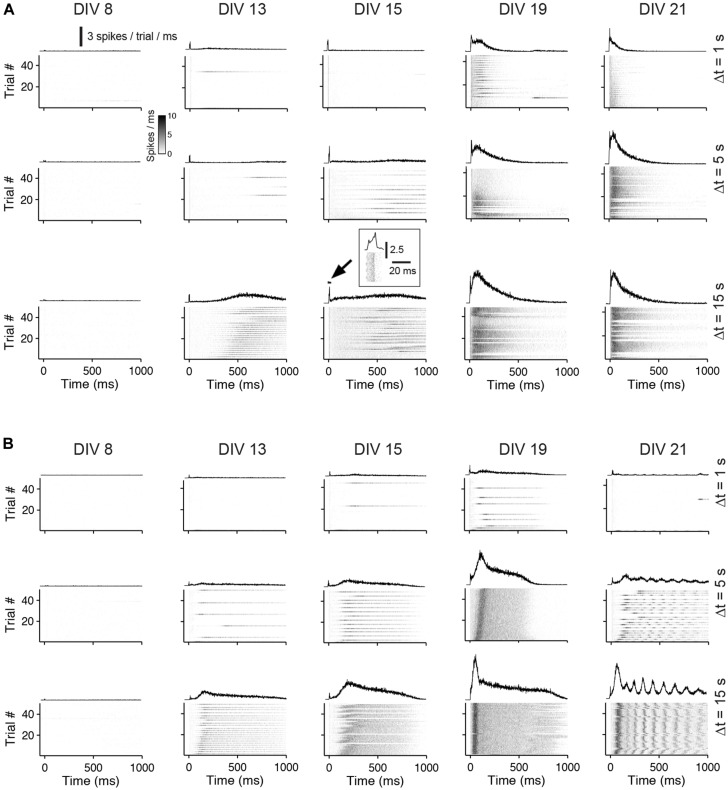
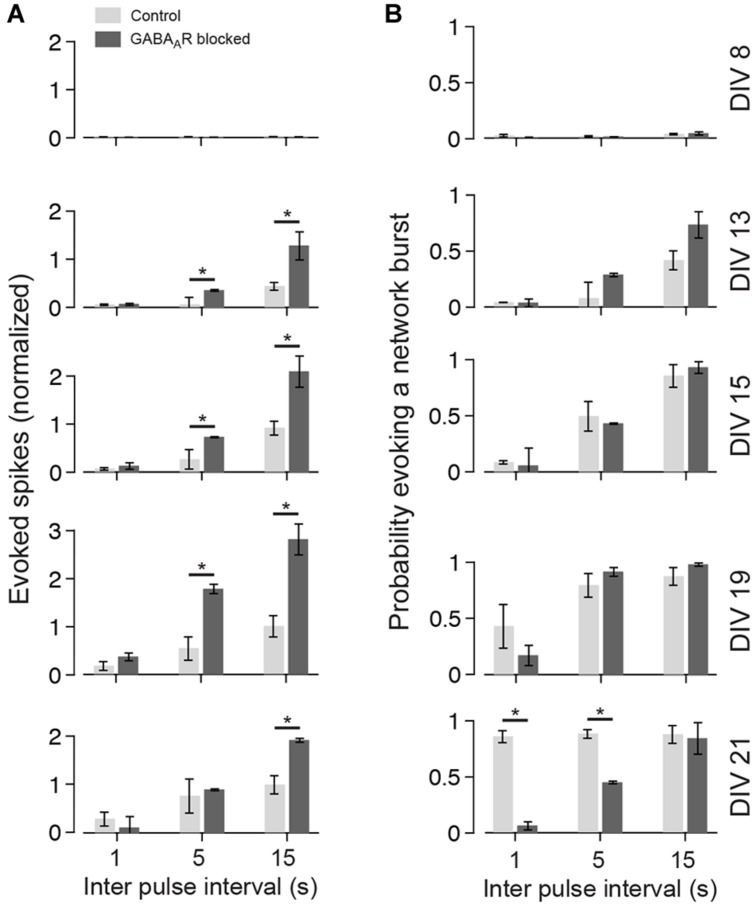
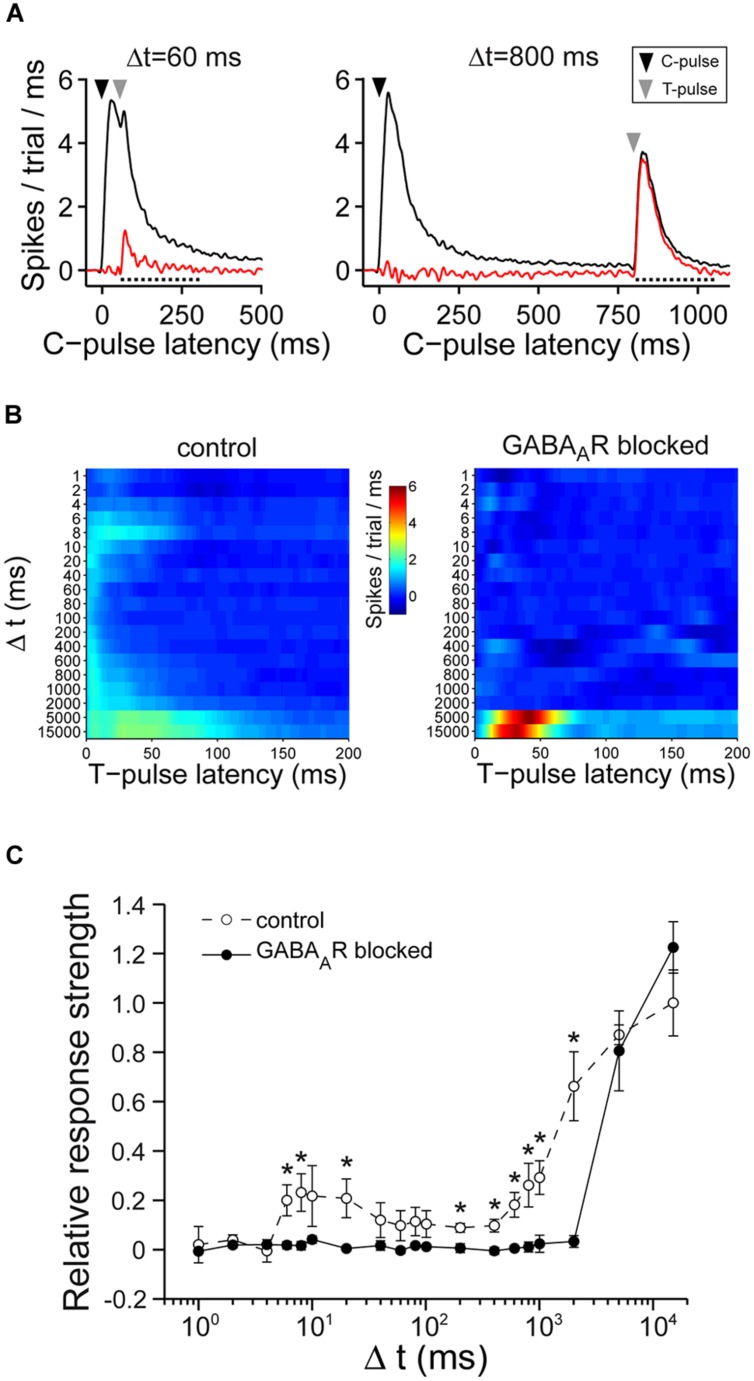
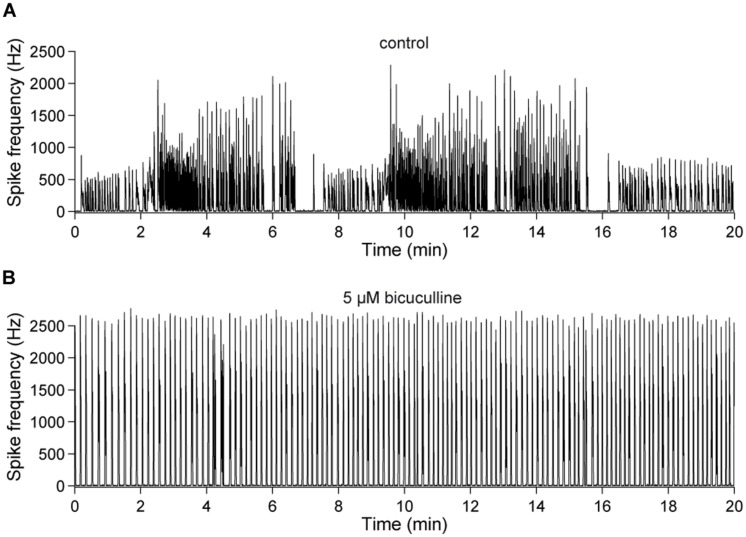
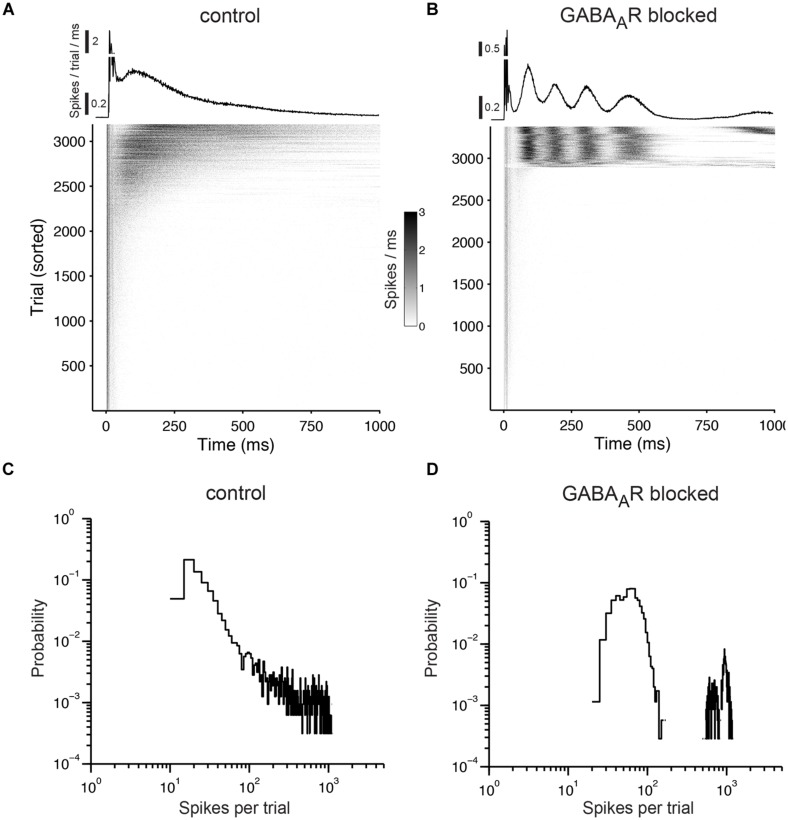
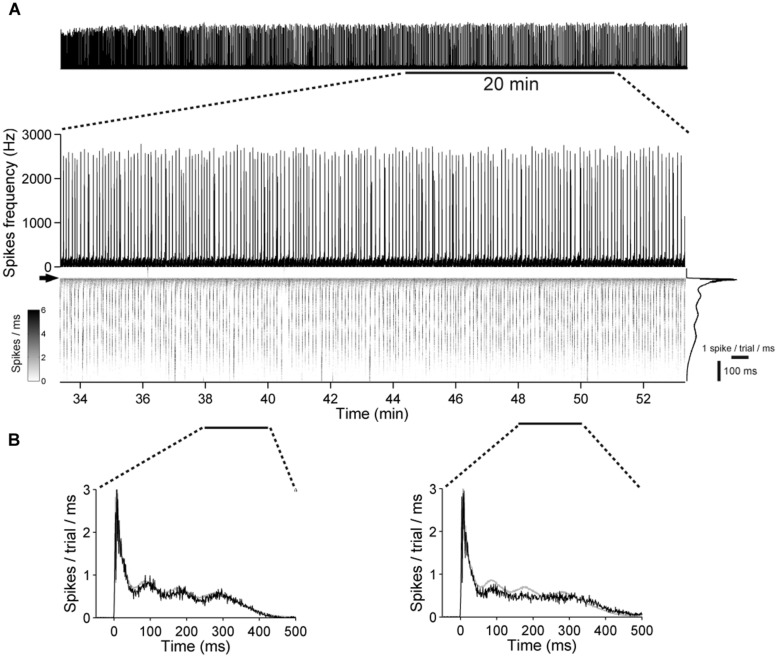
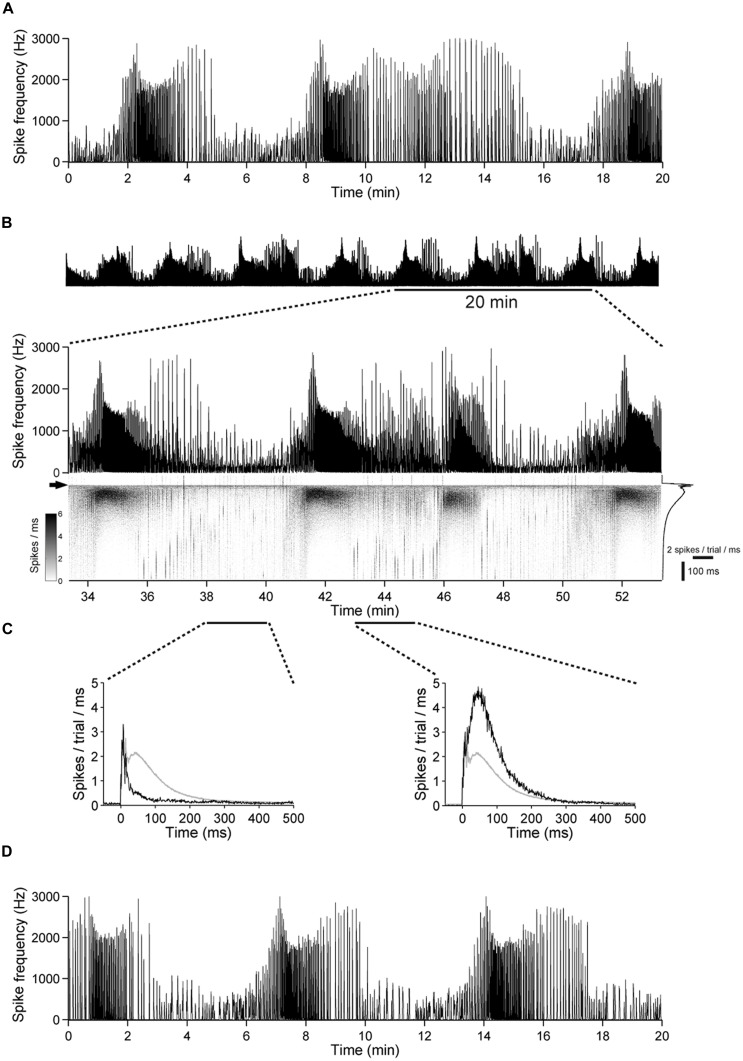
The modulation of neuronal activity by means of electrical stimulation is a successful therapeutic approach for patients suffering from a variety of central nervous system disorders. Prototypic networks formed by cultured cortical neurons represent an important model system to gain general insights in the input-output relationships of neuronal tissue. These networks undergo a multitude of developmental changes during their maturation, such as the excitatory-inhibitory shift of the neurotransmitter GABA. Very few studies have addressed how the output properties to a given stimulus change with ongoing development. Here, we investigate input-output relationships of cultured cortical networks by probing cultures with and without functional GABAAergic synaptic transmission with a set of stimulation paradigms at various stages of maturation. On the cellular level, low stimulation rates (<15 Hz) led to reliable neuronal responses; higher rates were increasingly ineffective. Similarly, on the network level, lowest stimulation rates (<0.1 Hz) lead to maximal output rates at all ages, indicating a network wide refractory period after each stimulus. In cultures aged 3 weeks and older, a gradual recovery of the network excitability within tens of milliseconds was in contrast to an abrupt recovery after about 5 s in cultures with absent GABAAergic synaptic transmission. In these GABA deficient cultures evoked responses were prolonged and had multiple discharges. Furthermore, the network excitability changed periodically, with a very slow spontaneous change of the overall network activity in the minute range, which was not observed in cultures with absent GABAAergic synaptic transmission. The electrically evoked activity of cultured cortical networks, therefore, is governed by at least two potentially interacting mechanisms: A refractory period in the order of a few seconds and a very slow GABA dependent oscillation of the network excitability.

Keywords: MEA; cell culture; cerebral cortex; gamma-aminobutyric acid; multielectrode arrays; neocortex; network activity; stimulation.


Figures

FIGURE 1
FIGURE 1
Synaptically independent spike responses to 1–100 Hz stimulation. (A) The raster plot shows an example of the spike responses to 20 s long pulse trains applied at various stimulation frequencies. (B) All ≈20000 spike waveforms detected during the experiment in (A) (gray: single spike, black: average). (C) R/S ratios and (D) mean spike frequency during the 20 s long stimulation periods as a function of the stimulation frequency, averaged over five experiments with four cultures (shaded areas indicate SEM). (E) The graph shows an estimation of the evoked frequency spectrum below 100 Hz of all stimulation blocks of the experiment shown in (A). At high stimulation rates the neuron is not entrained by the stimulation pulses in a 1:1 manner anymore and, consequently, the main diagonal weakens and lines below the main diagonal become evident.
FIGURE 2
FIGURE 2
Latency and amplitude change of synaptically independent spike responses to 1–100 Hz stimulation. (A) Spike latency as a function of time during 20 s long stimulation blocks. The raster plots for the experiment shown in Figure 1A indicate a change of the spike latency during different periods of stimulation. Colors code stimulation frequency (see labeling on the right). The change of the spike latency depends on the stimulation frequency. Note that each raster plot was shifted in y-direction for clarity (i.e., first spike, at time index zero, always occurs with a relatively short latency post stimulus; ≈6.3 ms; the latency of the first spike is shown as dashed line). (B) Another experiment with abrupt changes of the spike latency at the stimulation frequency of 25 Hz. (C) (Top) All 40 spike wave forms of the experiment shown in Figure 1A during 2 Hz stimulation are stacked from left (spike evoked by the first pulse) to the right (spike evoked by the last pulse). Insets show an enlarged view of the first and twentieth spike. No major differences in spike shape or amplitude become apparent. (Bottom) Same as above but during a 100 Hz stimulation block. During ongoing stimulation, the spike amplitude decreases and then recovers. Dotted line below the stacked spikes indicates the amplitude of the first spike. The solid line indicates 40 spikes (same scale as above).
FIGURE 3
FIGURE 3
GABA-dependent differences in the amount of evoked spikes to extracellular current pulses of different amplitudes. (A) The graph shows the relative amount of evoked spikes to low-frequency (0.1 Hz) electrical stimulation with different pulse amplitudes and at different DIV (average of four cultures). The graph is normalized to its maximum at DIV 22 and 25 μA. (B) Same as (A) but for age-matched sister cultures with chronically blocked GABAAergic transmission (n = 4). The graph is normalized to the maximum of controls (DIV 22 and 25 μA in A). (C) Differences between cultures with (filled circles) and without blocked (empty circles) GABAAergic synaptic transmission were not significant at DIV 12. (D) After 22 DIV, differences were significant (n = 4 cultures each group; asterisks indicate significance; *p < 0.05).
FIGURE 4
FIGURE 4
Network responses to pulse trains of different frequencies during the development. (A) The gray scale graphs show the network responses to individual pulses applied at different inter-pulse intervals (Δt = 1, 5, or 15 seconds) and DIV (top labeling) for the same culture (bin size is 1 ms). The line graph above each gray scale graph shows the trial-averaged responses. Trials that fall in the burst responses of a previous pulse were omitted. The inset shows the early response at higher time resolution. (B) Same as (A) except for a culture with GABAAergic transmission being chronically blocked.
FIGURE 5
FIGURE 5
Summary graph for the development of the late responses. (A) The bar plots show the amount of evoked spikes during 21–1000 ms post stimulus in response to various pulse frequencies (light gray controls; dark gray chronically blocked GABAARs) at different DIV (see labeling on the right in B). The graphs are normalized to the maximum of control cultures (DIV 21; Δt = 15000 ms). (B) Same as (A), but for the probability of evoking a network burst (n = 4 each group; asterisks indicate significance; *p < 0.05).
FIGURE 6
FIGURE 6
Double-pulse experiments. (A) (Left) Shows an example of the average responses before (black) and after (red) the subtraction of the average response to single pulses for Δt = 60 ms. The dotted line indicates the time window of the first wave of activity post stimulus (200 ms) which was considered for the analysis. (Right) Similar graph to the one on the left except for Δt = 800 ms. (B) The graph shows the spikes post stimulus the T-pulse, after subtraction of spikes that were evoked by single pulses for one culture without (left) and with (right) chronically blocked GABAARs. (C) The summary graph shows the T-pulse responses. The graph is normalized to the average responses of cultures with intact GABAAergic synaptic transmission at Δt = 15000 ms (n = 7 control cultures; n = 6 cultures with chronically blocked GABAAergic synaptic transmission; 21–26 DIV; asterisks indicate significant differences between control and blocked cultures; *p < 0.05).
FIGURE 7
FIGURE 7
Slow changes of the spontaneous network activity are mediated by GABAAergic synaptic transmission. (A) Spontaneous population activity of a 22 DIV old cortical culture under control conditions. The line-graph indicates the global firing rate, which is defined as the number of detected spikes through all electrodes per time unit (second). The slow change of the overall network activity was abolished by an (B) acute blockade of GABAARs (bicuculline, 5 μM).
FIGURE 8
FIGURE 8
Responses to prolonged electrical stimulation. (A) The top graph shows the trial average of the population responses to electrical stimulation at 1 Hz. The early responses are cut off at 0.5. The gray scale graph below shows the population responses for each stimulation pulse (trials that fall within a network burst were not considered and were omitted). Each gray dot reflects the number of evoked spikes for a 1-ms wide bin. The graph is sorted by the number of evoked spikes. Note that virtually all activity in the network is time-locked to the stimulation pulses. (B) Same as (A) except for a culture with chronically blocked GABAARs. (C) Distribution of the number of evoked spikes during prolonged electrical stimulation. Cultures were stimulated for one hour at 1 Hz under control conditions and (D) with chronically blocked GABAARs. Similar results were obtained in six cultures per group aged between 22 and 36 DIV (see main text for details). The bin width is five spikes.
FIGURE 9
FIGURE 9
Low variability in the network excitability during prolonged stimulation in networks with chronical absence of GABAAR mediated synaptic transmission. (A) (Top) A 21 DIV old culture during a 1 h stimulation period, at 1 Hz. (Bottom) A 20-min long period is shown enlarged. The gray scale graph shows the evoked responses ranging from 50 ms before up to 500 ms after each stimulation pulse, temporally aligned to the line graph above. The arrow denotes the time point of stimulation. Trial-averaged population response is shown on the right. (B) Trial-averaged population response of the network during 2 min long time intervals (black: response during the indicated interval; gray: all trials).
FIGURE 10
FIGURE 10
The excitability undergoes slow changes in networks with intact GABAergic synaptic transmission. (A) Spontaneous population activity of a 22 DIV old cortical culture. The amount of spike activity undergoes recurrent, spontaneous slow changes over time. (B) (Top) The same culture as in (A) during a 1 h stimulation period, at 1 Hz. (Bottom) A 20-min long period is shown enlarged. The gray scale graph shows the evoked responses ranging from 50 ms before up to 500 ms after each stimulation pulse, temporally aligned to the line graph above. The arrow denotes the time point of stimulation. Trial-averaged population response is shown on the right. (C) Trial-averaged population response of the network during 2 min long time intervals (black: response during the indicated interval; gray: all trials). (D) Spontaneous activity of the culture in (A–C) after the stimulation experiment.

Similar articles

Cited by

References

    1. Ahuja A. K., Dorn J. D., Caspi A., Mcmahon M. J., Dagnelie G., Dacruz L., et al. (2011). Blind subjects implanted with the Argus II retinal prosthesis are able to improve performance in a spatial-motor task. Br. J. Ophthalmol. 95 539–543. 10.1136/bjo.2010.179622 - DOI - PMC - PubMed
    1. Allene C., Cattani A., Ackman J. B., Bonifazi P., Aniksztejn L., Ben-Ari Y., et al. (2008). Sequential generation of two distinct synapse-driven network patterns in developing neocortex. J. Neurosci. 28 12851–12863. 10.1523/JNEUROSCI.3733-08.2008 - DOI - PMC - PubMed
    1. Arnold F. J., Hofmann F., Bengtson C. P., Wittmann M., Vanhoutte P., Bading H. (2005). Microelectrode array recordings of cultured hippocampal networks reveal a simple model for transcription and protein synthesis-dependent plasticity. J. Physiol. 564 3–19. 10.1113/jphysiol.2004.077446 - DOI - PMC - PubMed
    1. Bakkum D. J., Chao Z. C., Potter S. M. (2008). Long-term activity-dependent plasticity of action potential propagation delay and amplitude in cortical networks. PLoS ONE 3:e2088 10.1371/journal.pone.0002088 - DOI - PMC - PubMed
    1. Baljon P. L., Chiappalone M., Martinoia S. (2009). Interaction of electrically evoked responses in networks of dissociated cortical neurons. Phys. Rev. E Stat. Nonlin. Soft Matter Phys. 80 031906 10.1103/PhysRevE.80.031906 - DOI - PubMed

LinkOut - more resources