. 2015 Jul 16:9:275.
doi: 10.3389/fncel.2015.00275. eCollection 2015.

An excitatory GABA loop operating in vivo

Affiliations

An excitatory GABA loop operating in vivo

Guadalupe Astorga et al. Front Cell Neurosci. .

Abstract

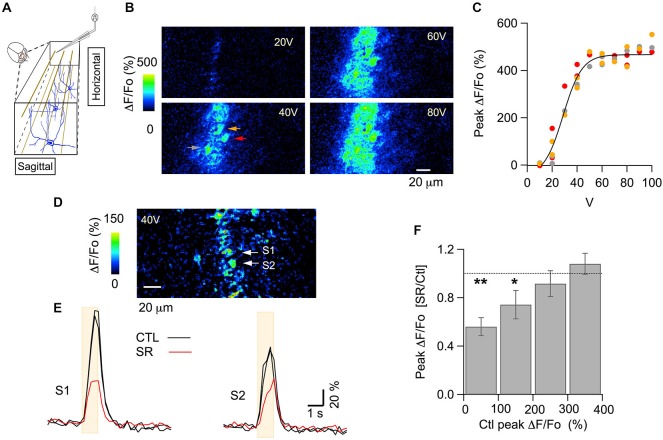
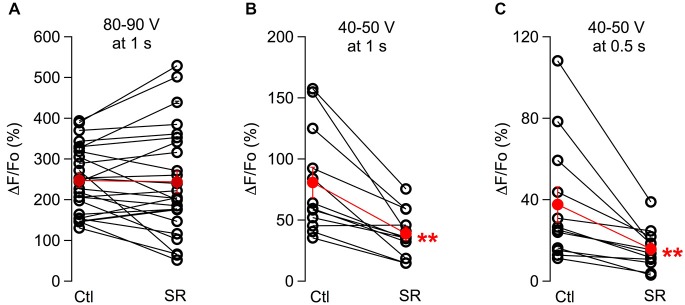
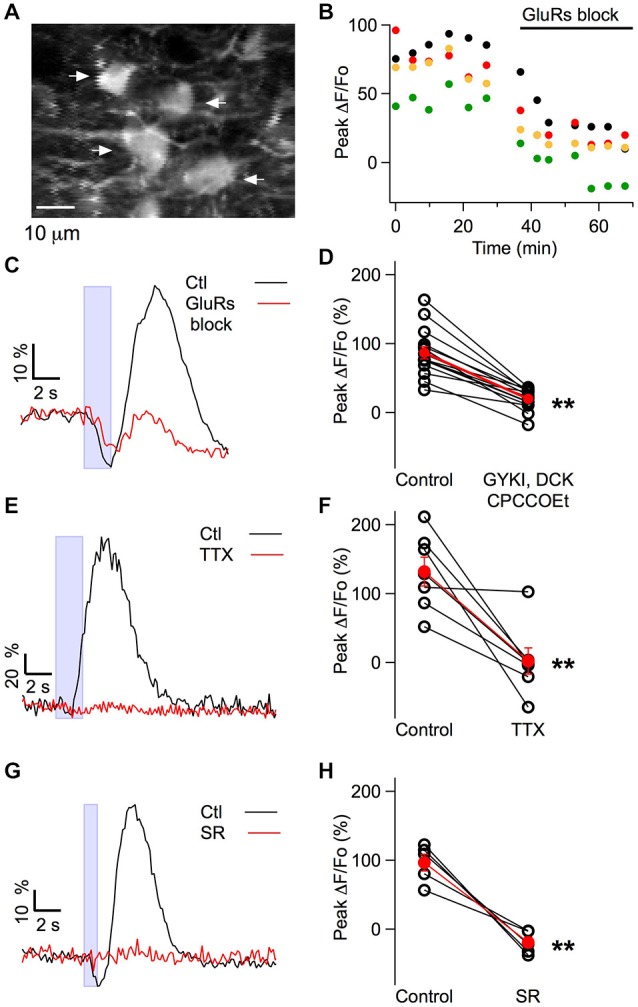
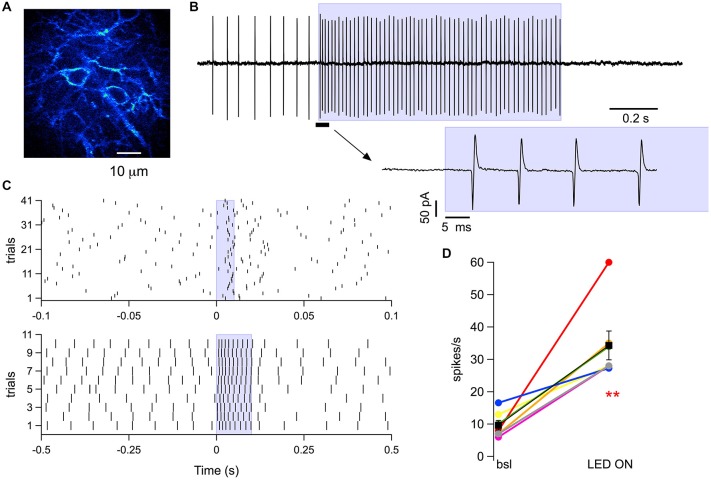
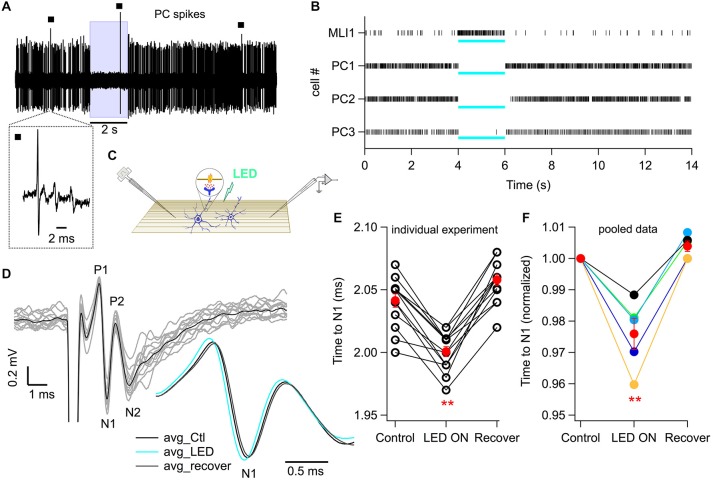
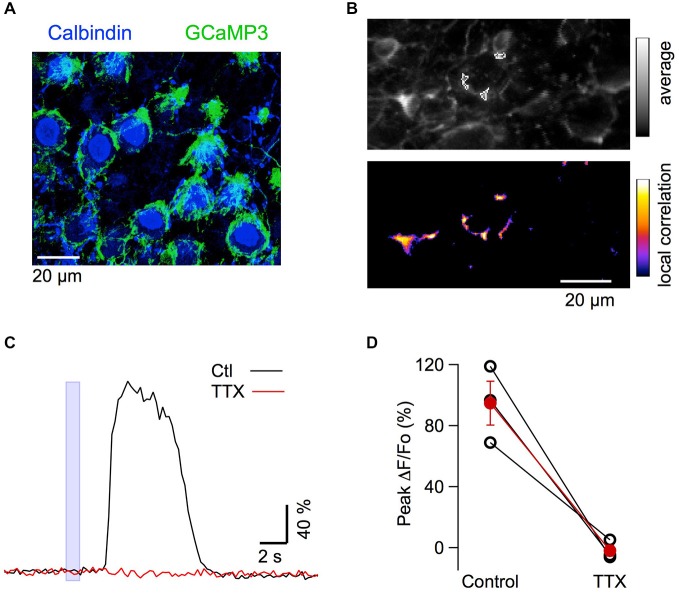
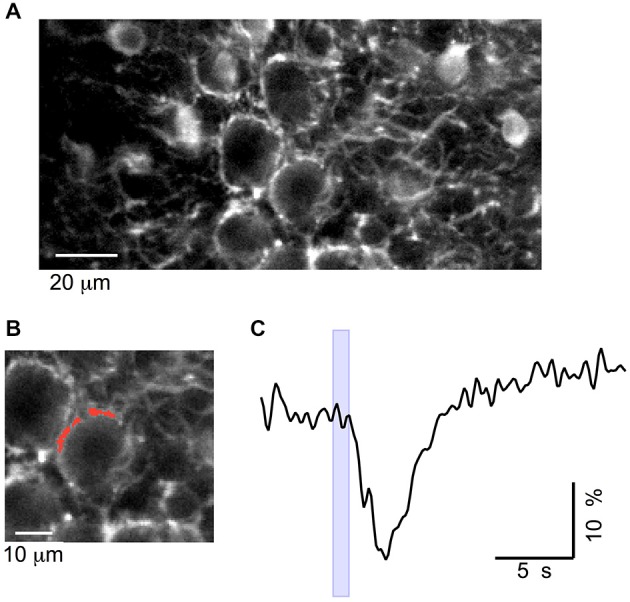
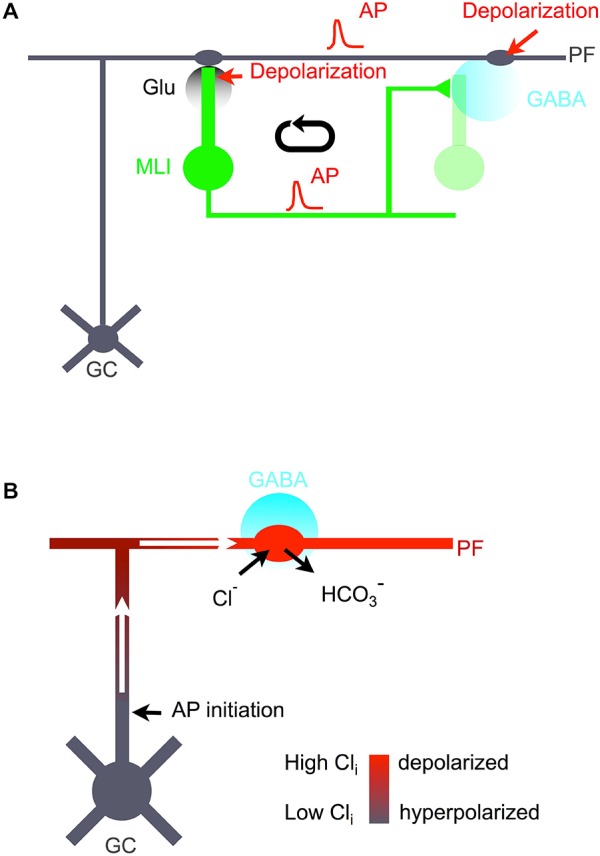
While it has been proposed that the conventional inhibitory neurotransmitter GABA can be excitatory in the mammalian brain, much remains to be learned concerning the circumstances and the cellular mechanisms governing potential excitatory GABA action. Using a combination of optogenetics and two-photon calcium imaging in vivo, we find that activation of chloride-permeable GABAA receptors in parallel fibers (PFs) of the cerebellar molecular layer of adult mice causes parallel fiber excitation. Stimulation of PFs at submaximal stimulus intensities leads to GABA release from molecular layer interneurons (MLIs), thus creating a positive feedback loop that enhances excitation near the center of an activated PF bundle. Our results imply that elevated chloride concentration can occur in specific intracellular compartments of mature mammalian neurons and suggest an excitatory role for GABAA receptors in the cerebellar cortex of adult mice.

Keywords: GABA; calcium; cerebellum; interneurons; parallel fibers.


Figures

Figure 1
Figure 1
GABAARs modulate PF-evoked somatic Cai rises in MLIs in vivo. (A) Scheme for the electrical stimulation protocol used in the anesthetized mouse. Parallel fibers (PFs) are depicted in brown, MLIs in blue. Pulses were delivered through a theta-glass pipette placed 30–50 μm above the imaged horizontal plane and ~150 μm lateral to this site, to avoid direct stimulation of the neurons in that field. (B) ΔF/Fo images from two-photon laser scanning of MLIs expressing GCaMP3. Each panel shows the peak of the response to electrical stimulation (100 pulses of 100 μs duration delivered at 100 Hz) at the indicated intensity. (C) Stimulus-response curve for the peak ΔF/Fo from the three molecular layer interneuron (MLI) somata indicated by color arrows in (B). The solid line corresponds to the fit of the data by a sigmoidal function, yielding 514 ± 67% for the maximum value and 29 ± 3 V for the abscissa at half maximum. (D,E) A different example for the signals elicited by 40 V stimulus trains. (D) ΔF/Fo image at the peak of the response. Two MLI somata (S1 and S2) are identified by white arrows. (E) Time course for the Cai rises in the two MLI somata indicated by white arrows in (D) in control saline (black traces) and 35–50 min after addition of the GABAAR specific blocker SR95531 (75 μM) to the solution bathing the craniotomy (red trace). Each trace is the average of three consecutive runs. To illustrate the signal stability prior to drug application, control runs were averaged over two control periods. The beige boxes denote the time of extracellular stimulation. (F) The effect of SR95531 depends on the initial amplitude of the PF-evoked signal. Data was pooled from 37 somata recorded from seven mice. Ratios of peak ΔF/Fo in control over drug were grouped by bins according to the peak ΔF/Fo value in the control runs. Values for each soma were averaged over three consecutive runs for the control period and for the same number of runs taken 30–50 min after drug application. Error bars are mean ± SEM. Number of cells and p value for paired Student’s t-test were: 9 and 0.002 for the first bin; 11 and 0.05 for the second bin; 9 and 0.47 for the third bin; 8 and 0.31 for the fourth bin. *denotes groups with p ≤ 0.05; **groups with p ≤ 0.01. In six of these experiments, comparison of the F910/F810 values (see “Materials and Methods” Section) in control and after addition of SR95531 yielded no significant difference (p value for paired Student’s t-test: 0.34) suggesting that no significant changes in basal Cai levels occurred.
Figure 2
Figure 2
The effect of GABAARs block depends on the stimulation protocol. Pair plots for peak ΔF/Fo values in control conditions and in the presence of SR95531 are shown for responses to 100 Hz, 1 s long trains using maximal stimulus intensities (A) and low stimulus intensities (B). (C) Analysis of the same data set as in (B) at 0.5 s. For all cases, values for each soma were averaged over 3 consecutive runs for the control period and for the same number of runs taken 30–50 min after drug application. Open symbols represent individual somata and red dots the corresponding average; error bars are SEM. **p ≤ 0.01.
Figure 3
Figure 3
Cai signals elicited in MLIs by iontophoretic application of the selective GABAAR agonist muscimol in vivo. (A) Merged image of the average of 30 pre-stimulus two-photon laser scanning images (gray scale) and the correlation image (see “Materials and Methods” Section; fire pseudo color scale) for the same field following a muscimol challenge. Four MLI somata (S0, S1, S2 and S3) are identified by white arrows. (B) Individual MLI somata (identified by arrows in A) in the same visual field respond differently to a 1 s long muscimol iontophoresis (50 mM in the pipette), as indicated by the blue box. The estimated concentration of muscimol released is 50–100 μM (see “Materials and Methods” Section). The pipette was located approximately 20–50 μm above the imaged field. (C) Pooled data showing the distribution of the response type induced by muscimol iontophoresis across animals (10 mice). This analysis was performed only in those experiments in which more than two somata were present in the imaged field. (D) The excitatory effect of muscimol is negatively correlated to the somatic basal fluorescence level. For each field imaged, the pre-stimulus fluorescence levels for all somata were normalized to the value of the highest soma in the field (solid line: linear regression fit; regression coefficient = −0.41; p < 0.001; pooled data from 10 mice).
Figure 4
Figure 4
Pharmacological profile of the muscimol-evoked Cai rises obtained in MLIs in vivo. (A) Average of 30 pre-stimulus two-photon laser scanning images of MLIs. (B) A cocktail of glutamate receptor blockers (GYKI 100 μM, APV 20 μM, CPCCOEt 100 μM) decreased the peak somatic ΔF/Fo induced by muscimol in the four MLIs somata indicated by arrows in (A). (C,E,G) Representative examples for the time course of the somatic fluorescence changes induced by muscimol iontophoresis in control conditions and after addition of the indicated blockers to the solution bathing the craniotomy. Blue boxes denote the time of muscimol application. Concentrations for the glutamate receptor blockers in (C,D) were as in (B); in (E,F) TTX was used at 4 μM; in (G,H) SR95531 was used at 75 μM. Note that in (C), the fluorescence increase (reflecting excitation) was highly sensitive to the glutamate receptor antagonists whereas the decrease in fluorescence (reflecting inhibition) was unaffected. (D,F,H) Pair plots for the peak somatic ΔF/Fo values in control conditions and in the presence of the indicated drugs. Open symbols represent individual somata and red dots the corresponding average; error bars are SEM. The average block by the glutamate antagonists was 78 ± 5%, n = 15 somata from six mice (p = 3 × 10⁻⁷). TTX completely blocked the response with an average block of 98 ± 17%, n = 7 somata from six mice (p = 0.005). SR95531 completely blocked the response with an average block of 117 ± 6%, n = 5 somata from four mice (p = 0.004). All p values are for paired Student’s t-test. **p < 0.01. F910/F810 values (see “Materials and Methods” Section) were monitored in two of the glutamate blocker experiments in control and in the presence of the blockers and no significant difference was found (p value for paired Student’s t-test: 0.50) arguing against significant changes in basal Cai levels.
Figure 5
Figure 5
MLI responses to photostimulation in cerebellar slices. (A) Two-photon laser scanning image from a sagittal slice of a ChR2-YFP mouse, showing somata and neurites of MLIs (post-natal age 37). (B) A 1 s long wide-field photostimulation using a 470 nm LED coupled to a 1 mm optical fiber placed inside the slice chamber induced an increase in MLI spike frequency that persisted throughout the light pulse and was followed by a long pause. Spikes were recorded in the loose seal cell-attached configuration. The blue box denotes the time of photostimulation. The inset below displays, at an expanded time scale, the portion of the recording just before and during the onset of the light pulse (as indicated by the solid black bar and the arrow). (C) Raster plots from the same MLI for spikes recorded in consecutive runs before, during and after photostimulation lasting either 10 ms (upper panel) or 100 ms (lower panel) at the time indicated by the blue boxes. (D) Pooled data for the spike frequency obtained in seven MLIs in control conditions and during 1 s photostimulation. Colored dots represent individual somata and black squares the corresponding average; error bars are SEM; p value for paired Student’s t-test: 0.003. **p ≤ 0.01. The power out of the fiber for all recordings shown was 6 mW.
Figure 6
Figure 6
Photostimulation of MLIs increases PF excitability in vivo. (A) Representative trace of a continuous recording of Purkinje cell (PC) spikes from an anesthetized mouse in which MLIs express ChR2-YFP under the control of the nNOS promoter. Wide-field photostimulation with a 470 nm LED coupled to a 1 mm optical fiber (8 mW out of the fiber) placed in the solution bathing the craniotomy silences the simple spikes of PCs. The blue box marks the time of photostimulation. Black squares indicate complex spikes, identified by their multicomponent wave shape, visible in the expanded trace shown below. (B) Raster plots from four different animals in which spikes were recorded either from an MLI (MLI1) or from PCs (PC1, PC2 and PC3). PC3 corresponds to the example shown in (A). Note the light-evoked increase in spike rate for the MLI and the silencing for the three PCs. The blue bars below each raster indicate the time of photostimulation. (C) Schematic of PF volley recording and photostimulation in vivo. PFs are depicted in brown and MLIs in blue. The inset portrays the suggested MLI-to-PF GABAergic signaling. (D) PF volley traces recorded by an extracellular electrode placed superficially in the ML of an anesthetized ChR2-YFP mouse. PFs were stimulated at 1 Hz (100 μs pulses, −70 V) with a theta glass pipette (see “Materials and Methods” Section for details). The black trace is the average of 14 repetitions (single traces in gray). The inset shows an expanded view of the averaged N1 wave, representing the AP propagating along the PFs, in control conditions (black), during light (blue; 1 s-long), and after recovery (gray). (E) The effect of photostimulation on the time to the N1 wave for the experiment shown in (D). Each data triplet represents a set of volley recordings in control conditions, followed by LED stimulation and recovery. Red dots: mean ± SEM across trials. p = 6 × 10⁻⁷, paired Student’s t-test, n = 14 trials. (F) Effect of photostimulation on the time to N1 wave for averaged values from five animals. Red dots: mean ± SEM across the five animals. p = 0.007, paired Student’s t-test. **p < 0.01.
Figure 7
Figure 7
MLI axonal responses to muscimol in vivo. (A) Confocal z-stack projection (10 μm depth) from a transverse cerebellar slice of a mouse expressing GCaMP3. The slice was labeled with antibodies for calbindin (Cb). GCaMP3 expressing varicosities (green) surround the Cb positive PC somata (blue). (B) Top panel: average of 20 pre-stimulus two-photon images in the anesthetized mouse, at a depth of 150–200 μm. Lower panel: corresponding correlation image following muscimol application. The ROIs analyzed in (C) are drawn over the average image in (B). (C) Time course of the response to muscimol in control period and 24–34 min after addition of TTX to the solution bathing the craniotomy. Responses were averaged from all ROIs and over 3 consecutive trials in each condition. (D) Block by TTX of the fluorescent responses in basket varicosities. Pair plots for the peak ΔF/Fo values in control condition and in the presence of 2 μM TTX for three different animals; the red dots give mean ± SEM.
Figure 8
Figure 8
Muscimol silencing of basket terminals in vivo. (A) Two-photon image of the cerebellar cortex at the depth of 150–200 μm. (B) Zoom of the image in (A), with the analyzed ROI depicted in red. (C) Time course of the change in fluorescence elicited by muscimol, at the time indicated by the blue box, with the iontophoresis pipette placed in front of the terminal.
Figure 9
Figure 9
Excitatory GABA loop. (A) Cellular mechanism and functional role of excitatory GABA action in the cerebellar molecular layer. Following firing of granule cells (GC) and associated PFs (gray), postsynaptic MLIs (green) are depolarized, leading to AP firing and to increased Cai levels both in somata and in synaptic terminals. Synaptic terminal excitation produces GABA release (cyan). While released GABA affects postsynaptic cells (light green), spillover GABA diffuses to PF varicosities. These varicosities bear GABAARs and are depolarized by spillover GABA. This enhances AP firing in PFs, thus closing the loop. (B) Proposed model of GC excitation following activation of PF GABAARs. In PF varicosities, because of a favorable surface to volume ratio, activation of GABAARs leads to Cl entry, bicarbonate exit, and membrane depolarization (depicted in red). No AP is initiated at the site of GABA action because of shunting inhibition. However, the depolarized varicosity acts as a current sink, drawing depolarizing current flow along the axon cable (white arrows). This leads to AP initiation at sites where GABAARs are not activated, e.g., at the GC axon initial segment.

Similar articles

Cited by

References

    1. Alger B. E., Nicoll R. A. (1979). GABA-mediated biphasic inhibitory responses in hippocampus. Nature 281, 315–317. 10.1038/281315a0 - DOI - PubMed
    1. Ben-Ari Y. (2002). Excitatory actions of gaba during development: the nature of the nurture. Nat. Rev. Neurosci. 3, 728–739. 10.1038/nrn920 - DOI - PubMed
    1. Ben-Ari Y., Cherubini E., Corradetti R., Gaiarsa J. L. (1989). Giant synaptic potentials in immature rat CA3 hippocampal neurones. J. Physiol. 416, 303–325. - PMC - PubMed
    1. Bregestovski P., Bernard C. (2012). Excitatory GABA: how a correct observation may turn out to be an experimental artifact. Front. Pharmacol. 3:65. 10.3389/fphar.2012.00065 - DOI - PMC - PubMed
    1. Brenowitz S. D., Regehr W. G. (2007). Reliability and heterogeneity of calcium signaling at single presynaptic boutons of cerebellar granule cells. J. Neurosci. 27, 7888–7898. 10.1523/jneurosci.1064-07.2007 - DOI - PMC - PubMed

LinkOut - more resources