

Modulation of sensorimotor cortex by repetitive peripheral magnetic stimulation
- PMID: 26236220
- PMCID: PMC4500907
- DOI: 10.3389/fnhum.2015.00407
Modulation of sensorimotor cortex by repetitive peripheral magnetic stimulation
Abstract
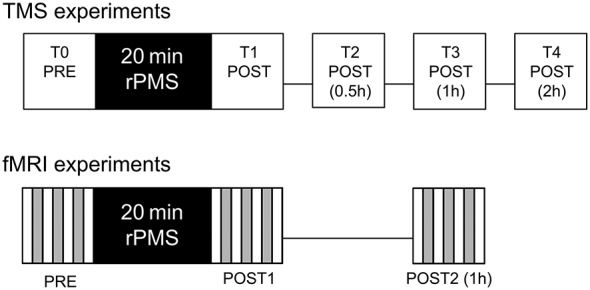
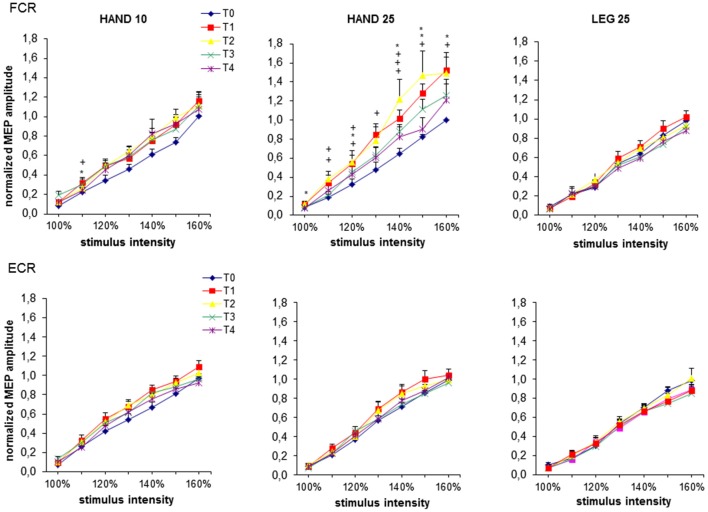
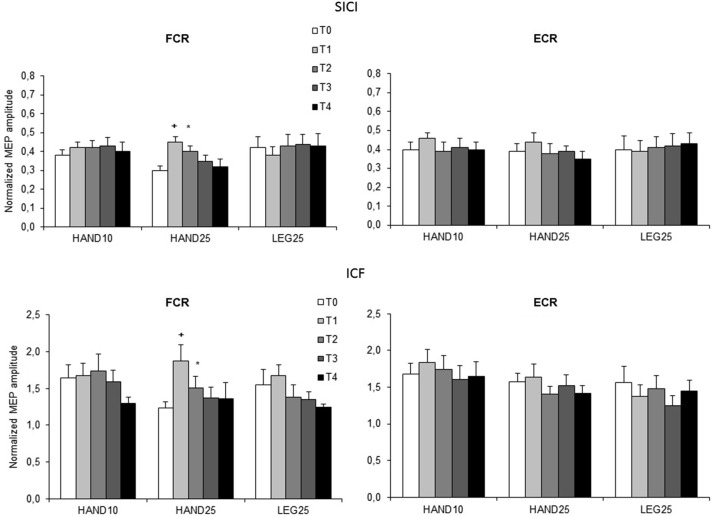
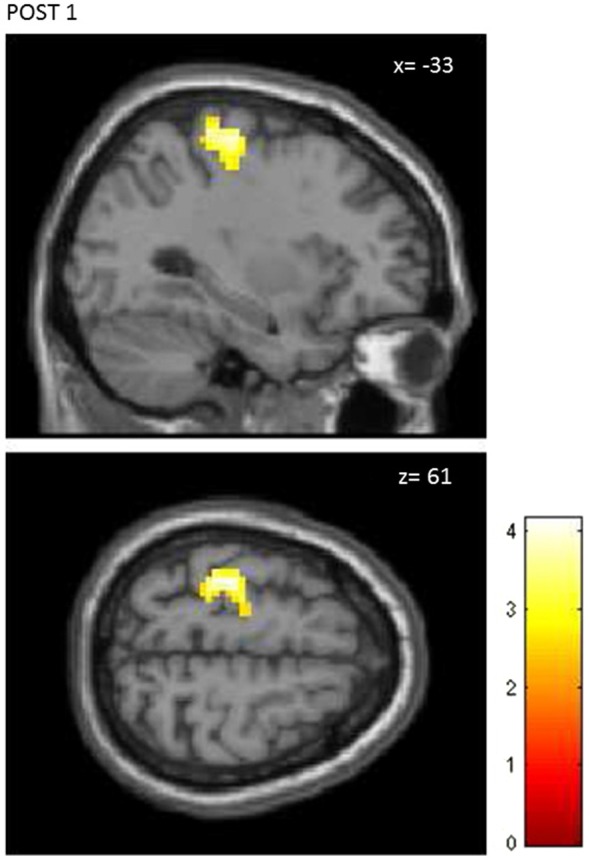
This study examines with transcranial magnetic stimulation (TMS) and with functional magnetic resonance imaging (fMRI) whether 20 min of repetitive peripheral magnetic stimulation (rPMS) has a facilitating effect on associated motor controlling regions. Trains of rPMS with a stimulus intensity of 150% of the motor threshold (MT) were applied over right hand flexor muscles of healthy volunteers. First, with TMS, 10 vs. 25 Hz rPMS was examined and compared to a control group. Single and paired pulse motor evoked potentials (MEPs) from flexor carpi radialis (FCR) and extensor carpi radialis (ECR) muscles were recorded at baseline (T0), post rPMS (T1), 30 min post (T2), 1 h post (T3) and 2 h post rPMS (T4). Then, with fMRI, 25 Hz rPMS was compared to sham stimulation by utilizing a finger tapping activation paradigm. Changes in bloodoxygen level dependent (BOLD) contrast were examined at baseline (PRE), post rPMS (POST1) and 1 h post rPMS (POST2). With TMS facilitation was observed in the target muscle (FCR) following 25 Hz rPMS: MEP recruitment curves (RCs) were increased at T1, T2 and T3, and intracortical facilitation (ICF) was increased at T1 and T2. No effects were observed following 10 Hz rPMS. With fMRI the BOLD contrast at the left sensorimotor area was increased at POST1. Compared to inductions protocols based on transcutaneous electrical stimulation and mechanical stimulation, the rPMS induced effects appeared shorter lasting.
Keywords: TMS; afferent-induced facilitation; cortical plasticity; fMRI; motor cortex; peripheral magnetic stimulation.
Figures
References
-
- Andrews R. K., Schabrun S. M., Ridding M. C., Galea M. P., Hodges P. W., Chipchase L. S. (2013). The effect of electrical stimulation on corticospinal excitability is dependent on application duration: a same subject pre-post test design. J. Neuroeng. Rehabil. 10:51. 10.1186/1743-0003-10-51 - DOI - PMC - PubMed
-
- Barker A. T. (1999). The history and basic priciples of magnetic nerve stimulation. Electroencephalogr. Clin. Neurophysiol. Suppl. 51, 2–21. - PubMed
-
- Bischoff C., Riescher H., Machetanz J., Mayer B. U., Conrad B. (1995). Comparison of various coils used for magnetic stimulation of peripheral motor nerves: physiological considerations and consequences for diagnostic use. Electroencephalogr. Clin. Neurophysiol. 97, 332–340. 10.1016/0924-980x(95)00146-c - DOI - PubMed
LinkOut - more resources
Full Text Sources
Other Literature Sources