Subject-specific computational modeling of DBS in the PPTg area
- PMID: 26236229
- PMCID: PMC4500924
- DOI: 10.3389/fncom.2015.00093
Subject-specific computational modeling of DBS in the PPTg area
Abstract
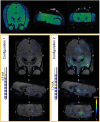
Deep brain stimulation (DBS) in the pedunculopontine tegmental nucleus (PPTg) has been proposed to alleviate medically intractable gait difficulties associated with Parkinson's disease. Clinical trials have shown somewhat variable outcomes, stemming in part from surgical targeting variability, modulating fiber pathways implicated in side effects, and a general lack of mechanistic understanding of DBS in this brain region. Subject-specific computational models of DBS are a promising tool to investigate the underlying therapy and side effects. In this study, a parkinsonian rhesus macaque was implanted unilaterally with an 8-contact DBS lead in the PPTg region. Fiber tracts adjacent to PPTg, including the oculomotor nerve, central tegmental tract, and superior cerebellar peduncle, were reconstructed from a combination of pre-implant 7T MRI, post-implant CT, and post-mortem histology. These structures were populated with axon models and coupled with a finite element model simulating the voltage distribution in the surrounding neural tissue during stimulation. This study introduces two empirical approaches to evaluate model parameters. First, incremental monopolar cathodic stimulation (20 Hz, 90 μs pulse width) was evaluated for each electrode, during which a right eyelid flutter was observed at the proximal four contacts (-1.0 to -1.4 mA). These current amplitudes followed closely with model predicted activation of the oculomotor nerve when assuming an anisotropic conduction medium. Second, PET imaging was collected OFF-DBS and twice during DBS (two different contacts), which supported the model predicted activation of the central tegmental tract and superior cerebellar peduncle. Together, subject-specific models provide a framework to more precisely predict pathways modulated by DBS.
Keywords: Parkinson's disease; deep brain stimulation; diffusion tensor; finite element; non-human primate; pedunculopontine nucleus.
Figures


Similar articles
-
Continuous stimulation of the pedunculopontine tegmental nucleus at 40 Hz affects preparative and executive control in a delayed sensorimotor task and reduces rotational movements induced by apomorphine in the 6-OHDA parkinsonian rat.Behav Brain Res. 2014 Sep 1;271:333-42. doi: 10.1016/j.bbr.2014.06.033. Epub 2014 Jun 21. Behav Brain Res. 2014. PMID: 24959863
-
Computational modeling of pedunculopontine nucleus deep brain stimulation.J Neural Eng. 2013 Aug;10(4):045005. doi: 10.1088/1741-2560/10/4/045005. Epub 2013 May 31. J Neural Eng. 2013. PMID: 23723145 Free PMC article.
-
Unilateral deep brain stimulation of the pedunculopontine tegmental nucleus in idiopathic Parkinson's disease: effects on gait initiation and performance.Gait Posture. 2014 Jul;40(3):357-62. doi: 10.1016/j.gaitpost.2014.05.002. Epub 2014 May 14. Gait Posture. 2014. PMID: 24908195
-
The pedunculopontine tegmental nucleus: implications for a role in modulating spinal cord motoneuron excitability.J Neural Transm (Vienna). 2011 Oct;118(10):1409-21. doi: 10.1007/s00702-010-0532-2. Epub 2010 Dec 16. J Neural Transm (Vienna). 2011. PMID: 21161714 Review.
-
Our first decade of experience in deep brain stimulation of the brainstem: elucidating the mechanism of action of stimulation of the ventrolateral pontine tegmentum.J Neural Transm (Vienna). 2016 Jul;123(7):751-767. doi: 10.1007/s00702-016-1518-5. Epub 2016 Feb 11. J Neural Transm (Vienna). 2016. PMID: 26865208 Review.
Cited by
-
Multi-objective particle swarm optimization for postoperative deep brain stimulation targeting of subthalamic nucleus pathways.J Neural Eng. 2018 Dec;15(6):066020. doi: 10.1088/1741-2552/aae12f. Epub 2018 Sep 13. J Neural Eng. 2018. PMID: 30211697 Free PMC article.
-
Particle swarm optimization for programming deep brain stimulation arrays.J Neural Eng. 2017 Feb;14(1):016014. doi: 10.1088/1741-2552/aa52d1. Epub 2017 Jan 9. J Neural Eng. 2017. PMID: 28068291 Free PMC article.
-
Non-human primate models of PD to test novel therapies.J Neural Transm (Vienna). 2018 Mar;125(3):291-324. doi: 10.1007/s00702-017-1722-y. Epub 2017 Apr 8. J Neural Transm (Vienna). 2018. PMID: 28391443 Review.
-
Model-Based Comparison of Deep Brain Stimulation Array Functionality with Varying Number of Radial Electrodes and Machine Learning Feature Sets.Front Comput Neurosci. 2016 Jun 10;10:58. doi: 10.3389/fncom.2016.00058. eCollection 2016. Front Comput Neurosci. 2016. PMID: 27375470 Free PMC article.
References
-
- Adriany G., Harel N., Yacoub E., Moeller S., Ghose G., Ugurbil K. (2010). A 21 channel transceiver array for non-human primate applications at 7 Tesla, in Proceedings of the 18th Annual Meeting of ISMRM (Stockholm: ).
-
- Barmpoutis A., Vemuri B. C. (2010). A unified framework for estimating diffusion tensors of any order with symmetric positive-definite constraints, in Proceedings/IEEE International Symposium on Biomedical Imaging: From Nano to Macro (Rotterdam: ), 1385–1388. 10.1109/isbi.2010.5490256 - DOI - PMC - PubMed
Grants and funding
LinkOut - more resources
Full Text Sources
Other Literature Sources

