

Characterization of pH dependent Mn(II) oxidation strategies and formation of a bixbyite-like phase by Mesorhizobium australicum T-G1
- PMID: 26236307
- PMCID: PMC4505141
- DOI: 10.3389/fmicb.2015.00734
Characterization of pH dependent Mn(II) oxidation strategies and formation of a bixbyite-like phase by Mesorhizobium australicum T-G1
Abstract
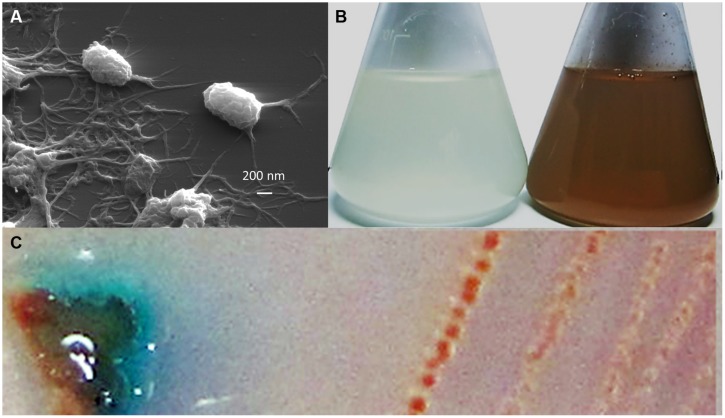
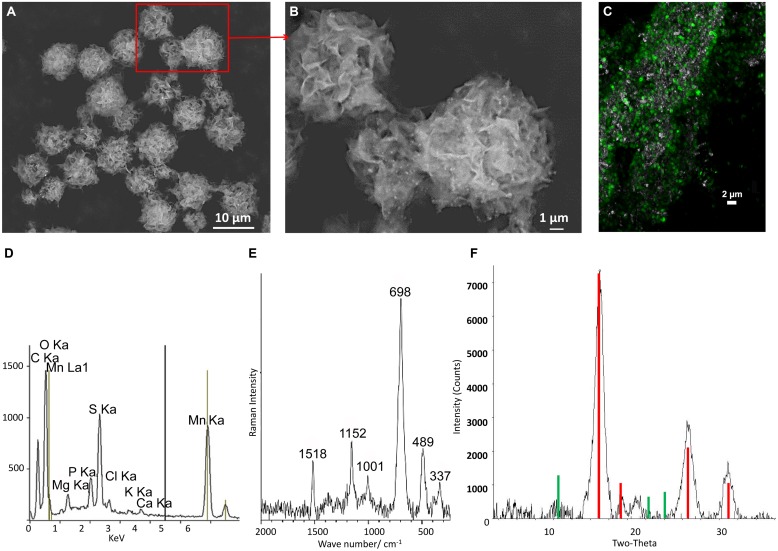
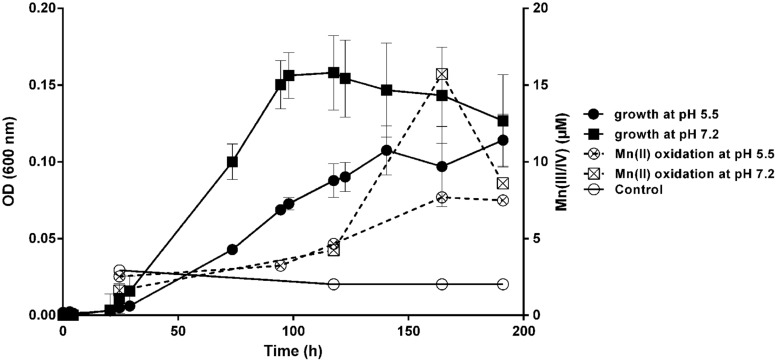
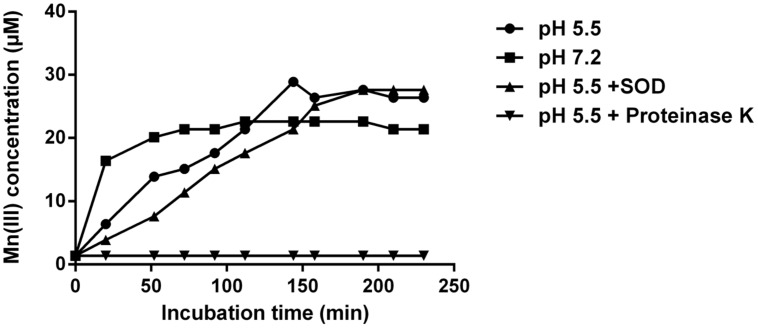
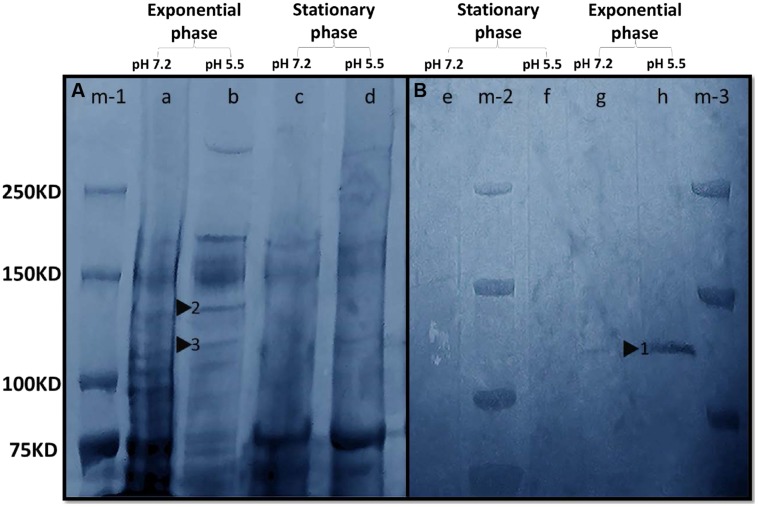
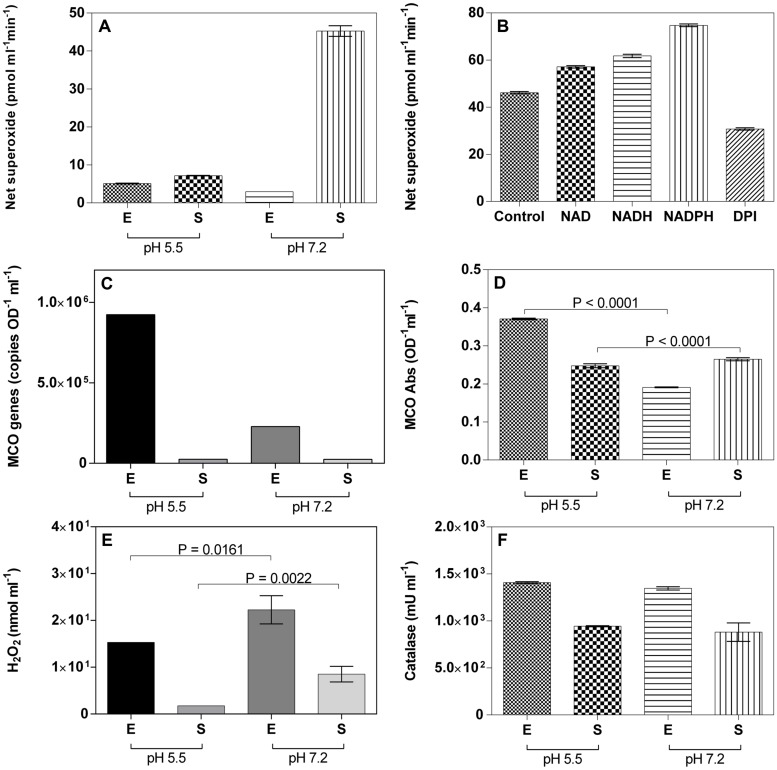
Despite the ubiquity of Mn oxides in natural environments, there are only a few observations of biological Mn(II) oxidation at pH < 6. The lack of low pH Mn-oxidizing bacteria (MOB) isolates limits our understanding of how pH influences biological Mn(II) oxidation in extreme environments. Here, we report that a novel MOB isolate, Mesorhizobium australicum strain T-G1, isolated from an acidic and metalliferous uranium mining area, can oxidize Mn(II) at both acidic and neutral pH using different enzymatic pathways. X-ray diffraction, Raman spectroscopy, and scanning electron microscopy with energy dispersive X-ray spectroscopy revealed that T-G1 initiated bixbyite-like Mn oxide formation at pH 5.5 which coincided with multi-copper oxidase expression from early exponential phase to late stationary phase. In contrast, reactive oxygen species (ROS), particularly superoxide, appeared to be more important for T-G1 mediated Mn(II) oxidation at neutral pH. ROS was produced in parallel with the occurrence of Mn(II) oxidation at pH 7.2 from early stationary phase. Solid phase Mn oxides did not precipitate, which is consistent with the presence of a high amount of H2O2 and lower activity of catalase in the liquid culture at pH 7.2. Our results show that M. australicum T-G1, an acid tolerant MOB, can initiate Mn(II) oxidation by varying its oxidation mechanisms depending on the pH and may play an important role in low pH manganese biogeochemical cycling.
Keywords: Mn(II) oxidation; catalase; low pH; multi-copper oxidase; reactive oxygen species.
Figures
Similar articles
-
Biological Low-pH Mn(II) Oxidation in a Manganese Deposit Influenced by Metal-Rich Groundwater.Appl Environ Microbiol. 2016 May 2;82(10):3009-3021. doi: 10.1128/AEM.03844-15. Print 2016 May 15. Appl Environ Microbiol. 2016. PMID: 26969702 Free PMC article.
-
Identification of Mn(II)-oxidizing bacteria from a low-pH contaminated former uranium mine.Appl Environ Microbiol. 2014 Aug;80(16):5086-97. doi: 10.1128/AEM.01296-14. Epub 2014 Jun 13. Appl Environ Microbiol. 2014. PMID: 24928873 Free PMC article.
-
Ligand-Assisted Formation of Soluble Mn(III) and Bixbyite-like Mn2O3 by Shewanella putrefaciens CN32.Environ Sci Technol. 2022 Mar 15;56(6):3812-3820. doi: 10.1021/acs.est.2c00342. Epub 2022 Feb 28. Environ Sci Technol. 2022. PMID: 35226466
-
Bacteriogenic manganese oxides.Acc Chem Res. 2010 Jan 19;43(1):2-9. doi: 10.1021/ar800232a. Acc Chem Res. 2010. PMID: 19778036 Review.
-
Geomicrobiology of manganese(II) oxidation.Trends Microbiol. 2005 Sep;13(9):421-8. doi: 10.1016/j.tim.2005.07.009. Trends Microbiol. 2005. PMID: 16054815 Review.
Cited by
-
Epidermal microorganisms contributed to the toxic mechanism of nZVI and TCEP in earthworms by robbing metal elements and nutrients.Eco Environ Health. 2023 Nov 29;3(1):80-88. doi: 10.1016/j.eehl.2023.11.001. eCollection 2024 Mar. Eco Environ Health. 2023. PMID: 38323088 Free PMC article.
-
Manganese Stress Adaptation Mechanisms of Bacillus safensis Strain ST7 From Mine Soil.Front Microbiol. 2021 Nov 25;12:758889. doi: 10.3389/fmicb.2021.758889. eCollection 2021. Front Microbiol. 2021. PMID: 34899642 Free PMC article.
-
Microbiomes in a manganese oxide producing ecosystem in the Ytterby mine, Sweden: impact on metal mobility.FEMS Microbiol Ecol. 2020 Oct 28;96(11):fiaa169. doi: 10.1093/femsec/fiaa169. FEMS Microbiol Ecol. 2020. PMID: 32815988 Free PMC article.
-
Ripening of bananas using Bowdichia virgilioides Kunth leaves.Sci Rep. 2019 Mar 5;9(1):3548. doi: 10.1038/s41598-019-40053-3. Sci Rep. 2019. PMID: 30837590 Free PMC article.
-
Mineralogical and Genomic Constraints on the Origin of Microbial Mn Oxide Formation in Complexed Microbial Community at the Terrestrial Hot Spring.Life (Basel). 2022 May 30;12(6):816. doi: 10.3390/life12060816. Life (Basel). 2022. PMID: 35743847 Free PMC article.
References
-
- Anderson C. R., Johnson H. A., Caputo N., Davis R. E., Torpey J. W., Tebo B. M. (2009). Mn(II) oxidation is catalyzed by heme peroxidases in “Aurantimonas manganoxydans” strain SI85-9A1 and Erythrobacter sp. strain SD-21. Appl. Environ. Microbiol. 75 4130–4138. 10.1128/AEM.02890-08 - DOI - PMC - PubMed
-
- Baldi M., Escribano V. S., Amores J. M. G., Milella F., Busca G. (1998). Characterization of manganese and iron oxides as combustion catalysts for propane and propene. Appl. Catal. B Environ. 17 175–182. 10.1016/S0926-3373(98)00013-7 - DOI
LinkOut - more resources
Full Text Sources
Other Literature Sources
Molecular Biology Databases