

Synergy Maps: exploring compound combinations using network-based visualization
- PMID: 26236402
- PMCID: PMC4521339
- DOI: 10.1186/s13321-015-0090-6
Synergy Maps: exploring compound combinations using network-based visualization
Abstract
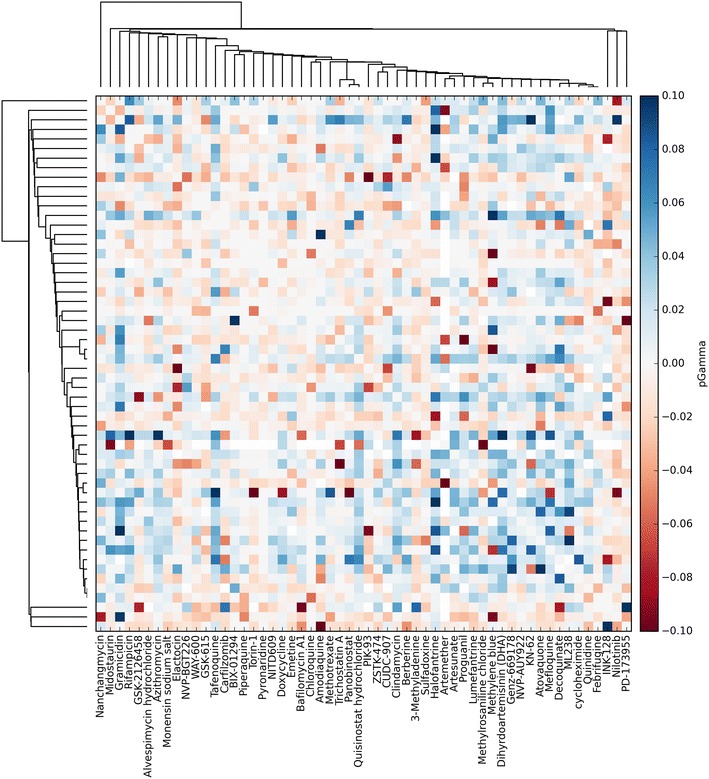
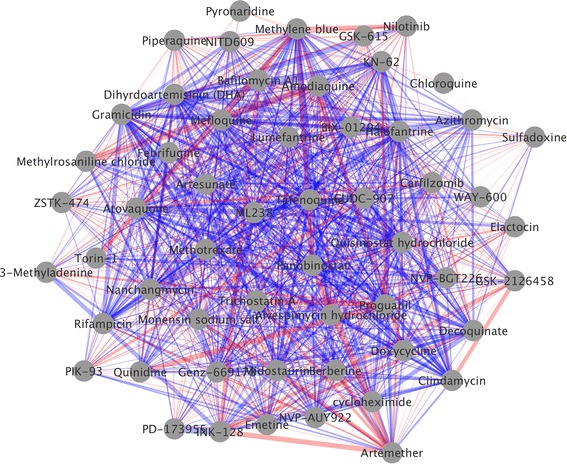
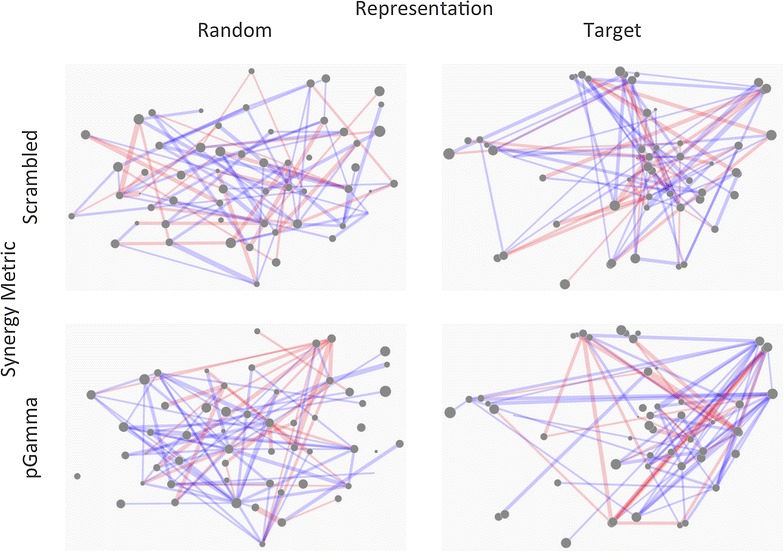
Background: The phenomenon of super-additivity of biological response to compounds applied jointly, termed synergy, has the potential to provide many therapeutic benefits. Therefore, high throughput screening of compound combinations has recently received a great deal of attention. Large compound libraries and the feasibility of all-pairs screening can easily generate large, information-rich datasets. Previously, these datasets have been visualized using either a heat-map or a network approach-however these visualizations only partially represent the information encoded in the dataset.
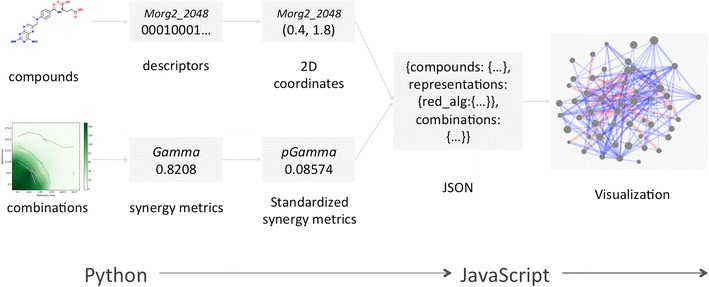
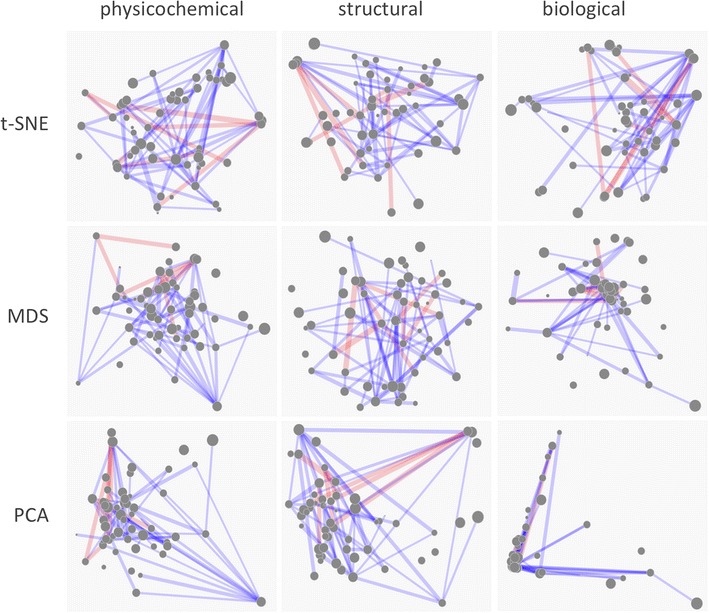
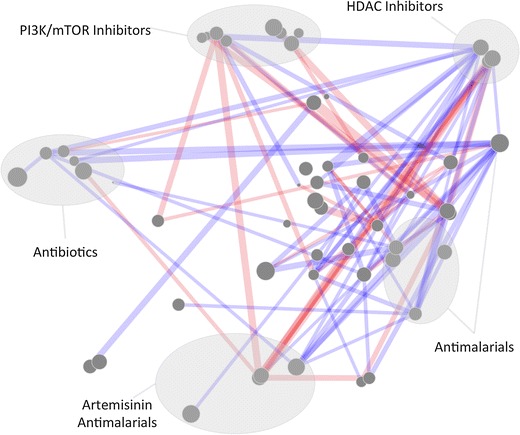
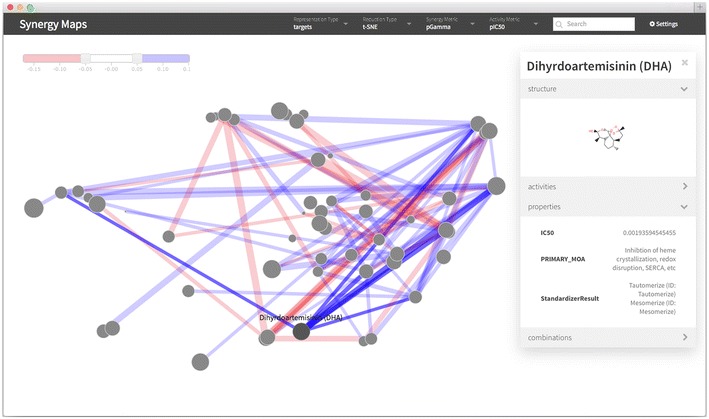
Results: A new visualization technique for pairwise combination screening data, termed "Synergy Maps", is presented. In a Synergy Map, information about the synergistic interactions of compounds is integrated with information about their properties (chemical structure, physicochemical properties, bioactivity profiles) to produce a single visualization. As a result the relationships between compound and combination properties may be investigated simultaneously, and thus may afford insight into the synergy observed in the screen. An interactive web app implementation, available at http://richlewis42.github.io/synergy-maps, has been developed for public use, which may find use in navigating and filtering larger scale combination datasets. This tool is applied to a recent all-pairs dataset of anti-malarials, tested against Plasmodium falciparum, and a preliminary analysis is given as an example, illustrating the disproportionate synergism of histone deacetylase inhibitors previously described in literature, as well as suggesting new hypotheses for future investigation.
Conclusions: Synergy Maps improve the state of the art in compound combination visualization, by simultaneously representing individual compound properties and their interactions. The web-based tool allows straightforward exploration of combination data, and easier identification of correlations between compound properties and interactions.
Keywords: Compound combinations; Dimensionality reduction; Mixtures; Network; Synergy; Visualization.
Figures

Similar articles
-
A systematic and prospectively validated approach for identifying synergistic drug combinations against malaria.Malar J. 2018 Apr 11;17(1):160. doi: 10.1186/s12936-018-2294-5. Malar J. 2018. PMID: 29642892 Free PMC article.
-
Statistical assessment and visualization of synergies for large-scale sparse drug combination datasets.BMC Bioinformatics. 2019 Feb 18;20(1):83. doi: 10.1186/s12859-019-2642-7. BMC Bioinformatics. 2019. PMID: 30777010 Free PMC article.
-
Using Machine Learning to Predict Synergistic Antimalarial Compound Combinations With Novel Structures.Front Pharmacol. 2018 Oct 2;9:1096. doi: 10.3389/fphar.2018.01096. eCollection 2018. Front Pharmacol. 2018. PMID: 30333748 Free PMC article.
-
Cheminformatics approaches to analyze diversity in compound screening libraries.Curr Opin Chem Biol. 2010 Jun;14(3):325-30. doi: 10.1016/j.cbpa.2010.03.017. Epub 2010 Apr 22. Curr Opin Chem Biol. 2010. PMID: 20457001 Review.
-
Critical analysis of literature on low-dose synergy for use in screening chemical mixtures for risk assessment.Crit Rev Toxicol. 2011 May;41(5):369-83. doi: 10.3109/10408444.2010.543655. Epub 2011 Feb 10. Crit Rev Toxicol. 2011. PMID: 21309635 Review.
Cited by
-
Finding Constellations in Chemical Space Through Core Analysis.Front Chem. 2019 Jul 16;7:510. doi: 10.3389/fchem.2019.00510. eCollection 2019. Front Chem. 2019. PMID: 31380353 Free PMC article.
-
A systematic and prospectively validated approach for identifying synergistic drug combinations against malaria.Malar J. 2018 Apr 11;17(1):160. doi: 10.1186/s12936-018-2294-5. Malar J. 2018. PMID: 29642892 Free PMC article.
-
Multiomic Big Data Analysis Challenges: Increasing Confidence in the Interpretation of Artificial Intelligence Assessments.Anal Chem. 2021 Jun 8;93(22):7763-7773. doi: 10.1021/acs.analchem.0c04850. Epub 2021 May 24. Anal Chem. 2021. PMID: 34029068 Free PMC article.
-
Commercial Essential Oils as Potential Antimicrobials to Treat Skin Diseases.Evid Based Complement Alternat Med. 2017;2017:4517971. doi: 10.1155/2017/4517971. Epub 2017 May 4. Evid Based Complement Alternat Med. 2017. PMID: 28546822 Free PMC article. Review.
-
Web-based 3D-visualization of the DrugBank chemical space.J Cheminform. 2016 May 4;8:25. doi: 10.1186/s13321-016-0138-2. eCollection 2016. J Cheminform. 2016. PMID: 27148409 Free PMC article.
References
-
- Berenbaum MC. What is synergy? Pharmacol Rev. 1989;41:93–141. - PubMed
LinkOut - more resources
Full Text Sources
Other Literature Sources
Research Materials
