. 2015 Jul 6;12(108):20150391.
doi: 10.1098/rsif.2015.0391.

A dimensionless ordered pull-through model of the mammalian lens epithelium evidences scaling across species and explains the age-dependent changes in cell density in the human lens

A dimensionless ordered pull-through model of the mammalian lens epithelium evidences scaling across species and explains the age-dependent changes in cell density in the human lens

Jun Jie Wu et al. J R Soc Interface. .

Abstract

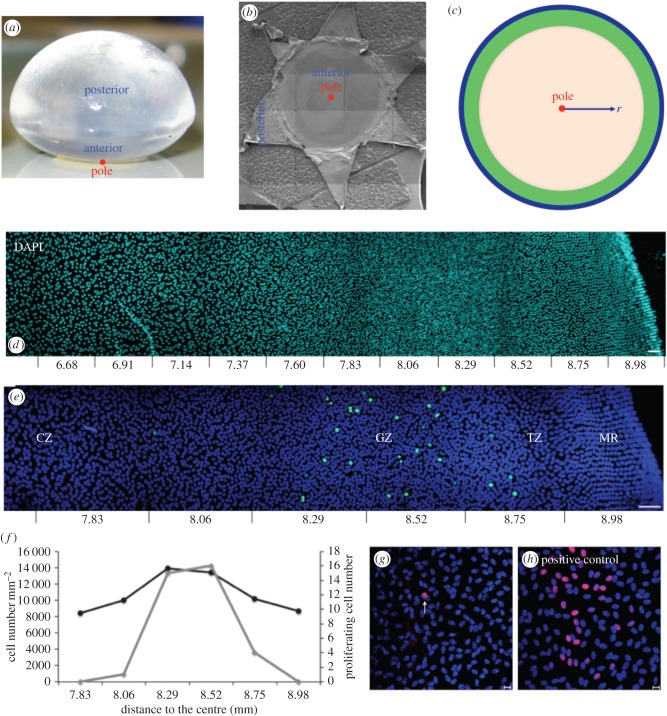
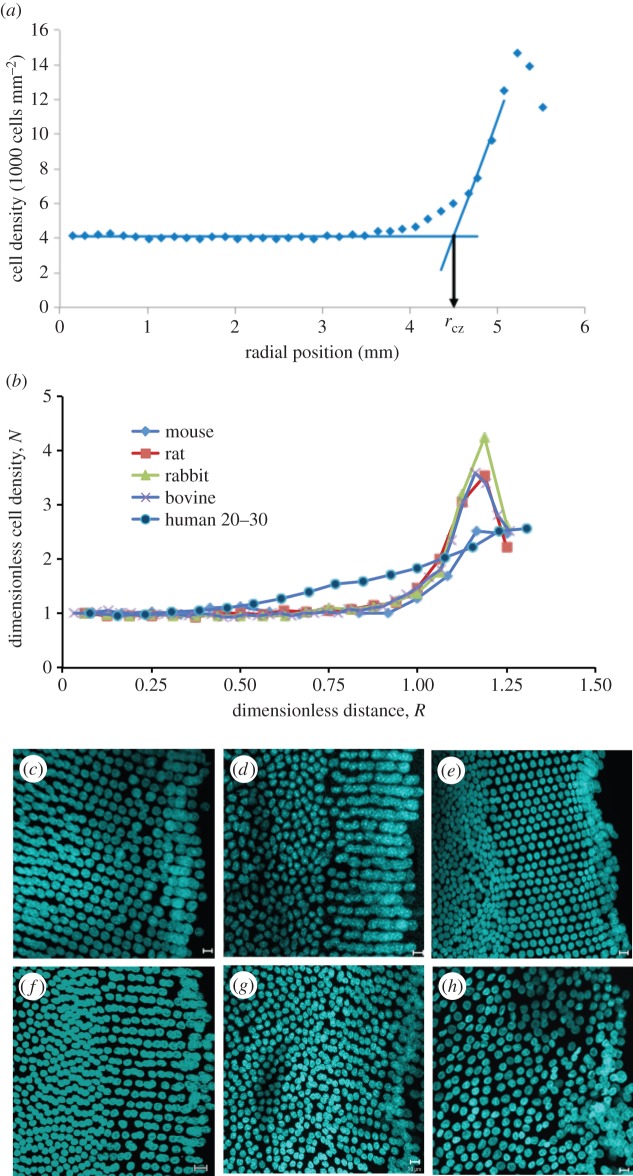
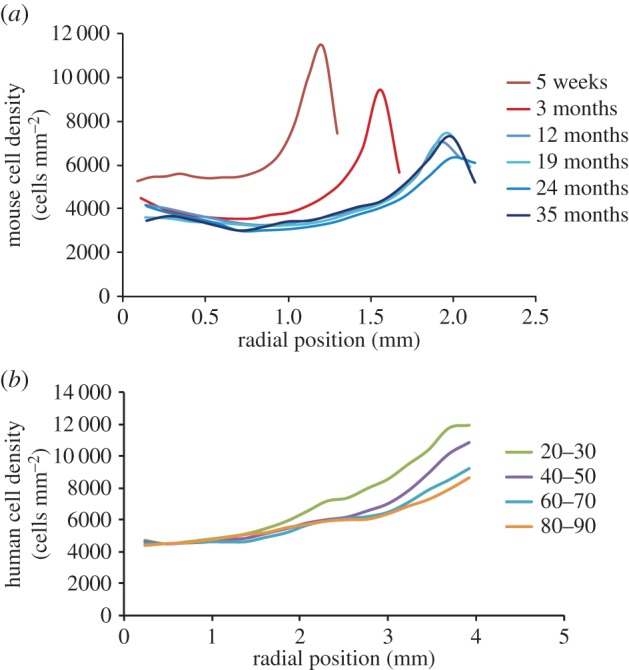
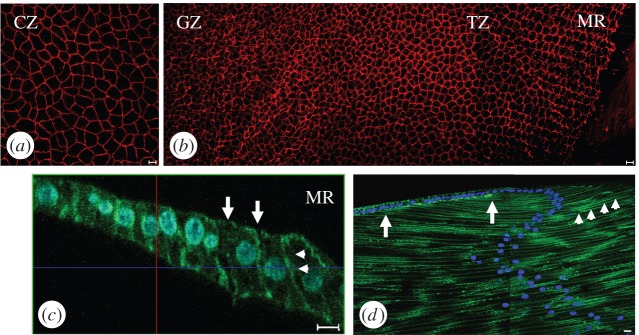
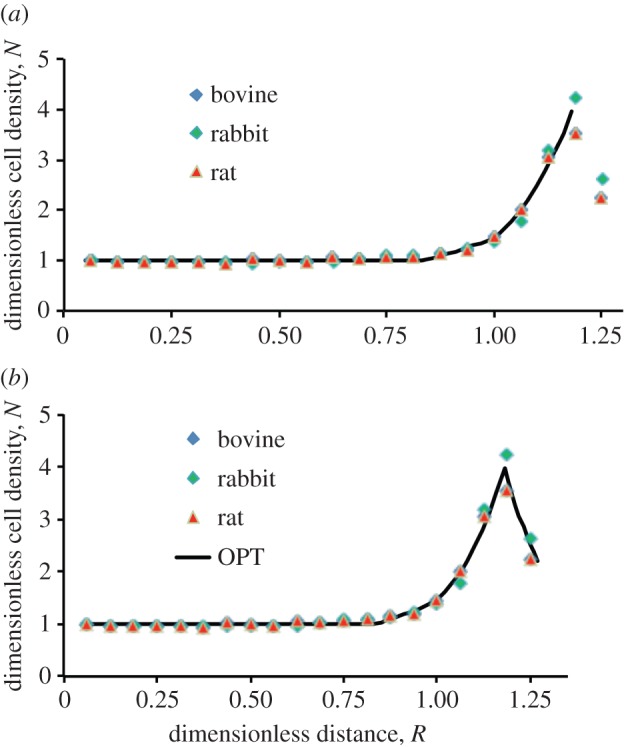
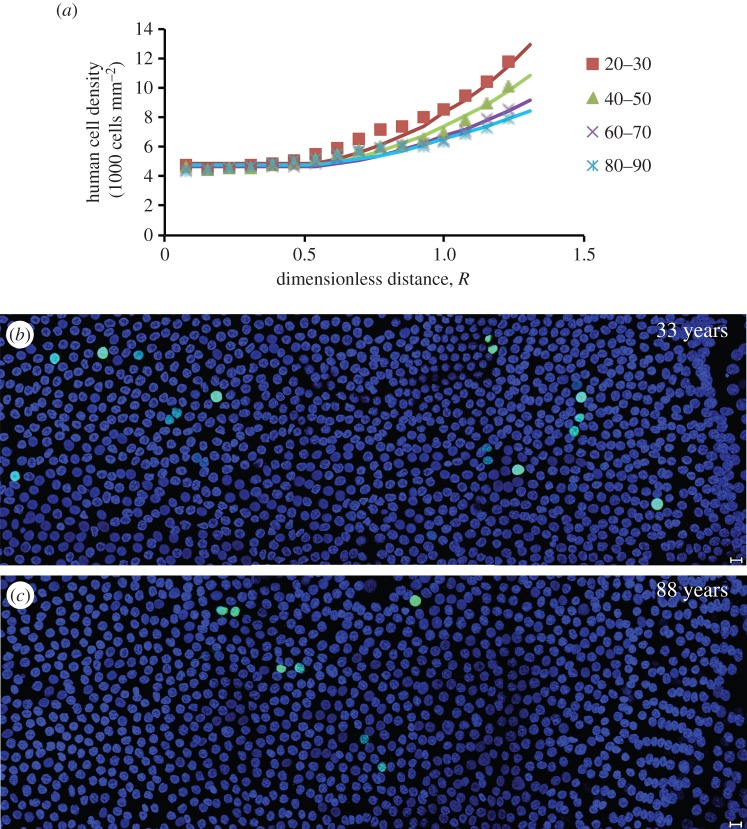
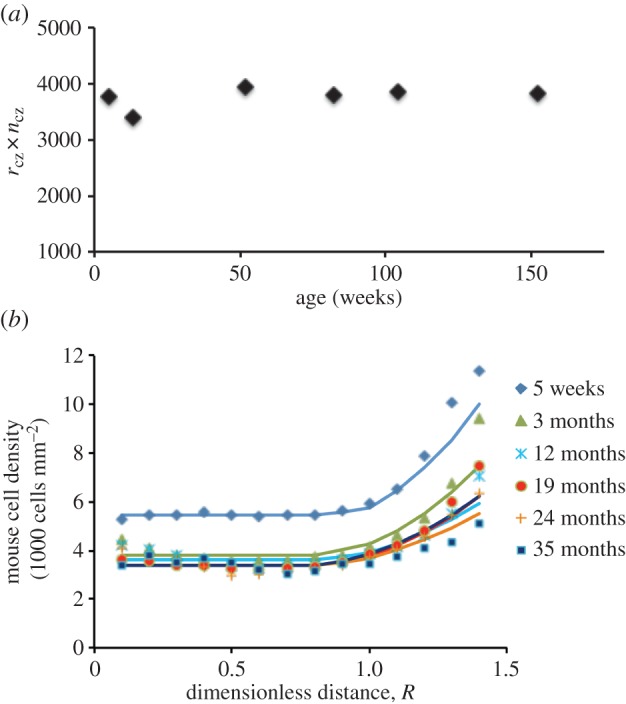
We present a mathematical (ordered pull-through; OPT) model of the cell-density profile for the mammalian lens epithelium together with new experimental data. The model is based upon dimensionless parameters, an important criterion for inter-species comparisons where lens sizes can vary greatly (e.g. bovine (approx. 18 mm); mouse (approx. 2 mm)) and confirms that mammalian lenses scale with size. The validated model includes two parameters: β/α, which is the ratio of the proliferation rate in the peripheral and in the central region of the lens; and γ(GZ), a dimensionless pull-through parameter that accounts for the cell transition and exit from the epithelium into the lens body. Best-fit values were determined for mouse, rat, rabbit, bovine and human lens epithelia. The OPT model accounts for the peak in cell density at the periphery of the lens epithelium, a region where cell proliferation is concentrated and reaches a maximum coincident with the germinative zone. The β/α ratio correlates with the measured FGF-2 gradient, a morphogen critical to lens cell survival, proliferation and differentiation. As proliferation declines with age, the OPT model predicted age-dependent changes in cell-density profiles, which we observed in mouse and human lenses.


Figures

Figure 1.
Figure 1.
Relationship of lens morphology to its epithelium and the schematic of the mathematical model. Biological images showing cell-density variation. (a) Bovine lens showing its anterior and posterior surfaces and the location of the anterior pole (red circle). (b) Dissected and flat-mounted lens capsule. The anterior pole (red circle) is indicated. (c) Schematic of the mathematical model indicating the pole (red circle) and, for orientation purposes, the different zones; CZ (beige); GZ (green) and TZ/MR (blue). The origin of radial distance r from the anterior pole is indicated. (d) A montage of images taken from a flat-mounted bovine lens epithelium stained with DAPI to identify cell nuclei. The montage illustrates the cell-density changes in the lens periphery (equator). Distance (mm) from the anterior pole is indicated. Scale bar, 50 μm. (e) Flat-mounted bovine lens epithelium stained with the cell proliferation marker Ki-67 (green channel) and DAPI (blue channel). The zone with the most Ki-67 labelling is defined in the literature as the GZ, which is in the lens periphery. The MR is the most peripheral feature of the lens epithelium. The TZ is between the MR and GZ. Distance (mm) from the anterior pole is indicated. Scale bar, 50 μm. (f) Cell density (black line) and Ki-67 labelling (grey line) from (c) were counted confirming that most Ki-67 labelling coincided with the highest cell density in the lens epithelium. (g) TUNEL staining of the bovine lens epithelium (red channel) and counter-stained with DAPI (blue channel). TUNEL-positive cells are rarely observed. One example of a TUNEL-positive cell is shown (white arrow). Scale bar, 10 μm. (h) A flat-mounted epithelium was exposed to Benzonase Nuclease (100 U ml−1) as a positive control to introduce more DNA strand breaks prior to TUNEL staining. Scale bar, 10 μm.
Figure 2.
Figure 2.
Dimensionless analysis of the spatial variation of cell density in the lens epithelium of various mammals and differences in the organization of the meridional rows (MR). (a) Illustration of method used to determine rcz, the distance from the pole to the beginning of GZ. (b) Variation of normalized epithelial cell density, N, with dimensionless distance, R, from the lens anterior pole. Trend lines are included for visualization purposes. (c–h) Species and age-related differences in the organization of the MR. Examples of flat-mounted lens epithelia from bovine (c), mouse (d), rat (e), rabbit (f), a 22-year-old human (g) and a 88-year-old human (h) stained with DAPI. In all cases, the MR of the lens epithelium is very apparent, but the human is the least well organized. Scale bars, 10 μm.
Figure 3.
Figure 3.
Variation of measured cell density with age in the lens epithelium of mammals. (a) Line plots for mouse lenses of different ages. (b) Line plots for human lenses of different ages.
Figure 4.
Figure 4.
Cell shape and cell organizational changes across the bovine lens epithelium. (a,b) Cell profiles in CZ, GZ, TZ and MR of the flat-mounted bovine lens epithelium. Using the apical plasma membrane marker ZO-1 (red channel), the cells in the CZ (a) have the largest surface area (see electronic supplementary material, figure S1a). At the MR (b), the lens cells aligned into columns. Cells in the MRs have a hexagonal profile. Each column in the MR is offset by half a cell width to allow the interdigitation of neighbouring columns. (c) Actin staining in the TZ/MR is located mainly on the lateral (arrowheads) and apical (arrows) cell membrane in these elongated cells. Cell nuclei have been DAPI stained (blue channel) locate toward the apical ends of the lens cells. (d) N-cadherin (green channel) is concentrated along the lateral plasma membranes of lens fibre cells (arrows). It is also concentrated at the interface between the apical ends of epithelial cells in the TZ/MR and the most recently formed fibre cell (arrowheads). The concentration of N-cadherin between the two arrows at the interface between the apical ends of apposed epithelial and fibre cells identifies a region, which we interpret as the lens modiolus and fulcrum.
Figure 5.
Figure 5.
Comparison of the ordered pull-through model with the experimentally measured data. (a) Comparison of the model for lens epithelium (solid line) with the experimentally measured data (symbols). (b) Comparison of the ordered pull-through model for lens epithelium with experimental data obtained for flat-mounted bovine, rabbit and rat lenses.
Figure 6.
Figure 6.
Modelling of the ageing of the human lens. (a) The model tracks the evolution of the human cell-density profile as measured in lenses of different ages. (b,c) The age-dependent decline in human lens epithelial cell proliferation. Representative images from flat-mounted human lens epithelia probed with the cell proliferation marker, Ki-67 (green channel) and DAPI (blue channel). Note that the 33-year-old lens (b) has more proliferating cells than the 88-year-old lens (c). In both cases, the GZ and MR are located on the right of the image. Scale bars, 10 μm.
Figure 7.
Figure 7.
Modelling of the ageing of the mouse lens. (a) The product of rcz and ncz (i.e. rcz × ncz) is a constant. (b) Validation of the OPT model using mouse data.

References

    1. Land MF. 2012. The evolution of lenses. Ophthalmic Physiol. Opt. 32, 449–460. (10.1111/j.1475-1313.2012.00941.x) - DOI - PubMed
    1. Augusteyn RC. 2014. Growth of the eye lens: I. Weight accumulation in multiple species. Mol. Vis. 20, 410–426. - PMC - PubMed
    1. Song S, Landsbury A, Dahm R, Liu Y, Zhang Q, Quinlan RA. 2009. Functions of the intermediate filament cytoskeleton in the eye lens. J. Clin. Invest. 119, 1837–1848. (10.1172/JCI38277) - DOI - PMC - PubMed
    1. Shi Y, De Maria A, Lubura S, Sikic H, Bassnett S. 2015. The penny pusher: a cellular model of lens growth. Invest. Ophthalmol. Vis. Sci. 56, 799–809. (10.1167/iovs.14-16028) - DOI - PMC - PubMed
    1. Rakic JM, Galand A, Vrensen GF. 1997. Separation of fibres from the capsule enhances mitotic activity of human lens epithelium. Exp. Eye. Res. 64, 67–72. (10.1006/exer.1996.0179) - DOI - PubMed

Publication types

MeSH terms