. 2015 Sep;21(9):998-1009.
doi: 10.1038/nm.3902. Epub 2015 Aug 3.

Epithelial-to-mesenchymal transition induces cell cycle arrest and parenchymal damage in renal fibrosis

Affiliations

Epithelial-to-mesenchymal transition induces cell cycle arrest and parenchymal damage in renal fibrosis

Sara Lovisa et al. Nat Med. 2015 Sep.

Abstract

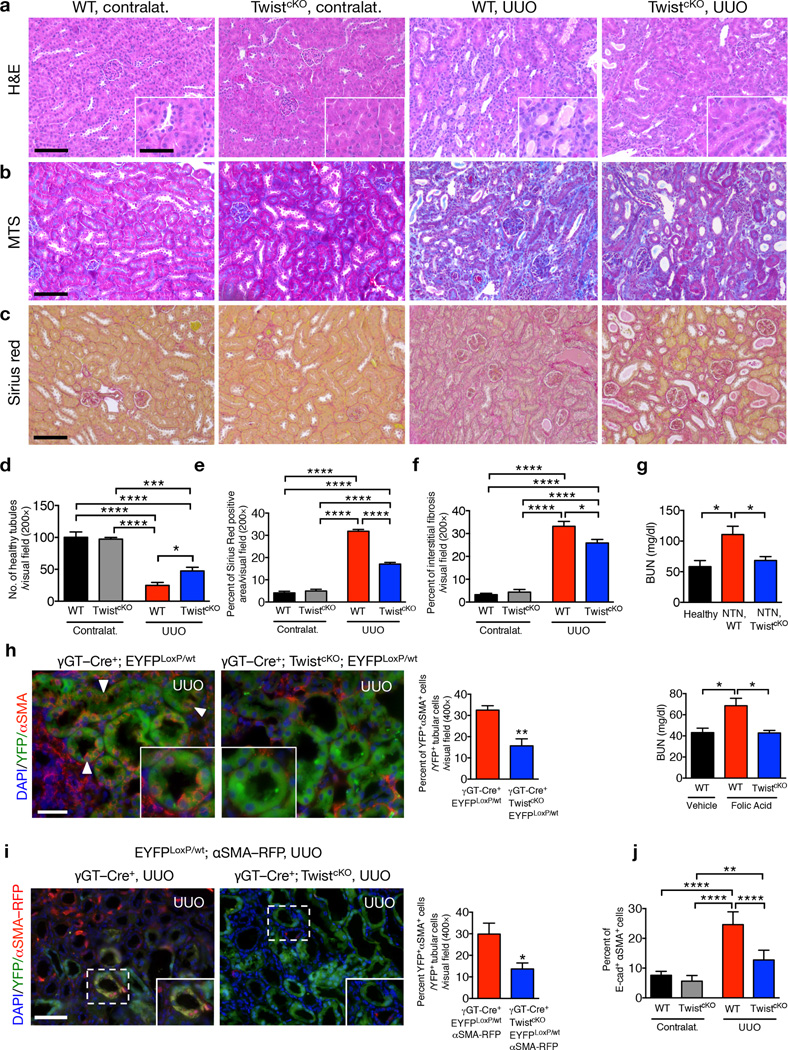
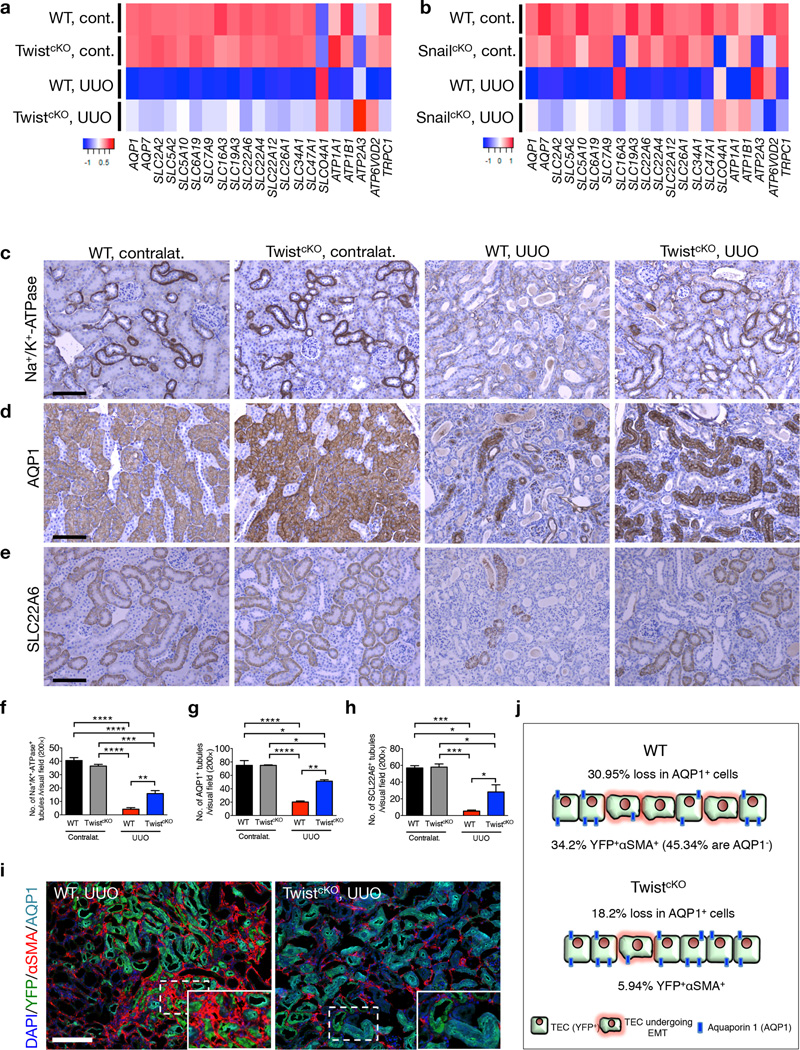
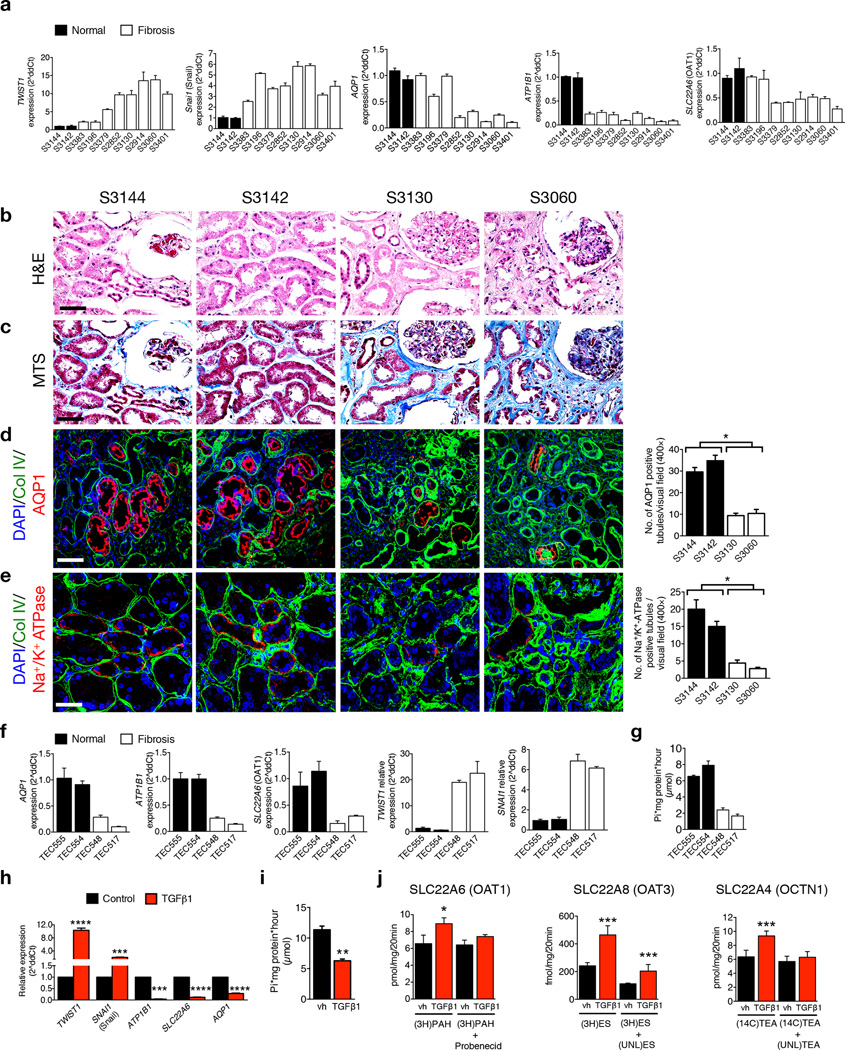
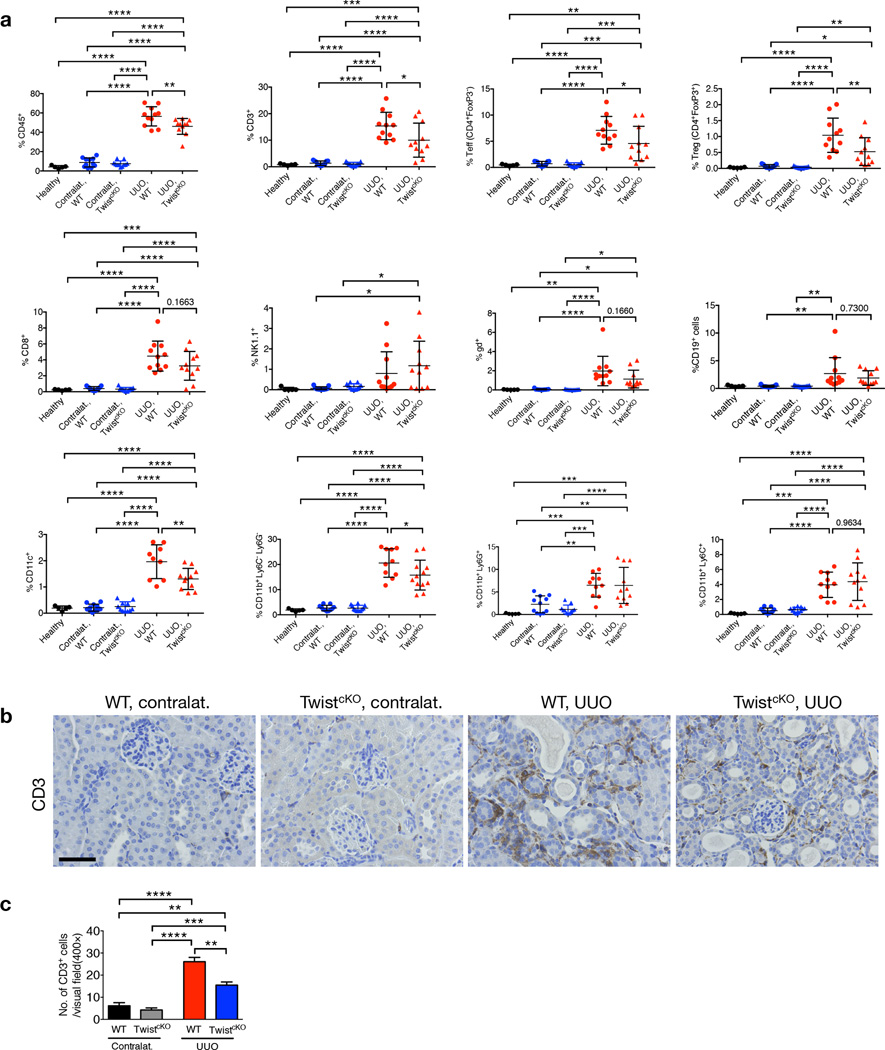
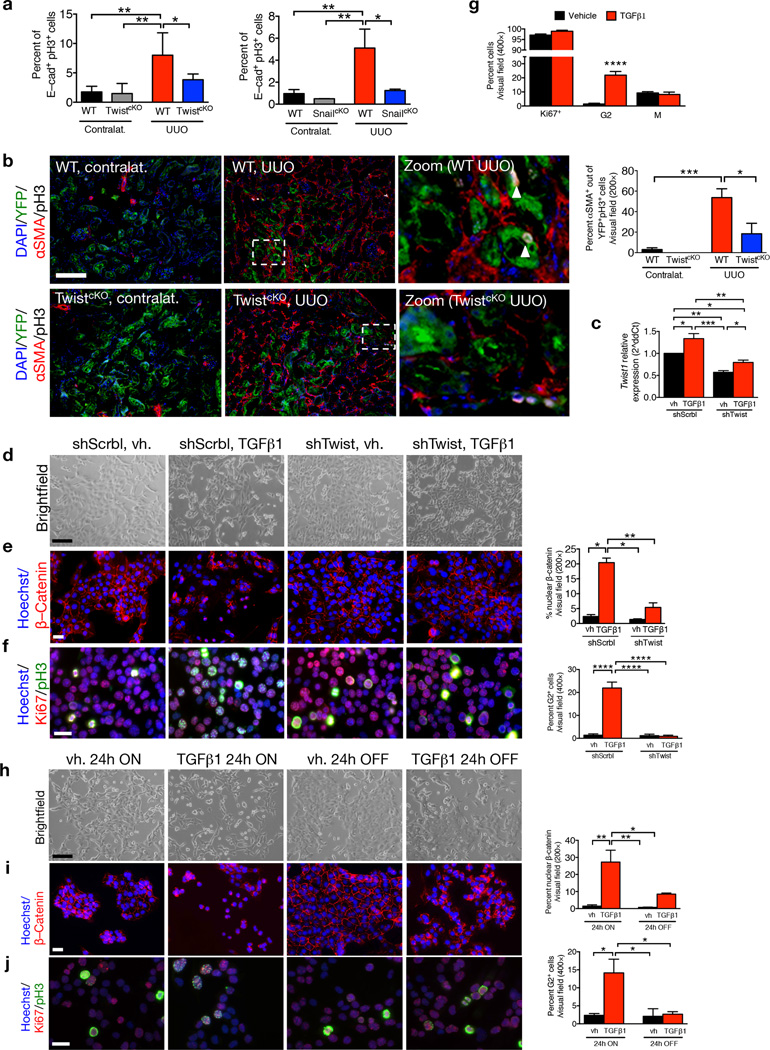
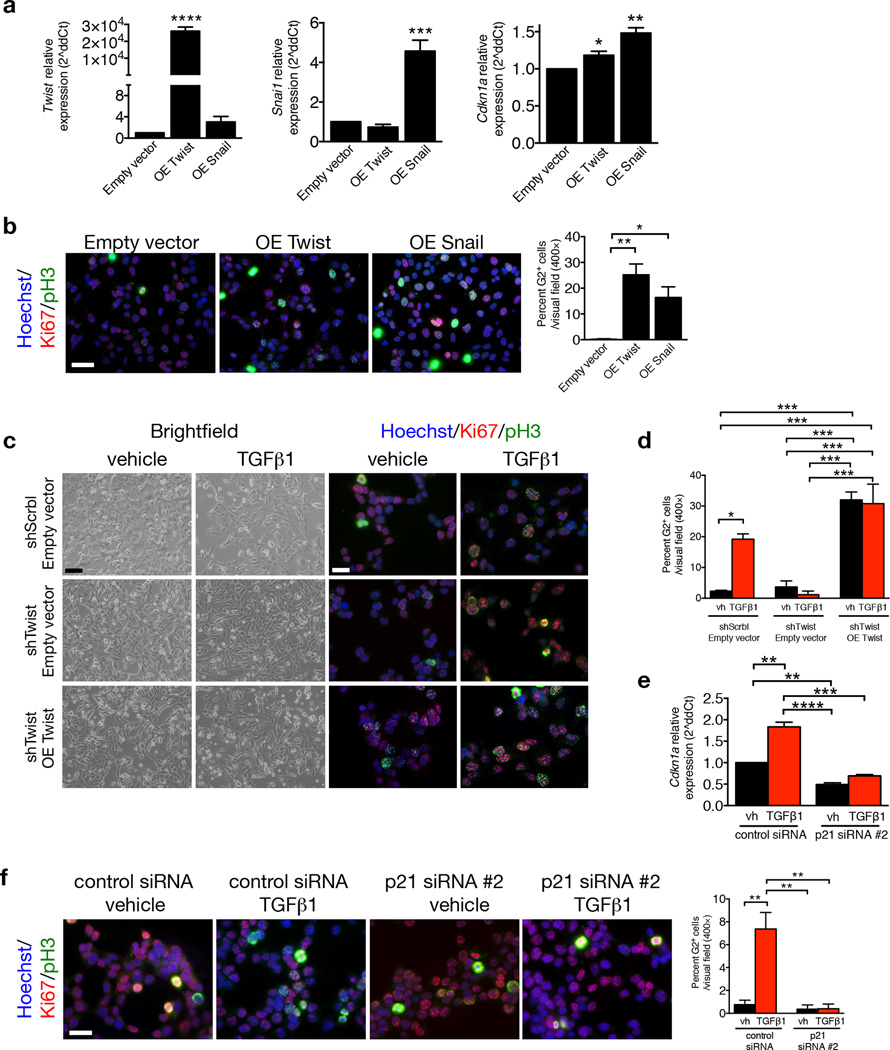
Kidney fibrosis is marked by an epithelial-to-mesenchymal transition (EMT) of tubular epithelial cells (TECs). Here we find that, during renal fibrosis, TECs acquire a partial EMT program during which they remain associated with their basement membrane and express markers of both epithelial and mesenchymal cells. The functional consequence of the EMT program during fibrotic injury is an arrest in the G2 phase of the cell cycle and lower expression of several solute and solvent transporters in TECs. We also found that transgenic expression of either Twist1 (encoding twist family bHLH transcription factor 1, known as Twist) or Snai1 (encoding snail family zinc finger 1, known as Snail) expression is sufficient to promote prolonged TGF-β1-induced G2 arrest of TECs, limiting the cells' potential for repair and regeneration. In mouse models of experimentally induced renal fibrosis, conditional deletion of Twist1 or Snai1 in proximal TECs resulted in inhibition of the EMT program and the maintenance of TEC integrity, while also restoring cell proliferation, dedifferentiation-associated repair and regeneration of the kidney parenchyma and attenuating interstitial fibrosis. Thus, inhibition of the EMT program in TECs during chronic renal injury represents a potential anti-fibrosis therapy.


Figures

Figure 1
Figure 1
Genetic targeting of EMT reduces renal fibrosis and improves tubular health. (a–c) Representative images (8 visual fields for each tissue analyzed) of H&E (a), MTS (b) and Sirius Red (c) staining of kidneys from the indicated experimental groups. Scale bar, 100 ~m; insert, 25 ~m. (d) Number of healthy tubules. WT contralat., n = 4; TwistcKO contralat., n = 3; WT UUO, n = 9; TwistcKO UUO, n = 9. (e–f) Interstitial fibrosis, based on MTS (e) and Sirius Red (f) staining. WT contralat., n = 4; TwistcKO contralat., n = 4; WT UUO, n = 9; TwistcKO UUO, n = 9. (g) Blood urea nitrogen (BUN) levels. Healthy, n = 3; WT NTN, n = 7; TwistcKO NTN; n = 7. WT vehicle, n = 4; WT FA, n = 4; TwistcKO FA, n = 4. (h) Representative images (8 visual fields for each tissue analyzed) of immunolabeling for αSMA and YFP (left) and quantification of the percent YFP+αSMA+ cells per total number of YFP+ tubular epithelial cells (right). WT UUO, n = 3; TwistcKO UUO, n = 4. Scale bar, 20 ~m. White arrowheads, YFP+/αSMA+ cells. (i) Representative images (3 visual fields for each tissue analyzed) of YFP+ proximal tubules and αSMA–RFP+ myofibroblasts in UUO-treated mice (left) and quantification of the percent of YFP+RFP+ cells (right). γGT–Cre; LSL–EYFPLoxP/+; αSMA–RFP, n = 3; γGT–Cre; LSL–EYFPLoxP/+; αSMA–RFP; TwistcKO, n = 4. Scale bar, 20 ~m. (j) Percent E–cadherin+αSMA+ cells (as measured by flow cytometry) in the indicated experimental groups (n = 5). Data is represented as mean ± SEM. One–way ANOVA with Tukey post–hoc analysis. h and i, unpaired two–tailed t–test. *P < 0.05, **P < 0.01, ***P < 0.001, ****P < 0.0001. Contralat.: contralateral kidney.
Figure 2
Figure 2
Inhibition of EMT prevents loss of TEC associated solute and solvent transporters. (a–b) Heatmaps representing averaged intensity of expression of genes associated with TEC function in kidneys of the indicated TwistcKO (a) and SnailcKO (b) experimental groups. WT cont., n = 3 ; TwistcKO cont., n = 3; WT UUO, n = 3; TwistcKO UUO, n = 4. WT cont., n = 3 ; SnailcKO cont., n = 3; WT UUO, n = 3; SnailcKO UUO, n = 3. (c–e) Representative images (8 visual fields for each tissue analyzed) of immunolabeling for Na+/K+ ATPase (c), AQP1 (d), and SLC22A6 (e) in the indicated experimental groups. Scale bar, 100 ~m. (f–h) Number of Na+/K+ ATPase+ (f), AQP1+ (g), and SLC22A6+ (h) tubules per visual field (200×). WT contralat., n = 3 ; TwistcKO contralat., n = 3; WT UUO, n = 3; TwistcKO UUO, n = 3. (i) Representative images (4 visual fields for each tissue analyzed) of immunolabeling for YFP, AQP1 and αSMA in WT UUO and TwistcKO UUO. (j) Schematic representation of the relative changes percentages of AQP1 and αSMA in YFP+ tubular epithelial cells, in kidneys from WT and TwistcKO UUO mice. WT UUO, n = 6; TwistcKO UUO, n = 3. Scale bar, 100 ~m. Data is represented as mean ± SEM. One–way ANOVA with Tukey post–hoc analysis was used. *P < 0.05, **P < 0.01, ***P < 0.001, ****P < 0.0001. cont. or contralat.: contralateral kidney, EMT: epithelial to mesenchymal transition as defined by YFP+αSMA+ cells.
Figure 3
Figure 3
EMT program is associated with deregulated expression and functionality of TEC transporter in subjects with kidney disease. (a) Relative expression of the indicated genes in renal biopsies from healthy individuals and subjects with renal fibrosis. (b–c) Representative images of H&E (b) and MTS (c) staining of kidneys from human biopsies. (d–e) Representative images (3 visual fields for each tissue analyzed) of co–immunolabeling for Collagen IV and AQP1 (d), and Collagen IV and Na+/K+ ATPase (e) and associated quantification. Scale bar, 50 ~m. (f) Relative expression of the indicated genes in TECs isolated from renal biopsies from healthy individuals and subjects with renal fibrosis. (g) Na+/K+ ATPase activity assay, Pi: inorganic phosphate. (h) Relative expression of the indicated genes in HK2 cells with and without TGF-β1 treatment, n = 3. (i) Na+/K+ ATPase activity assay of HK2 cells treated with vehicle or TGF-β1. (j) Transporter uptake assays of vehicle or TGF-β1–treated HK2 cells cultured with radio–labeled substrates in the presence or absence of unlabeled inhibitors. Data is presented as mean ± SEM. Vehicle (vh) and TGF-β1 treatment were conducted for 72 hours, n = 3. a and f, error bars denote variation in technical replicates, all other error bars depict variation in biological replicates. d,e and h,i, unpaired two–tailed t–test was used. *P < 0.05, **P < 0.01, **P < 0.001, ****P < 0.0001. (3H)PAH: 3H–p–aminohippuric acid, (3H)ES: 3H–estrone sulfate, (14C)TEA: 14C–tetraethylammonium, UNL(TEA): unlabeled tetraethylammonium.
Figure 4
Figure 4
Inhibition of EMT reduces immune infiltration in kidney fibrosis. (a) Percentages of CD45+, CD3+, CD4+FoxP3 Teff, CD4+FoxP3+ Treg, CD8+, NK cells, CD11c+, γδ+, CD19+, CD11b+Ly6CLy6G, CD11b+Ly6G+, CD11b+Ly6C+ in the indicated experimental groups. Healthy, n = 5; WT contralat., n = 11; TwistcKO contralat., n = 11; WT UUO, n = 11; TwistcKO UUO, n = 11. (b) Representative images (8 visual fields for each tissue analyzed) of immunolabelling for CD3 in the indicated experimental groups. Scale bar, 50 ~m. (c) Quantification of the number of CD3+ cells per visual field in the indicated experimental groups. WT contralat., n = 4 ; TwistcKO contralat., n = 4; WT UUO, n = 4; TwistcKO UUO, n = 4. For panel a data is presented as mean ± SD; for c data is presented as mean ± SEM. One–way ANOVA with Tukey post–hoc analysis was used. *P < 0.05, **P < 0.01, ***P < 0.001, ****P < 0.0001. contralat.: contralateral kidney.
Figure 5
Figure 5
EMT program G2 cell cycle arrest. (a) Percent E–cadherin+pH3+ cells in kidneys from the indicated experimental groups. WT contralat., n = 4; TwistcKO contralat., n = 5; WT UUO, n = 4; TwistcKO UUO, n = 5. WT contralat., n = 3; SnailcKO contralat., n = 3; WT UUO, n = 4; SnailcKO UUO, n = 3. (b) Representative images (5 visual fields for each tissue analyzed) of immunolabeling for YFP, AQP1 and pH3 and percentage of αSMA+ cells out of the YFP+pH3+ TECs (contralat., n = 6; UUO n = 3). Scale bar, 100 ~m. (c) Relative Twist1 expression in indicated cells. (d) Representative images of brightfield imaging in indicated cells. (e) Representative images (3 visual fields for each tissue analyzed) of immunolabeling for β–catenin and percent nuclear accumulation. Scale bar, 50 ~m. (f,g) Representative images (3 visual fields for each tissue analyzed) of immunolabeling for Ki67 and pH3 (f) and percent cells in G2 (g). Scale bar, 50 ~m. (h) Representative images of brightfield imaging in indicated cells. (i) Representative images (3 visual fields for each tissue analyzed) of immunolabeling for β–catenin and percent nuclear accumulation. Scale bar, 50 ~m. (j) Representative images (3 visual fields for each tissue analyzed) of immunolabeling for Ki67 and pH3 (f) and percent cells in G2 (g). Scale bar, 50 ~m. Vehicle (vh) and TGF-β1 treatment were conducted for 24 hours, followed by vehicle or TGF-β1 withdrawal for 24 hours, n = 3. Data is represented as mean ± SEM. Hoechst: nucleus. One–way ANOVA with Tukey post–hoc analysis. b, unpaired one–tailed t–test. *P < 0.05, **P < 0.01, ***P < 0.001, ****P < 0.0001.
Figure 6
Figure 6
p21 controls EMT program G2 cell cycle arrest. (a) Relative expression of Twist1 Snai1 and Cdkn1a (p21) in MCT cells transfected with empty vector, Twist or Snail overexpression vectors, 24 hours post transfection, n = 3. (b) Representative images (3 visual fields for each tissue analyzed) of vehicle or MCT cells transfected with empty vector, Twist or Snail overexpression vectors, 24 hours post transfection, immunolabeled for Ki67 and pH3 and respective quantification of the percentage of cells in G2 phase, n = 3. Scale bar: 50 ~m. (c) Phase contrast light microscopy and immunolabeling for Ki67 and pH3 of MCT shScrbl and MCT shTwist cells transfected with empty or Twist overexpression (OE Twist) plasmids and treated with vehicle or TGF-β1. (d) Quantification of the percentage of empty or Twist OE transfected MCT shScrbl and MCT shTwist cells in G2 phase of the cell cycle comparing cells treated with vehicle or TGF-β1, n = 3. (e) Relative expression of Cdkn1a (p21). (f) Representative images (3 visual fields for each tissue analyzed) of immunolabeling for Ki67 and pH3 of control or p21 siRNA–transfected MCT cells and percent of cells in G2 phase. Scale bar, 50 ~m. Data is represented as mean ± SEM. Hoechst: nucleus. One–way ANOVA with Tukey post–hoc analysis. b and e, unpaired one–tailed t–test. *P < 0.05, **P < 0.01, ***P < 0.001, ****P < 0.0001.

Comment in

Similar articles

Cited by

References

    1. Zeisberg M, Kalluri R. Cellular mechanisms of tissue fibrosis. 1. Common and organ-specific mechanisms associated with tissue fibrosis. Am. J Physiol. Cell Physiol. 2013;304:216–225. - PMC - PubMed
    1. Grams ME, et al. Lifetime incidence of CKD stages 3–5 in the United States. Am. J Kidney Dis. 2013;62:245–252. - PMC - PubMed
    1. Sugimoto H, et al. Activin-like kinase 3 is important for kidney regeneration and reversal of fibrosis. Nat. Med. 2012;18:396–404. - PMC - PubMed
    1. LeBleu VS, et al. Origin and function of myofibroblasts in kidney fibrosis. Nat. Med. 2013;19:1047–1053. - PMC - PubMed
    1. Bechtel W, et al. Methylation determines fibroblast activation and fibrogenesis in the kidney. Nat. Med. 2010;16:544–550. - PMC - PubMed

Online method references

    1. LeBleu VS, et al. Identification of human epididymis protein-4 as a fibroblast-derived mediator of fibrosis. Nature medicine. 2013;19:227–231. - PMC - PubMed
    1. Smyth GK. Limma: linear models for microarray data. In Bioinformatics and Computational Biology Solutions using R and Bioconductor. 2005
    1. Yang J, et al. Twist, a master regulator of morphogenesis, plays an essential role in tumor metastasis. Cell. 2004;117:927–939. - PubMed
    1. Olive PL, Banath JP. The comet assay: a method to measure DNA damage in individual cells. Nature protocols. 2006;1:23–29. - PubMed

Publication types

Substances