. 2015 Oct;14(10):1040-8.
doi: 10.1038/nmat4357. Epub 2015 Aug 3.

Unjamming and cell shape in the asthmatic airway epithelium

Affiliations

Unjamming and cell shape in the asthmatic airway epithelium

Jin-Ah Park et al. Nat Mater. 2015 Oct.

Abstract

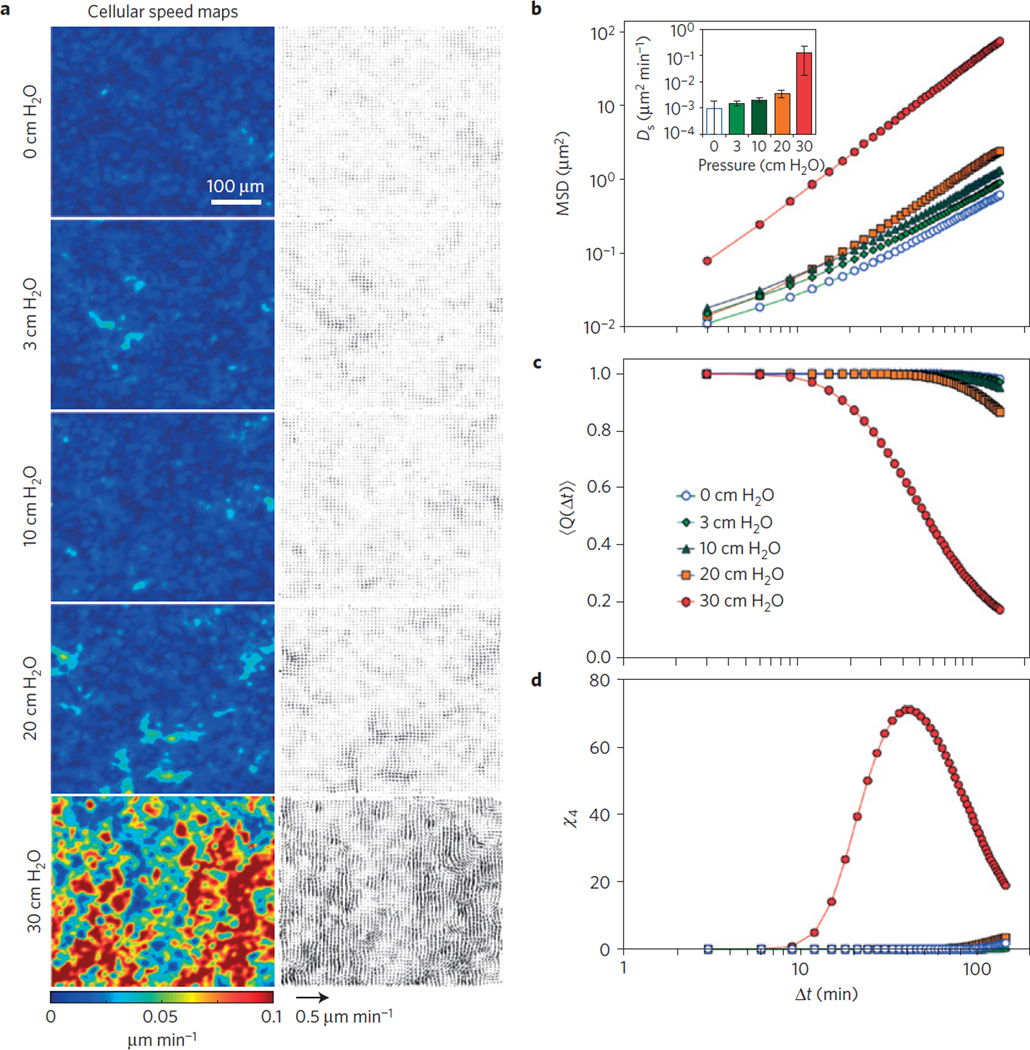
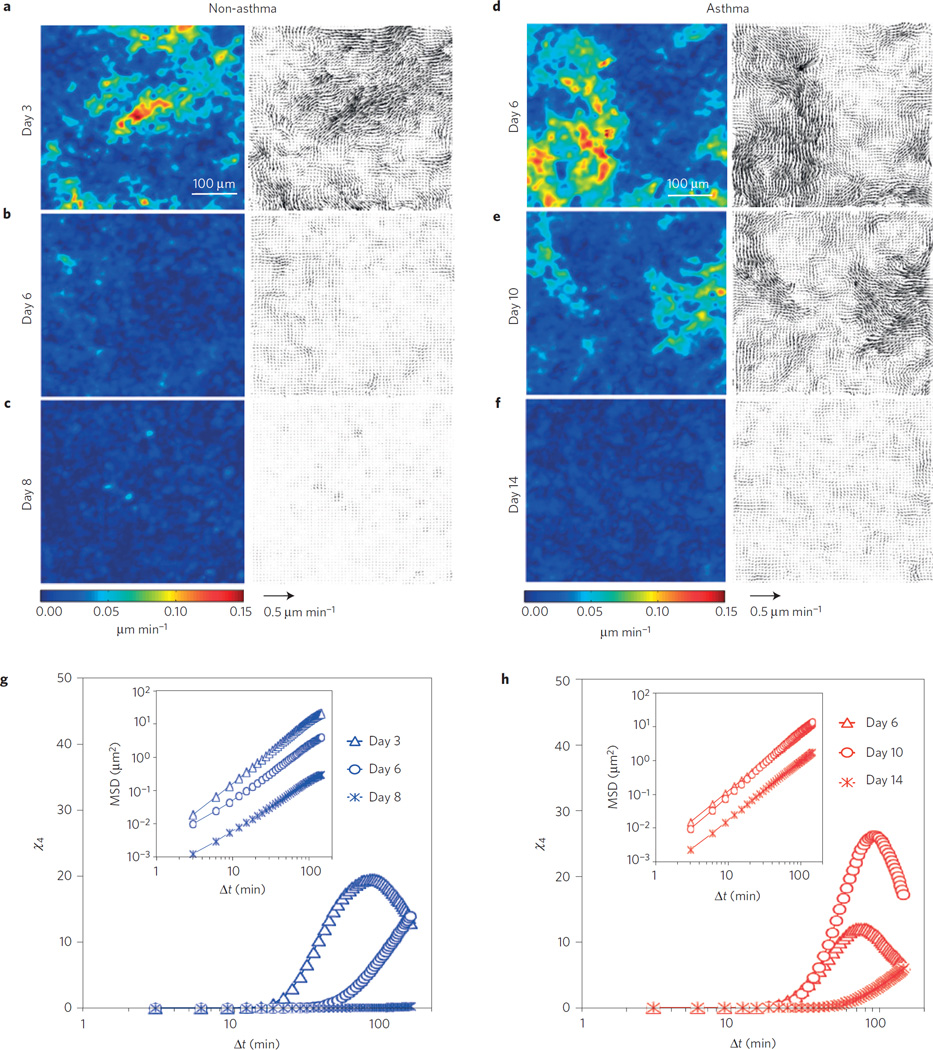
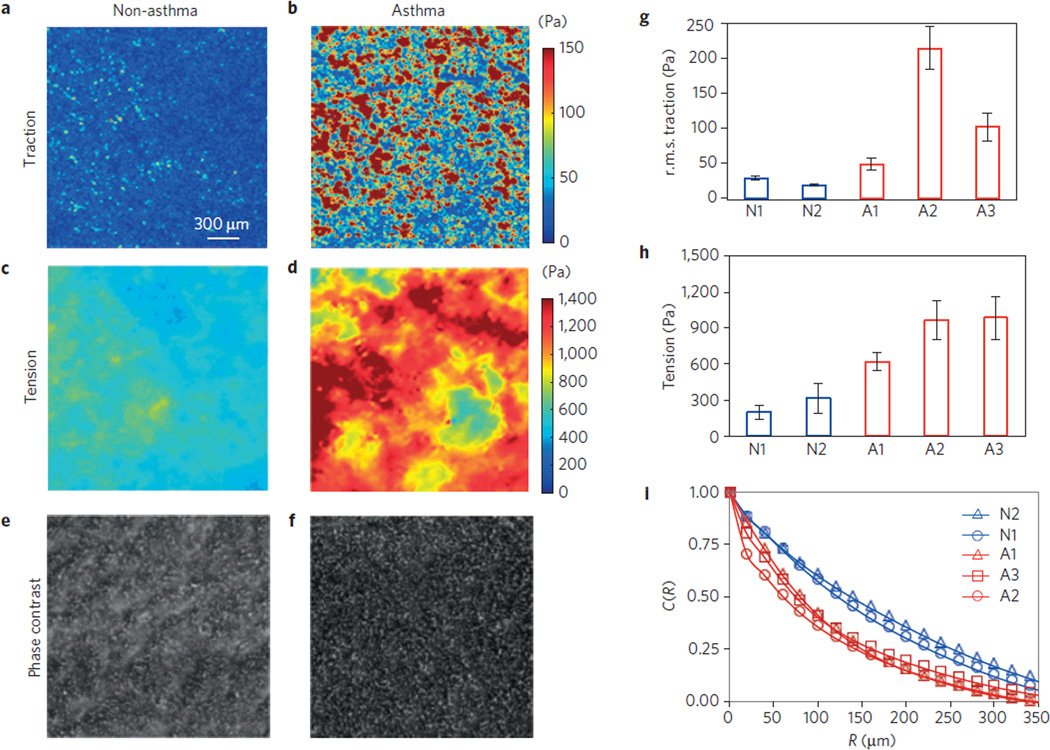
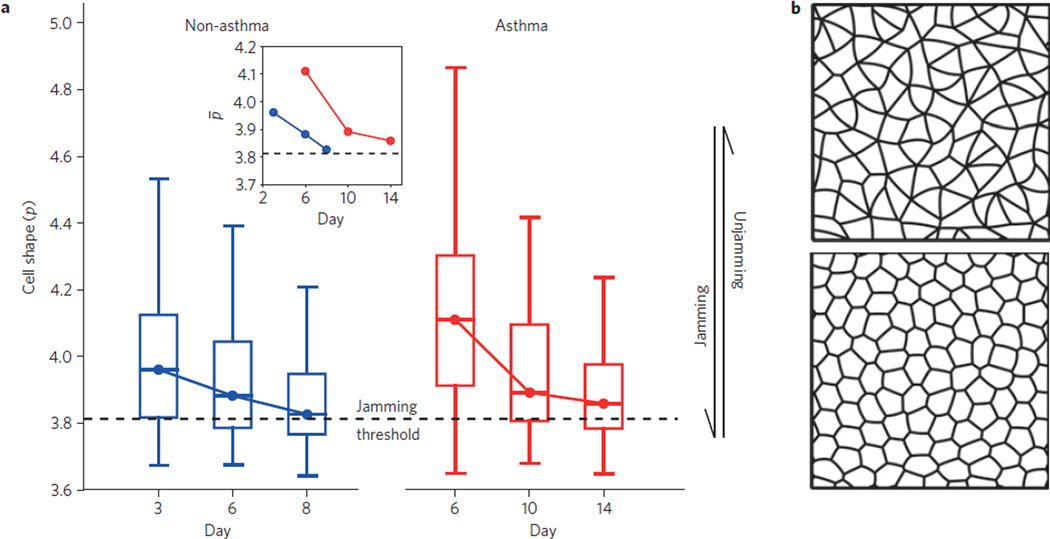
From coffee beans flowing in a chute to cells remodelling in a living tissue, a wide variety of close-packed collective systems-both inert and living-have the potential to jam. The collective can sometimes flow like a fluid or jam and rigidify like a solid. The unjammed-to-jammed transition remains poorly understood, however, and structural properties characterizing these phases remain unknown. Using primary human bronchial epithelial cells, we show that the jamming transition in asthma is linked to cell shape, thus establishing in that system a structural criterion for cell jamming. Surprisingly, the collapse of critical scaling predicts a counter-intuitive relationship between jamming, cell shape and cell-cell adhesive stresses that is borne out by direct experimental observations. Cell shape thus provides a rigorous structural signature for classification and investigation of bronchial epithelial layer jamming in asthma, and potentially in any process in disease or development in which epithelial dynamics play a prominent role.


Figures

Figure 1
Figure 1. In a confluent layer of well-differentiated HBECs, compressive stress mimicking bronchospasm, as in asthmatic bronchospasm, provokes the transition from a solid-like jammed phase to a fluid-like unjammed phase
a, Speed maps (left panels) showed compressive stress at a magnitude of 30 cm H2O induced hypermobility of HBECs on ALI day 16. Within any optical field the migration speed was spatially heterogeneous but increased strongly with increasing P. Colour scale is shown at the bottom of the left panels. The size of vectors (right panels) increased with increasing P and showed large-scale dynamic heterogeneity. Vector scale is shown at the bottom of the right panels. b, As P was progressively increased to 30 cm H2O (red filled circles), the mean square displacement, MSD, and the self-diffusion coefficient Ds increased (inset; Ds = limΔt→∞ MSD(Δt)/(4Δt)), and the system became strongly super-diffusive. Error bars in the inset represent the standard deviation. c, When P was less than 20 cm H2O, the relative overlap of each cell with its initial position was nearly perfect for time intervals (Δt) of less than 144 min, as quantified by the ensemble average, 〈Qt)〉, close to 1. When P was 30 cm H2O (red filled circles), the overlap decreased to 0.17. d, The four-point susceptibility χ4t) is approximated by N[〈Qt)2〉 – 〈Qt)〉2], where N is the number of cells. When movements are cooperative, χ4t) exhibits a peak whose position corresponds roughly to pack lifetime, and whose magnitude corresponds roughly to pack size. When pressure was 30 cm H2O (red filled circles), χ4t) showed a peak indicative of cooperative packs of faster-moving cells with a pack lifetime of 45 min and a pack size of approximately 70 cells.
Figure 2
Figure 2. In HBECs over the course of ALI culture, a spontaneous phase transition occurs from a hypermobile, unjammed, fluid-like phase into a quiescent, jammed, solid-like phase, which was delayed in cells from asthmatic donors
a–c, Speed maps (left panels) and vector maps (right panels) showed that HBECs from a representative non-asthmatic donor were hypermobile on an early ALI day (a; day 3), but spontaneously became quiescent on later ALI days (b, day 6; and c, day 8). Colour and vector scales are shown at the bottom of c. d–f, Speed maps (left panels) and vector maps (right panels) showed that HBECs from a representative asthmatic donor were hypermobile until later ALI days (d, day 6; and e, day 10) and became quiescent on ALI day 14 (f). Colour and vector scales are shown at the bottom of f. g, Four-point susceptibility χ4t) for HBECs from a non-asthmatic donor showed peaks indicative of cooperative packs of faster-moving cells with a lifetime of 81 min with a corresponding pack size of approximately 20 cells on ALI day 3 (blue triangles), whereas peak was undetectable either on ALI day 6 (blue circles) or 8 (blue asterisks). Inset: MSD. h, Four-point susceptibility χ4t) for HBECs from an asthmatic donor showed peaks indicative of cooperative packs of faster-moving cells with lifetimes of 72 and 90 min with corresponding pack sizes of approximately 26 and 12 cells on ALI day 10 (red circles) and 6 (red triangles), respectively, whereas peak was undetectable on ALI day 14 (red asterisks). Inset: MSD.
Figure 3
Figure 3. In HBECs derived from asthmatic donors compared with those from non-asthmatic donors, tractions and intercellular stresses are greater but the spatial correlation of tension decays faster
a,b, Colour maps of tractions exerted by HBECs derived from a non-asthmatic donor (a; N2 in g–i) and an asthmatic donor (b; A2 in g–i) on their substrates. Colour scale is shown to the right of b. c,d, Colour maps of intercellular stresses exerted across cell–cell junctions for donors N2 (c) and A2 (d) show packs of high tension that span many cell diameters. Colour scale is shown to the right of d. e,f, Phase-contrast maps of HBEC layers on polyacrylamide gels for donors N2 (e) and A2 (f). g, In cells derived from asthmatic donors (red: A1, A2, A3) versus non-asthmatic donors (blue: N1, N2), root mean square (r.m.s.) tractions were not statistically different, but tended to be larger (r.m.s. traction: 114±88 Pa versus 24±7 Pa; variance: 7,821 versus 53; p = 0.22). h, Intercellular tensions were larger by a factor of 1.5 to 5 in cells derived from asthmatic (red) versus non-asthmatic donors (blue; tension: 792 ±171 Pa versus 257±82 Pa; variance: 29,426 versus 6,787; p = 0.02). i, Spatial autocorrelation function, C(R), of tension as a function of cell separation distance, R, shows that the tension correlation decayed over several hundred micrometres in all cases, but extended to shorter distances in cells derived from asthmatic (red symbols) versus non-asthmatic donors (blue symbols), thus confirming that intercellular stresses were larger in magnitude but more highly localized in the HBECs derived from asthmatic donors compared with non-asthmatic donors (C(R) at 140 µm in asthmatic versus non-asthmatic HBEC layers: 0.29±0.02 versus 0.48±0.03; variance: 0.0004 versus 0.0009; p = 0.003). The r.m.s. tractions, intercellular tensions and spatial autocorrelation in g–i were averaged across three to five experimental repeats for each donor. Error bars in g,h represent the standard error.
Figure 4
Figure 4. With increasing maturation of HBECs in ALI culture, cell perimeter, as expressed by the non-dimensional parameter , decreases systematically towards the critical value p0* (3.81) predicted to occur at jamming by the vertex model together with the theory of critical scaling exponents
a, Over the course of maturation in ALI culture, HBECs from a representative non-asthmatic donor (Fig. 2 and Supplementary Movie 2) approached the jammed state, and the median ratio of perimeter to the square root area of cells systematically approached the jamming threshold p0*. In HBECs from a representative asthmatic donor (Fig. 2 and Supplementary Movie 3), however, the approach of to p0* was considerably delayed. Over time, and in both cases, systematically approached the jamming threshold of 3.81. Inset: for representative non-asthmatic and asthmatic donors plotted with the same axis of ALI days to allow comparison of the jamming transition timing. Boxplot shows median and quartiles. Whiskers are maximum and minimum data points. b, Simulated tissues with input parameters of target cell-shape index p0 =4.2, corresponding to a fluidized state (top panel), and p0 =3.813, corresponding to a jammed tissue (bottom panel).

Comment in

  • Tissue mechanics: Cell jam.
    Swartz MA. Swartz MA. Nat Mater. 2015 Oct;14(10):970-1. doi: 10.1038/nmat4434. Nat Mater. 2015. PMID: 26395940 No abstract available.

References

    1. Holgate ST. Pathogenesis of asthma. Clin. Exp. Allergy. 2008;38:872–897. - PubMed
    1. Friedl P, Gilmour D. Collective cell migration in morphogenesis, regeneration and cancer. Nature Rev. Mol. Cell Biol. 2009;10:445–457. - PubMed
    1. Henkes S, Fily Y, Marchetti MC. Active jamming: Self-propelled soft particles at high density. Phys. Rev E. 2011;84:040301. - PubMed
    1. Tambe DT, et al. Collective cell guidance by cooperative intercellular forces. Nature Mater. 2011;10:469–475. - PMC - PubMed
    1. Haeger A, Krause M, Wolf K, Friedl P. Cell jamming: Collective invasion of mesenchymal tumor cells imposed by tissue confinement. Biochim. Biophys. Acta. 2014;1840:2386–2395. - PubMed

Publication types