. 2015 Sep;18(9):1310-7.
doi: 10.1038/nn.4077. Epub 2015 Aug 3.

Learning to expect the unexpected: rapid updating in primate cerebellum during voluntary self-motion

Affiliations

Learning to expect the unexpected: rapid updating in primate cerebellum during voluntary self-motion

Jessica X Brooks et al. Nat Neurosci. 2015 Sep.

Abstract

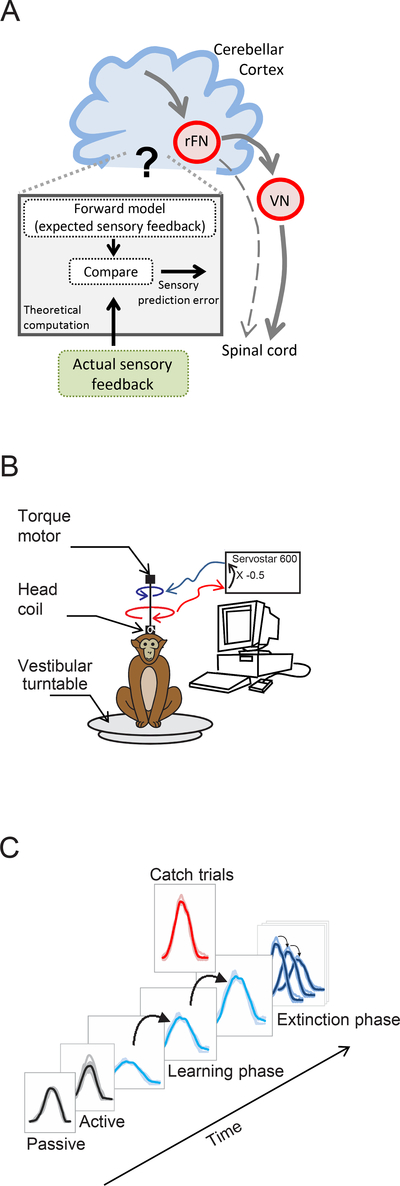
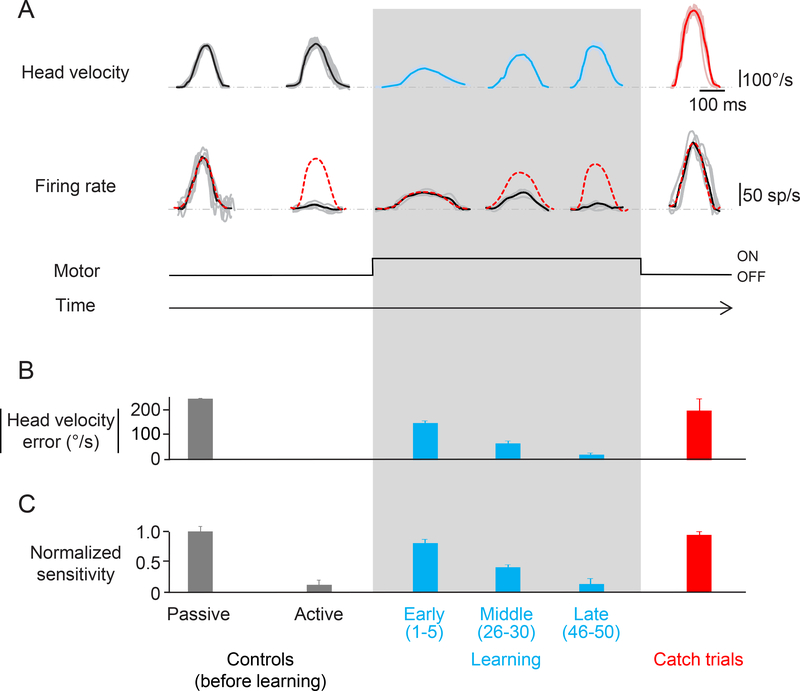
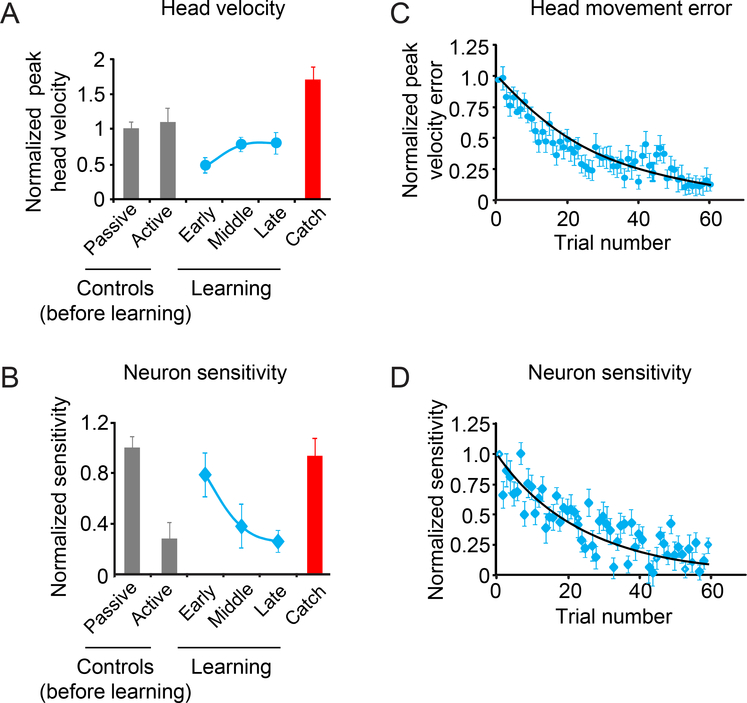
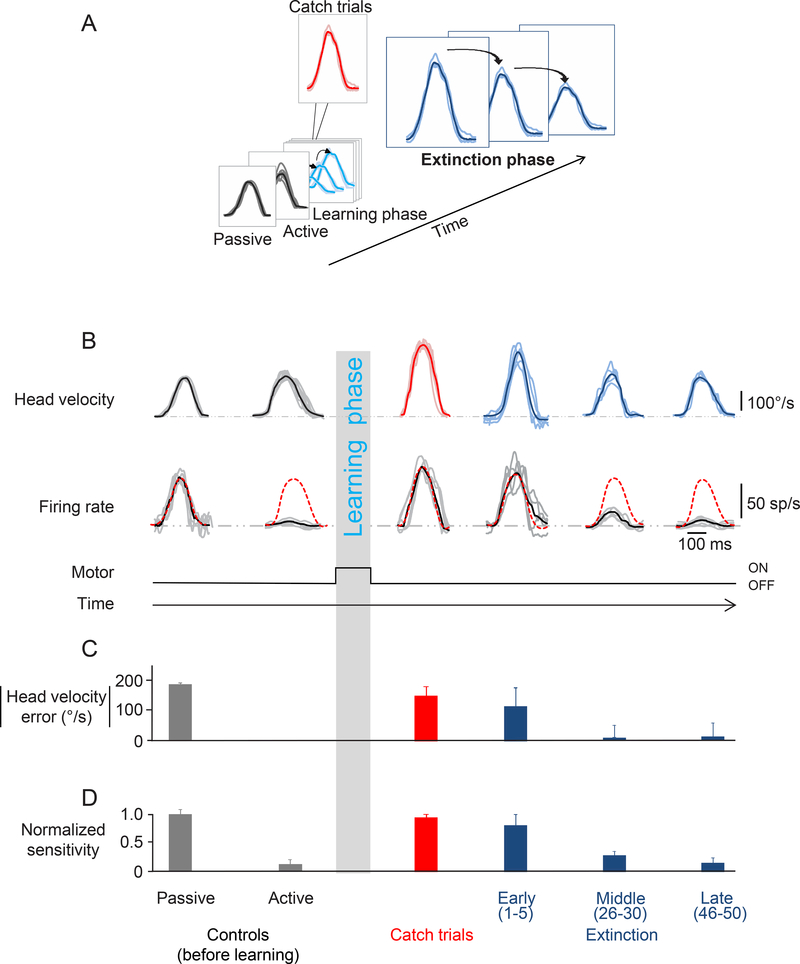
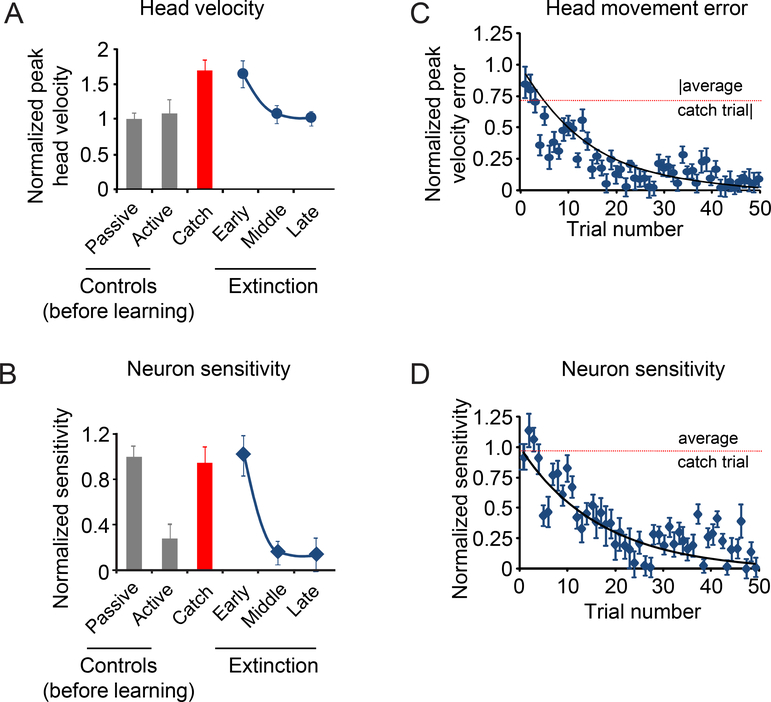
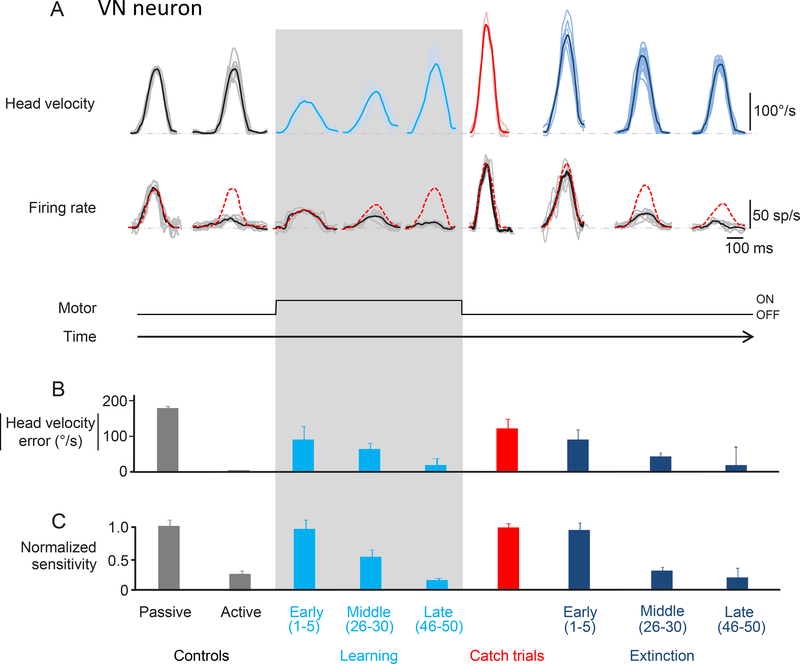
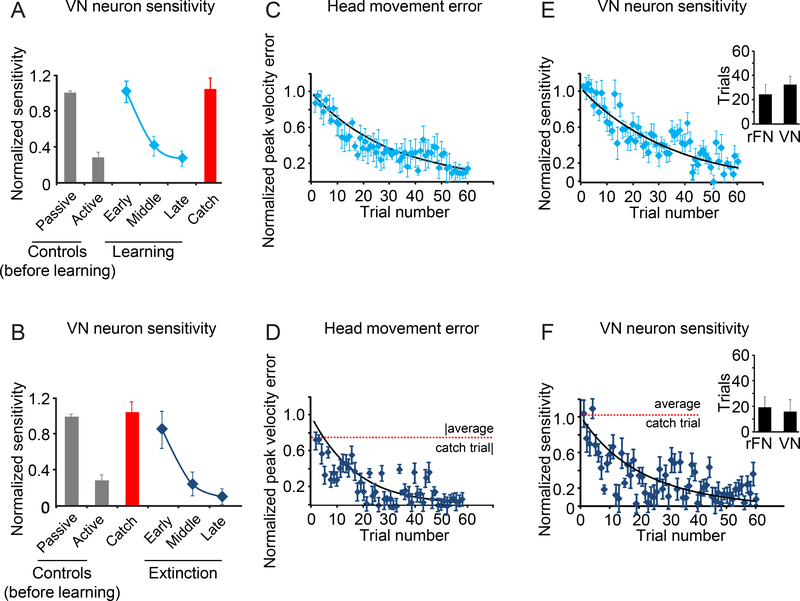
There is considerable evidence that the cerebellum has a vital role in motor learning by constructing an estimate of the sensory consequences of movement. Theory suggests that this estimate is compared with the actual feedback to compute the sensory prediction error. However, direct proof for the existence of this comparison is lacking. We carried out a trial-by-trial analysis of cerebellar neurons during the execution and adaptation of voluntary head movements and found that neuronal sensitivities dynamically tracked the comparison of predictive and feedback signals. When the relationship between the motor command and resultant movement was altered, neurons robustly responded to sensory input as if the movement was externally generated. Neuronal sensitivities then declined with the same time course as the concurrent behavioral learning. These findings demonstrate the output of an elegant computation in which rapid updating of an internal model enables the motor system to learn to expect unexpected sensory inputs.


Figures

Figure 1:
Figure 1:
Experimental design: A. Schematic shows the prevailing model of the proposed circuit for motor learning in which the cerebellum computes an estimate of the expected sensory consequence of the brain’s motor command (i.e., forward model). This estimate is then compared with the actual sensory feedback to compute the sensory prediction error. Single unit recordings were made in the rostral fastigial nucleus (rFN) which constitutes a major output target of the cerebellar cortex as well as vestibular nuclei (VN), which project to the spinal cord. B. Experimental set-up for learning paradigm in which resistive torque was applied to reduce head motion initially by one-half. C. Sequence of learning task. First, head movements and neuronal responses (not shown) were recorded before learning in both passive and active conditions. Second, the load was applied and held constant for the learning phase. Third, after the learning phase, the motor was randomly turned off for single ‘catch’ trials. Finally, the motor was completely turned off for the extinction phase.
Figure 2:
Figure 2:
Learning paradigm. A. Activity of an rFN example neuron during the learning phase and catch trials. Top row shows the head velocity during control trials, learning phase and catch trials overlaying a minimum of 5 trials. Second row shows the firing rates corresponding to the head movements above. Grey lines show individual trials and black lines show the average. The red dashed lines superimposed on the firing rates are a prediction based on the neuron’s sensitivity to passive whole-body rotation. B. Head velocity error magnitude during learning and catch trials. When the load was applied, the monkey initially made slower head movements as quantified by a significant head velocity error. As learning progressed, head velocity increased nearing control values as indicated by the striking decrease in head velocity error magnitude (light blue bars). C. Normalized sensitivity to corresponding head movements shown above. During the learning phase, the neuronal sensitivity gradually decreased from that measured during passive head motion to the suppressed response observed during active motion (light blue bar). Neuronal sensitivity during catch trials (red) is comparable to the neuronal sensitivity during early learning and passive head movements.
Figure 3:
Figure 3:
Average head velocity and sensitivity for our population of rFN neurons during the learning phase. A. Normalized head velocity for control trials before learning, learning phase and catch trials. B. Normalized neuronal sensitivity for control trials, the learning phase and catch trials. Data show average and error bars are ±SEM. C. Scatter plot of peak head velocity errors over time for each trial during the learning phase. D. Scatter plot of normalized neuronal sensitivity over time for each trial during the learning phase. Black lines show exponential fits to the data.
Figure 4:
Figure 4:
Extinction phase. A. This figure focuses on the last phase of the paradigm during which the torque motor is turned off (extinction phase). B. Activity of the same example neuron as in Figure 2 during the extinction phase. Top row shows the head velocity during the extinction phase overlaying a minimum of 5 trials. Second row shows the firing rates corresponding to the head movements above. Grey lines show individual trials and black lines show the average. The dashed red lines superimposed on the firing rates are a prediction based on the sensitivity estimated during passively-applied whole body rotation. C. Head velocity error magnitude during learning extinction. When the load was removed, the monkey initially made faster head movements, and then head velocity error progressively decreased as head velocity approached control values (dark blue bars). D. Normalized neuronal sensitivity for the extinction phase. Data show average and error bars are ±SEM. Data from the control (before learning) and catch trials are reproduced here for comparison.
Figure 5:
Figure 5:
Average head velocity and sensitivity for our population of rFN neurons during the extinction phase. A. Normalized head velocity for control trials before learning, catch trials and extinction phase. B. Normalized neuronal sensitivity for control trials before learning, catch trials and extinction phase. Data show average and error bars are ±SEM. C. Scatter plot of peak head velocity error over time for each trial during the extinction phase. D. Scatter plot of normalized neuronal sensitivity over time for each trial during the extinction phase. Black lines show exponential fits to the data. Dashed lines are the average values for the catch trials.
Figure 6:
Figure 6:
Activity of an example neuron recorded in the vestibular nuclei. A. Top row shows the head velocity during control trials, learning phase, catch trials and extinction phase overlaying a minimum of 5 trials. Bottom row shows the firing rates corresponding to the head movements above. Grey lines show individual trials and black lines show the average. The red dashed lines superimposed on the firing rates are a prediction based on the sensitivity estimated during passive whole-body rotation. B. The magnitude of head velocity error during control, learning, catch, and extinction trials. During the learning phase, the magnitude of head velocity error decreased (as head velocity increased) to approach control values (light blue bars). During the extinction phase (dark blue bars), the magnitude of head velocity error again decreased (this time as head velocity decreased) to approach control values (dark blue bars). C. Normalized sensitivity to corresponding head movements shown above. During the learning phase, neuronal sensitivity gradually decreased from that observed during passive motion to the suppression seen for active motion (light blue bars). Neuronal sensitivity during catch trials (red) is comparable to the neuronal sensitivity during early learning and passive head movements. During the extinction phase, neuronal response sensitivity again gradually decreased from that observed during passive motion to the suppression observed for active motion (dark blue bars).
Figure 7:
Figure 7:
Average head velocity and neuronal sensitivity for our population of neurons recorded in the vestibular nuclei. A. Normalized neuronal sensitivity for control trials before learning, the learning phase and catch trials. B. Normalized neuronal sensitivity for control trials before learning, catch trials and extinction phase. C,D. Scatter plots of head velocity error magnitude for each trial during learning (C) and the extinction of learning (D). The dashed line denotes the average value for the catch trials. E,F. Scatter plot of normalized neuronal sensitivity over time for each trial during learning (E) and the extinction phase (F). The dashed line denotes the average value for the catch trials. Insets compare time constants for learning (E) and extinction (F) with those computed for our population of rFN neurons. Data show average and error bars are ±SEM.

References

    1. Bhushan N & Shadmehr R Computational nature of human adaptive control during learning of reaching movements in force fields. Biological cybernetics 81, 39–60 (1999). - PubMed
    1. Kawato M Internal models for motor control and trajectory planning. Current opinion in neurobiology 9, 718–727 (1999). - PubMed
    1. Shadmehr R, Smith MA & Krakauer JW Error correction, sensory prediction, and adaptation in motor control. Annual review of neuroscience 33, 89–108 (2010). - PubMed
    1. Wolpert DM & Ghahramani Z Computational principles of movement neuroscience. Nature neuroscience 3 Suppl, 1212–1217 (2000). - PubMed
    1. Wolpert DM & Miall RC Forward Models for Physiological Motor Control. Neural networks : the official journal of the International Neural Network Society 9, 1265–1279 (1996). - PubMed

Publication types