. 2015 Sep;16(9):933-41.
doi: 10.1038/ni.3246. Epub 2015 Aug 3.

Single-cell transcriptome analysis reveals coordinated ectopic gene-expression patterns in medullary thymic epithelial cells

Affiliations

Single-cell transcriptome analysis reveals coordinated ectopic gene-expression patterns in medullary thymic epithelial cells

Philip Brennecke et al. Nat Immunol. 2015 Sep.

Abstract

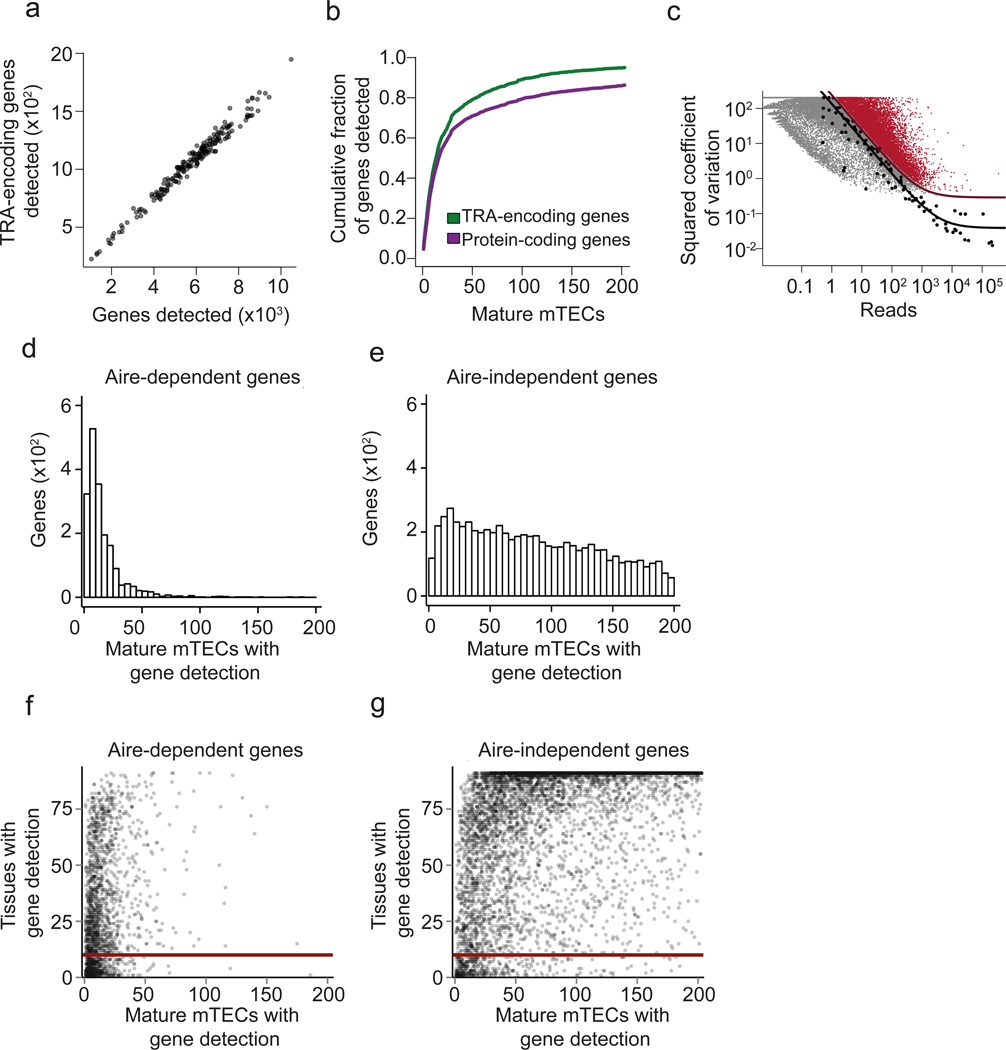
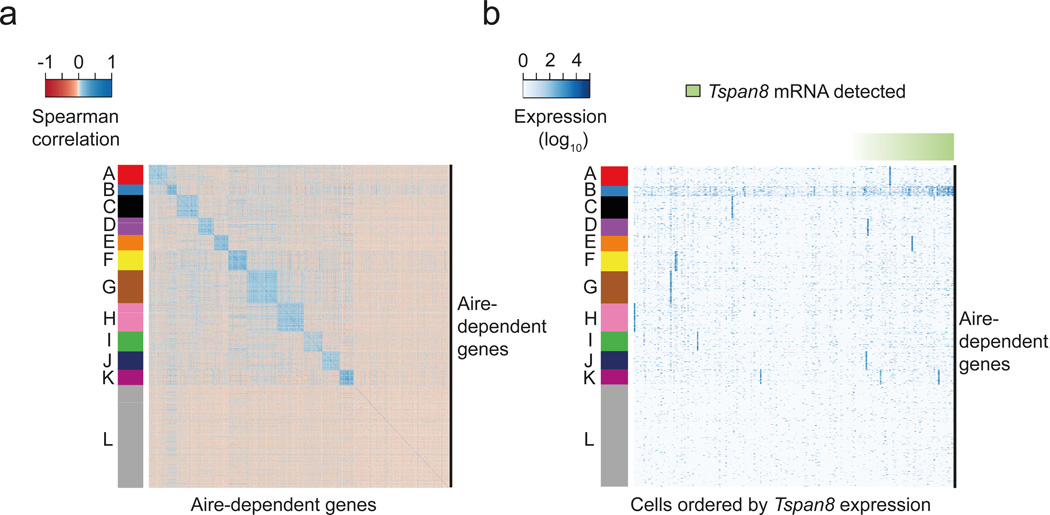
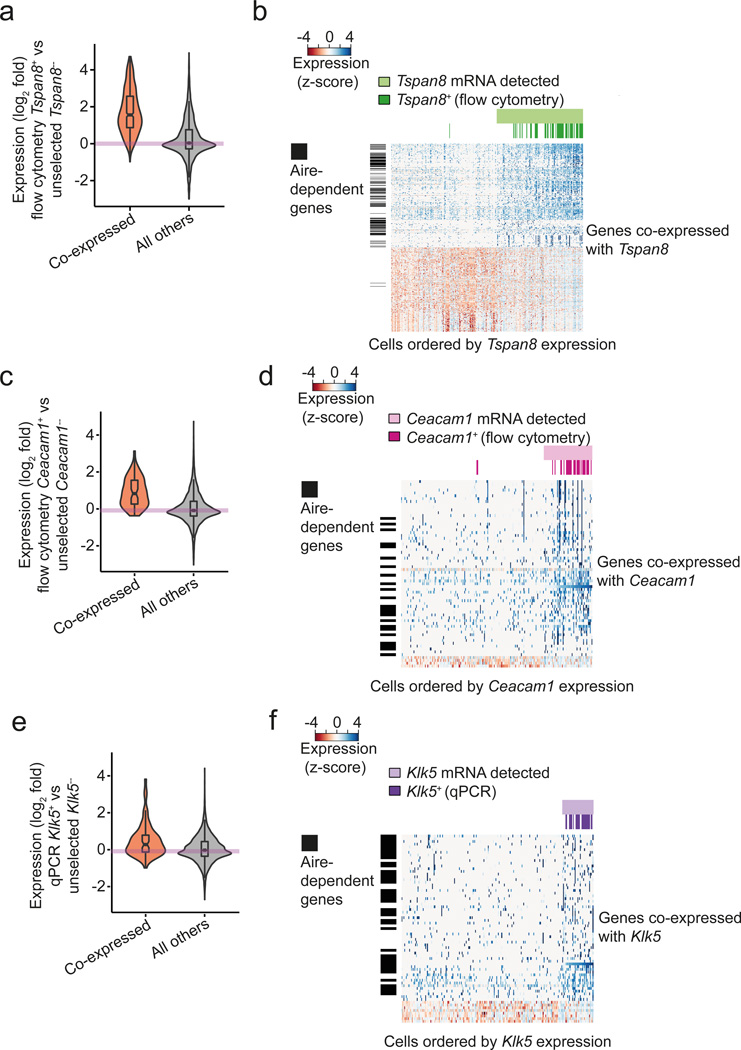
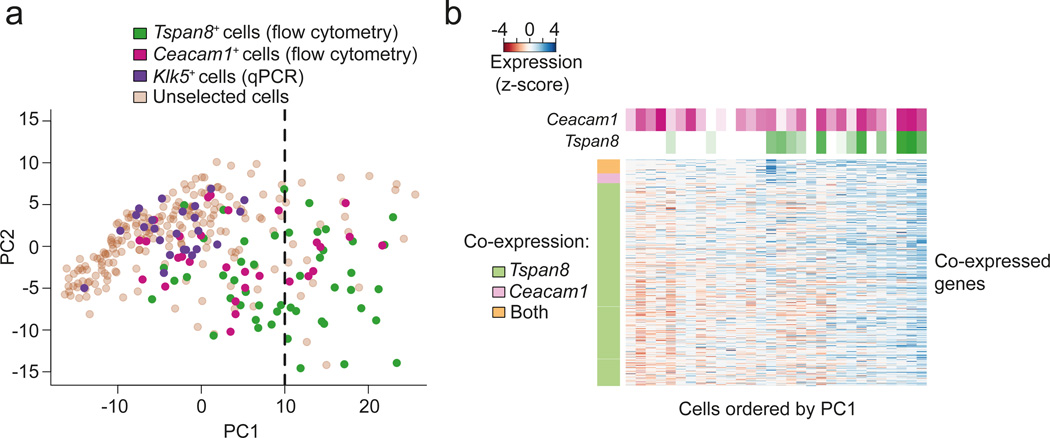
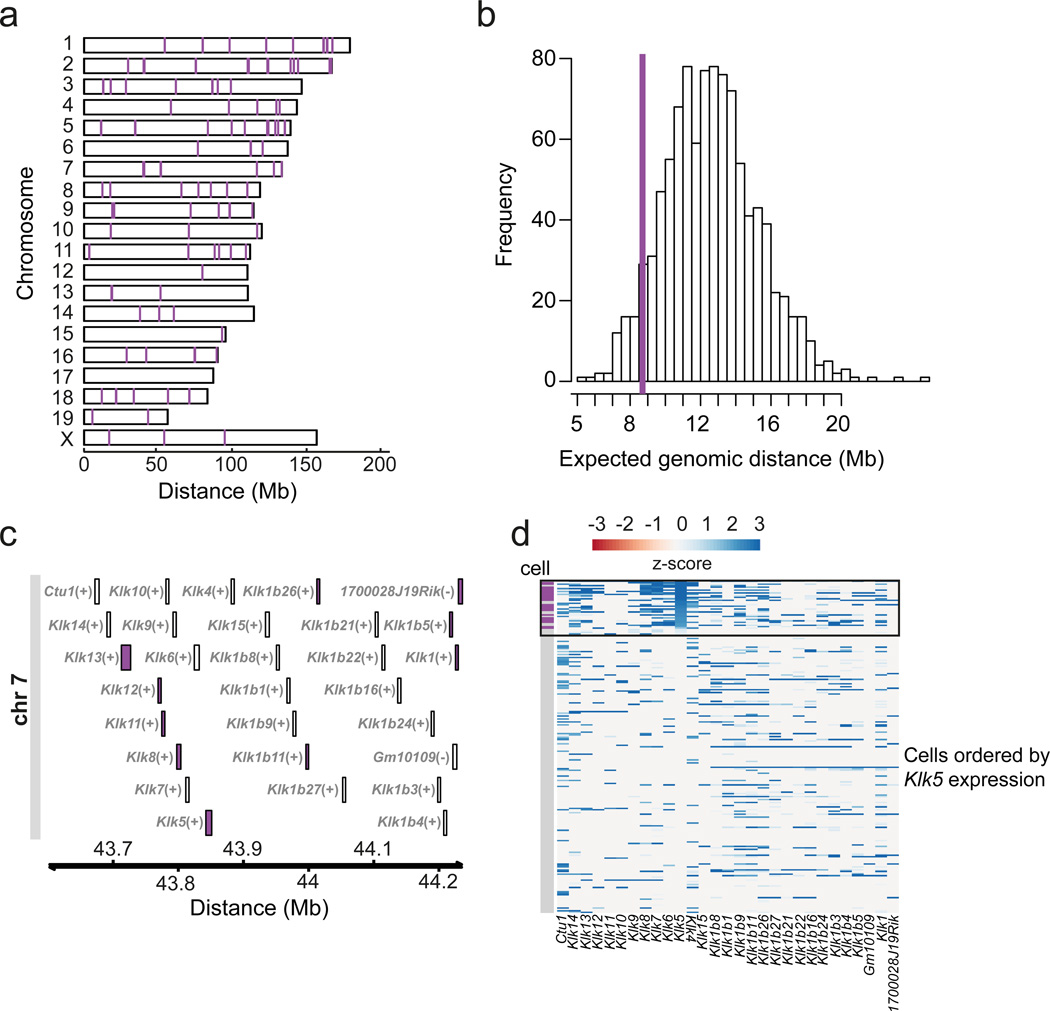
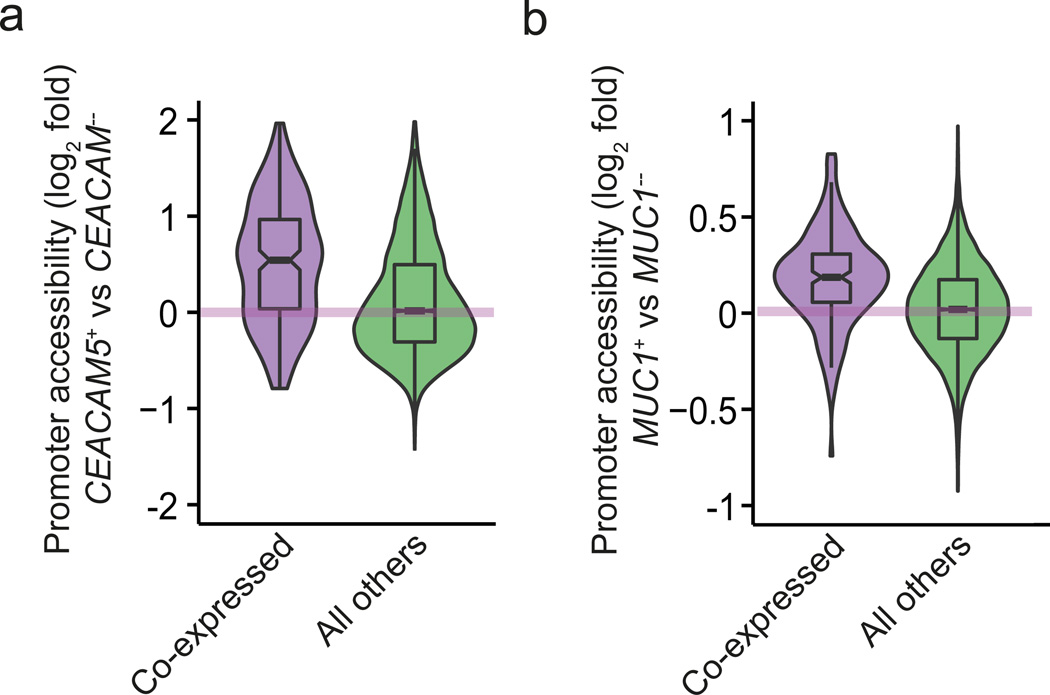
Expression of tissue-restricted self antigens (TRAs) in medullary thymic epithelial cells (mTECs) is essential for the induction of self-tolerance and prevents autoimmunity, with each TRA being expressed in only a few mTECs. How this process is regulated in single mTECs and is coordinated at the population level, such that the varied single-cell patterns add up to faithfully represent TRAs, is poorly understood. Here we used single-cell RNA sequencing and obtained evidence of numerous recurring TRA-co-expression patterns, each present in only a subset of mTECs. Co-expressed genes clustered in the genome and showed enhanced chromatin accessibility. Our findings characterize TRA expression in mTECs as a coordinated process that might involve local remodeling of chromatin and thus ensures a comprehensive representation of the immunological self.


Figures

Figure 1
Figure 1
Mature mTECs are heterogeneous at the single-cell level but express a comprehensive set of TRAs as a population. (a) Scatterplot of scRNA-seq assay showing the number of detected TRA genes versus the number of total genes detected in single mature mTECs (n=203) isolated from pooled thymic tissue of 4-6 weeks old C57BL/6 wild type mice. Semitransparent coloring has been used to ameliorate over-plotting. (b) Cumulative fraction of detected TRA-encoding genes (green line) and all protein coding genes (purple line) with increasing number of mTEC transcriptomes (n=203). (c) Identification of 9,689 significantly highly variable genes across single mature mTECs (n=203) using a published method.. Genes with a biological squared coefficient of variation (SCV) of more than 0.25 at 10% FDR were classified as highly variable (colored in red). Black points represent ERCC RNA spike-ins, the solid black line shows the model fit for the technical noise, and the purple line depicts the threshold of 0.25 biological SCV (i.e. 50% CV). (d) Histogram showing the number of Aire-dependent genes (y-axis) as a function of the number of mature mTECs (n=203) for which the gene was detected (x-axis). (e) Same plot as in Fig. 1d, but showing the data for Aire-independent genes. (f) Scatterplot of the number of tissues in which individual genes are detected in the FANTOM dataset (y-axis) plotted as a function of the number of mature mTECs (n=203) in which the gene was detected. Each data point represents one Aire-dependent gene. The solid red line shows the value of 10 on the y-axis (i.e. threshold on the number of tissues described in the main text). (g) Same plot as in Fig. 1f, but showing the data for Aire-independent genes.
Figure 2
Figure 2
The mature mTEC population consists of numerous low-frequency TRA co-expressed gene sets. (a) Heatmap depicting the pair-wise Spearman correlation matrix of expression profiles of 2,174 highly variable Aire-dependent genes (identified in Fig. 1c) across mature mTECs (n=203). The colors of the vertical bar depict 12 co-expressed gene sets identified by k-medoids clustering. (b) Heatmap representation of the gene expression levels of highly variable Aire-dependent genes across individual mature mTECs (n=203). The row ordering is the same as in Fig 2a. Columns represent individual mature mTECs ordered by the expression levels of Tspan8 (green horizontal bar). Cluster B (colored in blue) represents the set of genes co-expressed with Tspan8. Cluster L (colored in grey) contains genes for which no evidence for co-expression was found.
Figure 3
Figure 3
Co-expressed gene sets are validated by independent experimental approaches. (a) Distribution of gene expression fold-changes (logarithm base 2) between the 48 FACS-selected Tspan8+ mature mTECs and the 137 unselected mature mTECs for which Tspan8 mRNA was not detected by scRNA-seq. The orange violin represents the co-expressed gene set (Supplementary Table 1) and the gray violin represents the data for all other genes. The distribution of fold changes is different between the two gene sets (p < 2.2×10⁻¹⁶). (b) Heatmap representation of expression levels of genes in the Tspan8 co-expressed gene set across the unselected mTECs (n=203) and the pre-selected Tspan8+ mTECs (n=48). Columns represent individual cells (ordered by increasing Tspan8 transcript levels as measured by scRNA-seq) and the rows represent genes co-expressed with Tspan8 (Supplementary Table 1). Cells for which Tspan8 expression was detected by scRNA-seq are labeled in light green, and the preselected Tspan8+ mTECs are colored in dark green. Vertical black bars label Aire-dependent genes. (c) Analogous results as shown in Fig. 3a for the Ceacam1 co-expressed gene set (unselected Ceacam1 mTECs n=172; preselected Ceacam1+ mTECs (n=30). The distribution of fold changes is different between the two gene sets (p = 9.8×10⁻¹¹). (d) Analogous results as shown in Fig. 3b for the Ceacam1 co-expressed gene set (unselected mTECs (n=203); preselected Ceacam1+ mTECs (n=30). (e) Analogous results as shown in Fig. 3a for the Klk5 co-expressed gene set (unselected Klk5 mTECs n=190; preselected Klk5+ mTECs n=24). The distribution of fold changes is different between the two gene sets (p = 8.2×10⁻⁵). (f) Analogous results as shown in Fig. 3b for the Klk5 co-expressed gene set (unselected mTECs (n=203); preselected Klk5+ mTECs (n=24)).
Figure 4
Figure 4
Tspan8 and Ceacam1 co-expressed gene sets overlap and corresponding mTECs are organized along a gradient of Tspan8 expression. (a) Principal Component Analysis (PCA) of all sequenced mature mTECs (n=305, i.e. 203 unselected mTECs, 48 Tspan8+, 30 Ceacam1+, 24 Klk5+ mTECs). Expression levels of genes in the union of the Tspan8 and Ceacam1 co-expressed gene sets were used for the PCA. Tspan8+ cells are colored in green, Ceacam1+ cells in magenta, Klk5+ cells in purple, and the unselected cells in brown. The dashed line indicates the value of 10 along the PC1 projection (i.e. the threshold used in the main text). (b) Heatmap representation of genes detected as being co-expressed with Tspan8 and Ceacam1 in the mature preselected Ceacam1+ mTECs (n=30). Rows correspond to genes of the Tspan8 and the Ceacam1 co-expressed gene sets, and the vertical color bar on the left indicates whether a gene was detected as co-expressed with only one or both of the surface TRA markers. Columns correspond to individual mature preselected Ceacam1+ mTECs and are ordered according to the first principal component from Fig. 4a. The horizontal color bars at the top indicate the mRNA expression levels of Tspan8 and Ceacam1 in individual mTECs.
Figure 5
Figure 5
Co-expressed genes cluster in the genome. (a) Karyogram depicting genomic localization of the genes from co-expressed gene set D (Fig.2 a, b). (b) Distribution of the expected median genomic distance between two genes in the genome (based on 1,000 permutations selecting random sets of genes of the same size as co-expressed gene set D). The purple line depicts the median distance observed for the 115 genes belonging to the co-expressed gene set D, which deviates from the null model (FDR = 10%). (c) Genomic region on chromosome 7 hosting the Kallikrein related-peptidase (Klk) protein family. The purple color indicates the genes assigned to cluster D by the k-medoids clustering (Fig. 2a). (d) Heatmap of gene expression profiles for the Klk gene family locus across single unselected mature mTECs (n=203) and qPCR-selected mature Klk5+ mTECs (n=24). Individual mTECs (y-axis) are ordered by decreasing Klk5 expression levels (from top to bottom). The order of genes (x-axis) corresponds to the genomic position of the genes (as in Fig. 4c). The black box highlights mTECs for which Klk5 transcripts are detected by scRNA-seq. Rows marked in purple (vertical bar) correspond to mature Klk5+ mTECs preselected by qPCR (n=24).
Figure 6
Figure 6
Promoters of co-regulated genes show increased chromatin accessibility. Violin plots showing moderated logarithmic fold changes (MLFC; base 2) in chromatin accessibility between human surface TRA-positive and respective surface TRA-negative mTEC subsets assayed by bulk ATAC-seq (n=3). MLFCs were calculated using the DESeq2 method. (a) Violin representation of data from the human CEACAM5 co-expressed gene set (288 genes). The MLFC between CEACAM5-positive and CEACAM5-negative mTECs are depicted on the y-axis. The promoters (x-axis) are stratified into genes that have been shown previously to be co-expressed with CEACAM5 (purple violin) and the rest of the protein coding genes (green violin). Chromatin accessibility is higher for co-expressed genes (p = 1.2×10⁻¹⁵, t-test). (b) Violin representation as in Fig. 6a using data for the human MUC1 co-expressed gene set (219 genes), yielding analogous results (p = 1.1×10⁻¹⁴, t-test).

References

    1. Anderson MS, Venanzi ES, Klein L, Chen Z, Berzins SP, Turley SJ, et al. Projection of an immunological self shadow within the thymus by the aire protein. Science. 2002;298(5597):1395–1401. - PubMed
    1. DeVoss JJ, Anderson MS. Lessons on immune tolerance from the monogenic disease APS1. Current opinion in genetics & development. 2007;17(3):193–200. - PubMed
    1. Hogquist KA, Baldwin TA, Jameson SC. Central tolerance: learning self-control in the thymus. Nature reviews Immunology. 2005;5(10):772–782. - PubMed
    1. Klein L, Kyewski B, Allen PM, Hogquist KA. Positive and negative selection of the T cell repertoire: what thymocytes see (and don't see) Nature reviews Immunology. 2014;14(6):377–391. - PMC - PubMed
    1. Derbinski J, Schulte A, Kyewski B, Klein L. Promiscuous gene expression in medullary thymic epithelial cells mirrors the peripheral self. Nature immunology. 2001;2(11):1032–1039. - PubMed

Publication types