. 2015 Aug 4:4:e07335.
doi: 10.7554/eLife.07335.

Species-wide whole genome sequencing reveals historical global spread and recent local persistence in Shigella flexneri

Affiliations

Species-wide whole genome sequencing reveals historical global spread and recent local persistence in Shigella flexneri

Thomas R Connor et al. Elife. .

Abstract

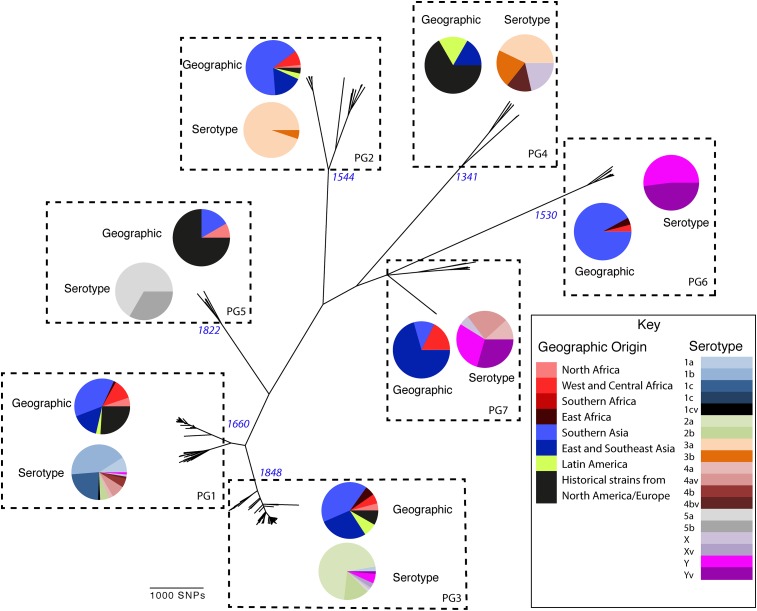
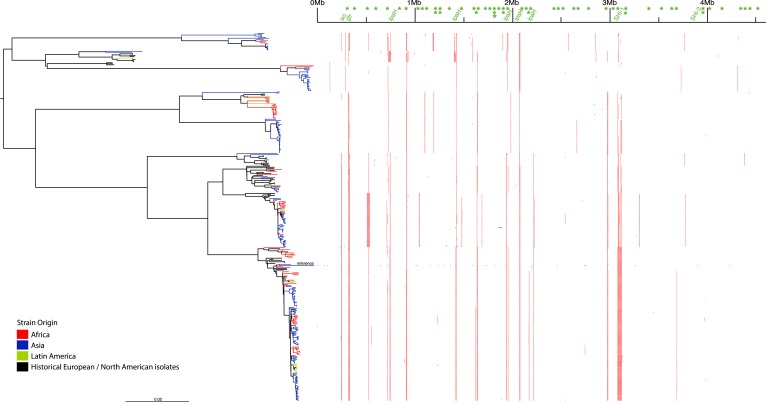
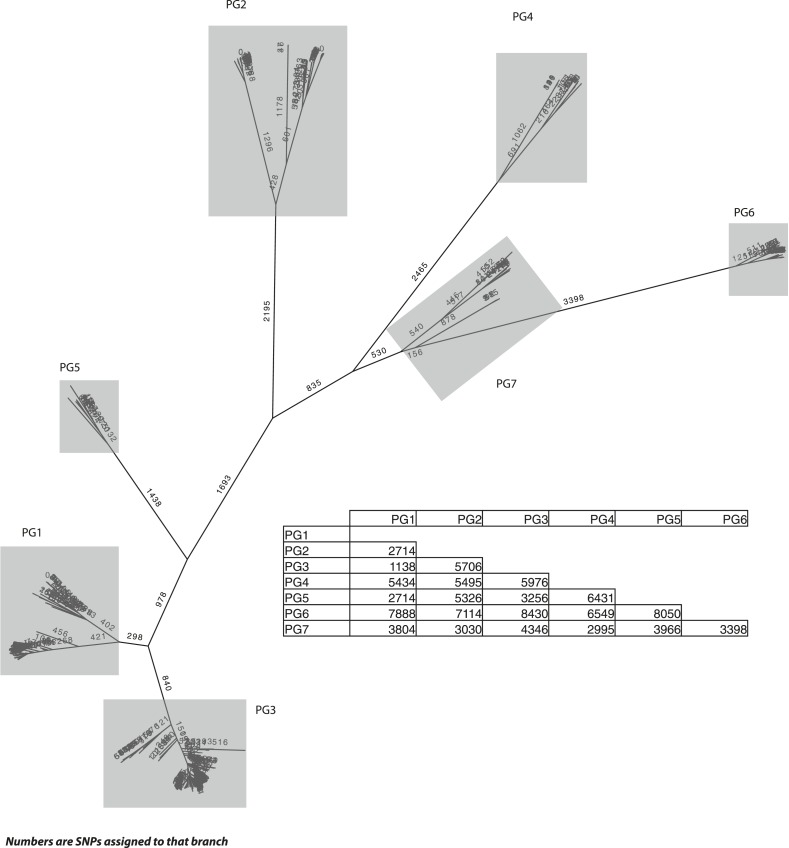
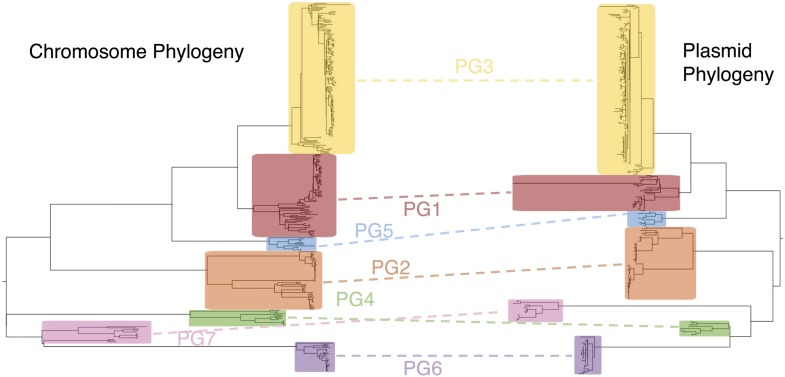
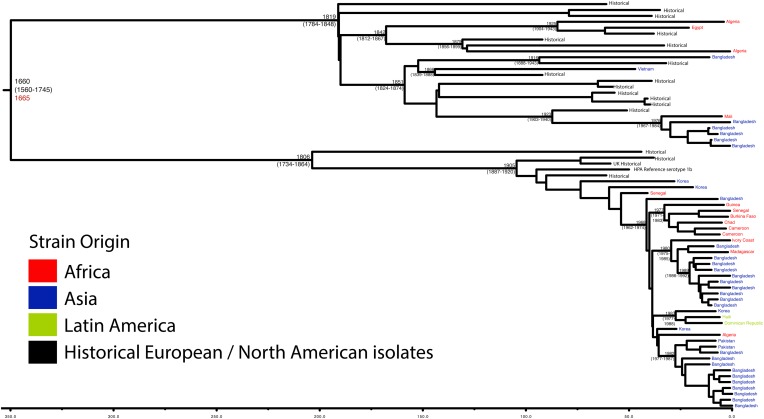
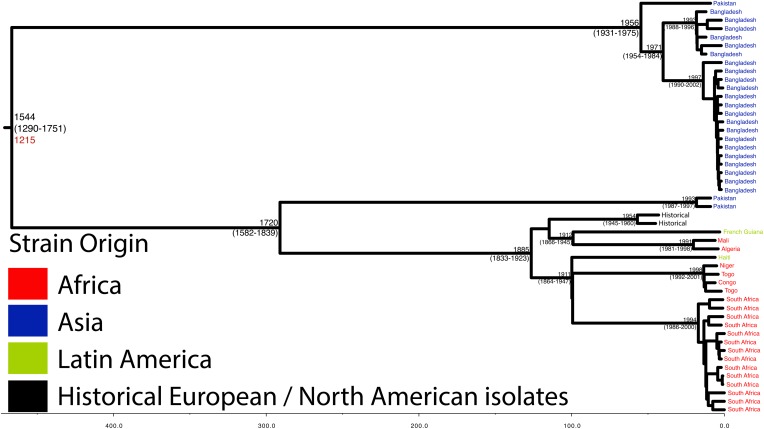
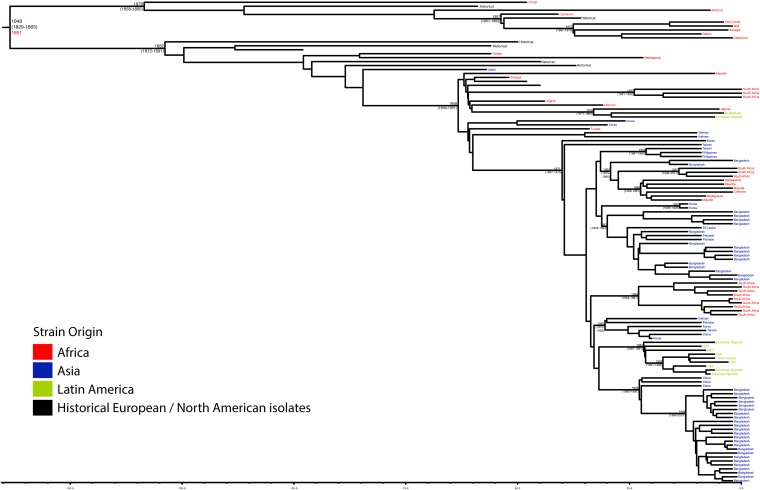
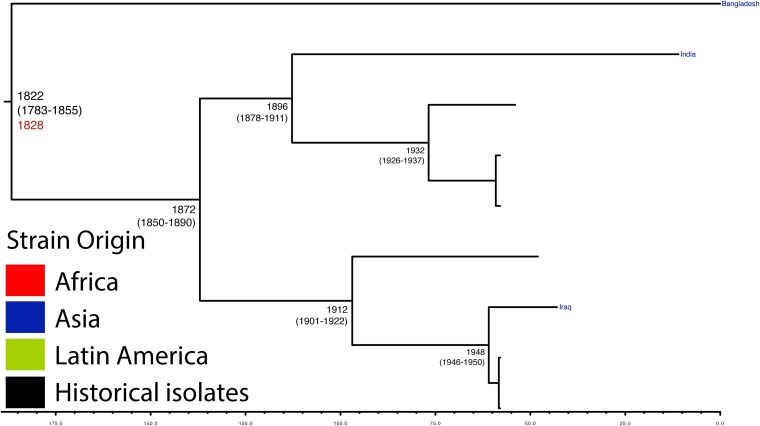
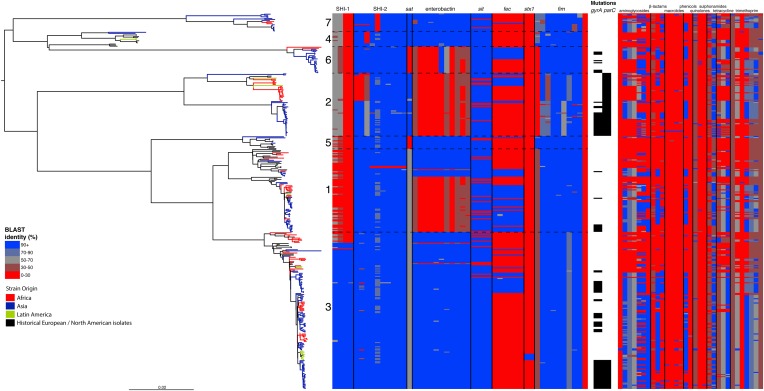
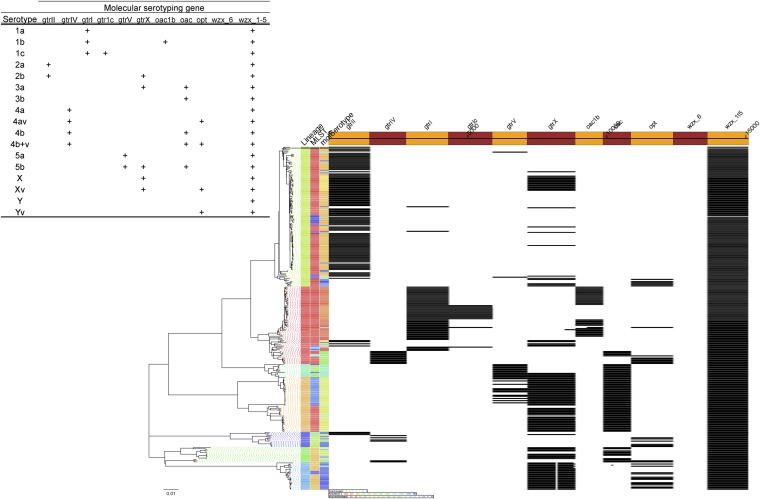
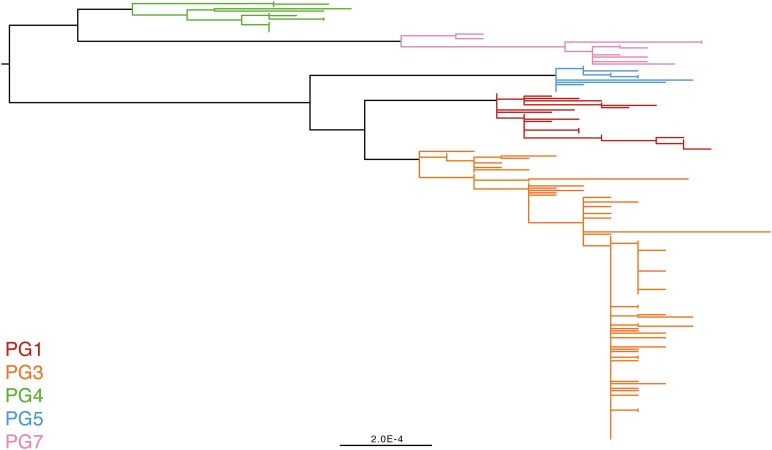
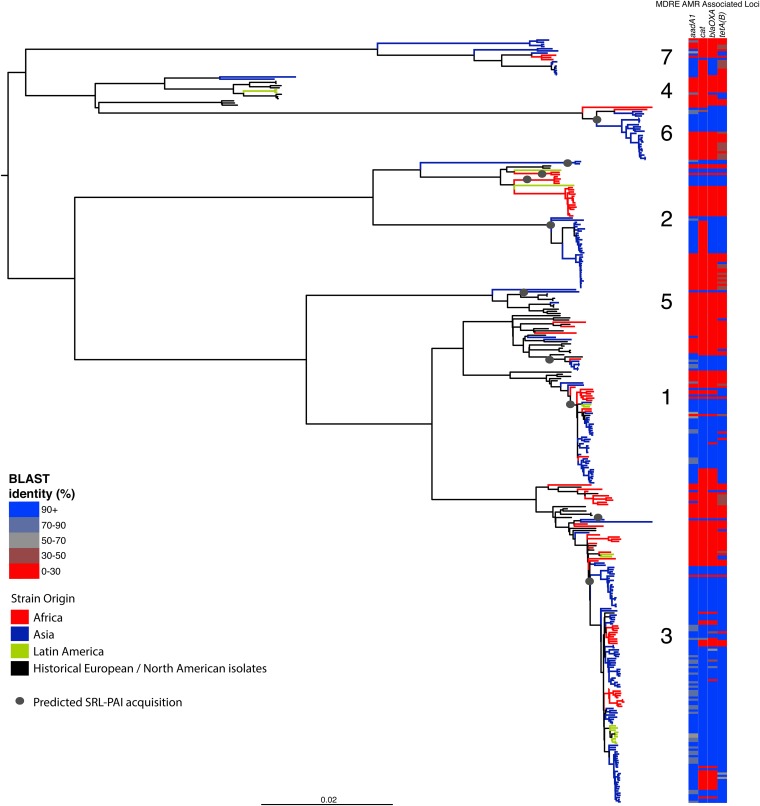
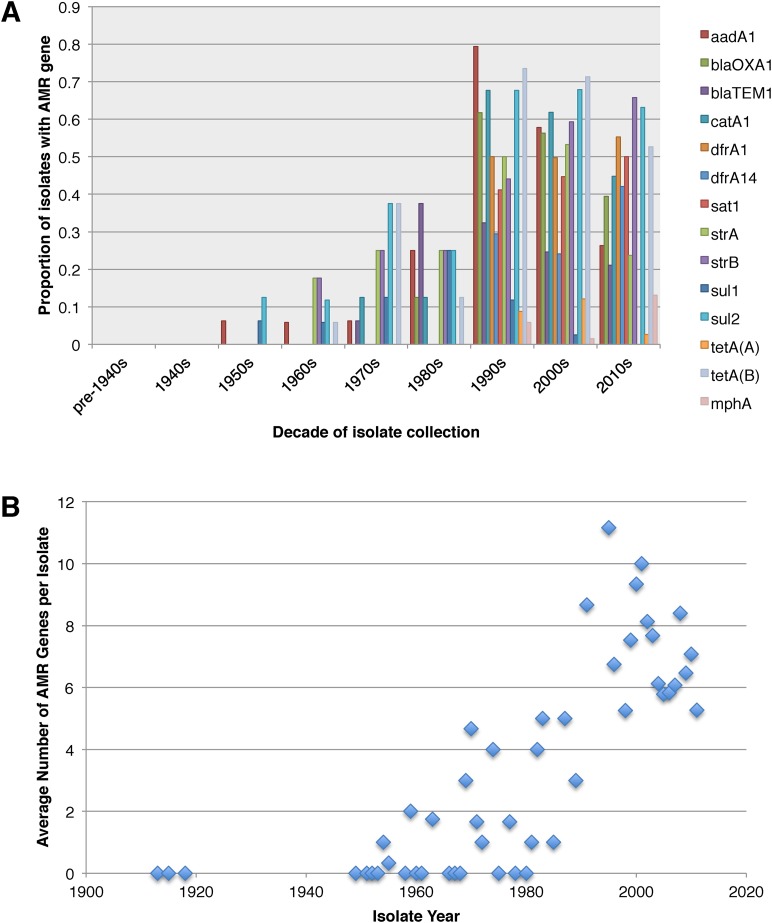
Shigella flexneri is the most common cause of bacterial dysentery in low-income countries. Despite this, S. flexneri remains largely unexplored from a genomic standpoint and is still described using a vocabulary based on serotyping reactions developed over half-a-century ago. Here we combine whole genome sequencing with geographical and temporal data to examine the natural history of the species. Our analysis subdivides S. flexneri into seven phylogenetic groups (PGs); each containing two-or-more serotypes and characterised by distinct virulence gene complement and geographic range. Within the S. flexneri PGs we identify geographically restricted sub-lineages that appear to have persistently colonised regions for many decades to over 100 years. Although we found abundant evidence of antimicrobial resistance (AMR) determinant acquisition, our dataset shows no evidence of subsequent intercontinental spread of antimicrobial resistant strains. The pattern of colonisation and AMR gene acquisition suggest that S. flexneri has a distinct life-cycle involving local persistence.

Keywords: E. coli; Shigella; dysentery; epidemiology; genomics; global health; infectious disease; microbiology; pathogen evolution.


Conflict of interest statement

The authors declare that no competing interests exist.

Figures

Figure 1.
Figure 1.. Maximum likelihood phylogeny for Shigella flexneri isolates including serotypes 1–5, X and Y produced from the results of mapping sequence reads against the genome of S. flexneri 2a strain 301, with recombination removed.
Phylogenetic groups (PGs) determined by Bayesian analysis of population structure clustering are boxed within dotted lines, with the geographic and serotype composition of isolates in each PG being inlaid as pie charts. DOI: http://dx.doi.org/10.7554/eLife.07335.003
Figure 1—figure supplement 1.
Figure 1—figure supplement 1.. Location of segments detected as recombinant.
Blue indicates a likely recombination within an individual isolate while red indicated recombination common to multiple isolates. Green text at the top indicates mobile elements determined by a manual examination of the reference S. flexneri strain 301 genome. DOI: http://dx.doi.org/10.7554/eLife.07335.004
Figure 1—figure supplement 2.
Figure 1—figure supplement 2.. S. flexneri species tree, with the number of single nucleotide polymorphisms (SNPs) per branch.
The SNP tree uses the same alignment as in Figure 1, but is constructed from the SNPs that can be assigned to each branch. The ancestral states were reconstructed using ACTRAN. Insert—a table showing the number of SNPs between the most recent common ancestor (MRCA) of each of the PGs identified. DOI: http://dx.doi.org/10.7554/eLife.07335.005
Figure 1—figure supplement 3.
Figure 1—figure supplement 3.. Co-evolutionary relationships of the S. flexneri genome and virulence plasmid (VP).
A maximum likelihood phylogeny of the S. flexneri chromosome (left) is shown adjacent to one of the VP (right). Collared blocks and labels enclose independently identified BAPs clusters for sequence alignments of the chromosome and VP. Dotted lines indicate groups of isolates shared between clusters in phylogeny. DOI: http://dx.doi.org/10.7554/eLife.07335.006
Figure 1—figure supplement 4.
Figure 1—figure supplement 4.. Maximum Clade Credibility trees generated using Bayesian evolutionary analysis by sampling trees (BEAST) for PG 1.
Dates of MRCA are shown overlying internal nodes followed by 95% HPD in parentheses. Tips display the country of origin for each isolate (where available), coloured by region while the date given in red at the base of each group is the MRCA date obtained from the software Path-O-Gen, calculated based on the root-to-tip distance. The horizontal scale is in the unit of years in the past. DOI: http://dx.doi.org/10.7554/eLife.07335.007
Figure 1—figure supplement 5.
Figure 1—figure supplement 5.. Maximum Clade Credibility trees generated using BEAST for PG 2.
Dates of MRCA are shown overlying internal nodes followed by 95% HPD in parentheses. Tips display the country of origin for each isolate (where available), coloured by region while the date given in red at the base of each group is the MRCA date obtained from the software Path-O-Gen, calculated based on the root-to-tip distance. The horizontal scale is in the unit of years in the past. DOI: http://dx.doi.org/10.7554/eLife.07335.008
Figure 1—figure supplement 6.
Figure 1—figure supplement 6.. Maximum Clade Credibility trees generated using BEAST for PG 3.
Dates of MRCA are shown overlying internal nodes followed by 95% HPD in parentheses. Tips display the country of origin for each isolate (where available), coloured by region while the date given in red at the base of each group is the MRCA date obtained from the software Path-O-Gen, calculated based on the root-to-tip distance. The horizontal scale is in the unit of years in the past. DOI: http://dx.doi.org/10.7554/eLife.07335.009
Figure 1—figure supplement 7.
Figure 1—figure supplement 7.. Maximum Clade Credibility trees generated using BEAST for PG 5.
Dates of MRCA are shown overlying internal nodes followed by 95% HPD in parentheses. Tips display the country of origin for each isolate (where available), coloured by region while the date given in red at the base of each group is the MRCA date obtained from the software Path-O-Gen, calculated based on the root-to-tip distance. The horizontal scale is in the unit of years in the past. DOI: http://dx.doi.org/10.7554/eLife.07335.010
Figure 2.
Figure 2.. Correlation of isolate phylogeny with pathogenicity and antimicrobial resistance (AMR) determinants.
The midpoint-rooted maximum likelihood phylogenetic tree shows PGs, with tips and terminal branches collared by continent of origin. Tracks adjacent to each isolate show the percentage BLAST identity of the best hit in the sample assembly against key virulence and AMR determinants. Isolates with mutations in the gyr/par genes have black bars in the relevant tracks. The virulence determinants shown are SHI-1 (pic, sigA, set1AB), SHI-2 (shiABCDE, iucABCD, iutA), sat, enterobactin (entABECFD, fepABCDG), sitABCD, fecEDCBAR, stx1ab, fimZBCHGFDEAY, and the AMR genes are aac(3)-II, aadA1, aadA2, aadA5, strA, strB, sat1 (aminioglycosides), blaCTX-M-24, blaOXA-1, blaTEM-1, (β-lactams) ermB, msrE, mphA, mphE, (macrolides) catA1, catB1, (phenicols) qacEΔ1, qnrS1, (quinolones) qepA, sul1, sul2 (sulphonamides) tetA(A), tetA(D), tetA(B) (tetracyclin), dfrA17, dfrA3b, dfrA1, dfrA5, dfrA14 and dfrA8 (trimethoprim). DOI: http://dx.doi.org/10.7554/eLife.07335.011
Figure 2—figure supplement 1.
Figure 2—figure supplement 1.. Results of molecular serotyping, displaying the distribution of MLST, molecular serotype, and the distribution of defining genes (according to key, top left) among isolates.
DOI: http://dx.doi.org/10.7554/eLife.07335.012
Figure 2—figure supplement 2.
Figure 2—figure supplement 2.. Maximum likelihood phylogeny of an alignment of the concatenated nucleotide sequences the enterobactin locus of 13 genes (34,732 NT; containing entABCDEFS, fepABCDG and fes).
The tree is drawn using PhyML, with a GTR model and contains 191 strains. Isolate labels are collared according to whole-genome based PG definition. DOI: http://dx.doi.org/10.7554/eLife.07335.013
Figure 2—figure supplement 3.
Figure 2—figure supplement 3.. Correlation of isolate phylogeny with AMR determinants, showing only the SRL-MDRE-associated loci aadA1, blaOXA-1, cat and tetA(B).
Grey circles indicate branches where acquisition events are predicted to have taken place. DOI: http://dx.doi.org/10.7554/eLife.07335.014
Figure 3.
Figure 3.. Graphs showing the pattern of AMR presence within our dataset.
(A) Graph showing the proportion of isolates from each decade that contain the AMR genes. (B) Graph showing the average number of resistance genes found in each isolate collected, by year. DOI: http://dx.doi.org/10.7554/eLife.07335.015

References

    1. Al-Hasani K, Henderson IR, Sakellaris H, Rajakumar K, Grant T, Nataro JP, Robins-Browne R, Adler B. The sigA gene which is borne on the she pathogenicity island of Shigella flexneri 2a encodes an exported cytopathic protease involved in intestinal fluid accumulation. Infection and Immunity. 2000;68:2457–2463. doi: 10.1128/IAI.68.5.2457-2463.2000. - DOI - PMC - PubMed
    1. Allison GE, Verma NK. Serotype-converting bacteriophages and O-antigen modification in Shigella flexneri. Trends in Microbiology. 2000;8:17–23. doi: 10.1016/S0966-842X(99)01646-7. - DOI - PubMed
    1. Ashton PM, Baker KS, Gentle A, Wooldridge DJ, Thomson NR, Dallman TJ, Jenkins C. Draft genome sequences of the type strains of Shigella flexneri held at Public Health England: comparison of classical phenotypic and novel molecular assays with whole genome sequence. Gut Pathogens. 2014;6:7. doi: 10.1186/1757-4749-6-7. - DOI - PMC - PubMed
    1. Baker KS, Dallman TJ, Ashton PM, Day M, Hughes G, Crook PD, Gilbart VL, Zittermann S, Allen VG, Howden BP, Tomita T, Valcanis M, Harris SR, Connor TR, Sintchenko V, Howard P, Brown JD, Petty NK, Gouali M, Thanh DP, Keddy KH, Smith AM, Talukder KA, Faruque SM, Parkhill J, Baker S, Weill FX, Jenkins C, Thomson NR. Intercontinental dissemination of azithromycin-resistant shigellosis through sexual transmission: a cross-sectional study. The Lancet. Infectious Diseases. 2015 doi: 10.1016/S1473-3099(15)00002-X. - DOI - PubMed
    1. Baker KS, Mather AE, McGregor H, Coupland P, Langridge GC, Day M, Deheer-Graham A, Parkhill J, Russell JE, Thomson NR. The extant World War 1 dysentery bacillus NCTC1: a genomic analysis. Lancet. 2014;384:1691–1697. doi: 10.1016/S0140-6736(14)61789-X. - DOI - PMC - PubMed

Publication types

Substances