

Mouse Models of Experimental Autoimmune Uveitis: Comparative Analysis of Adjuvant-Induced vs Spontaneous Models of Uveitis
- PMID: 26238369
- PMCID: PMC11340904
- DOI: 10.2174/1566524015666150731100318
Mouse Models of Experimental Autoimmune Uveitis: Comparative Analysis of Adjuvant-Induced vs Spontaneous Models of Uveitis
Abstract
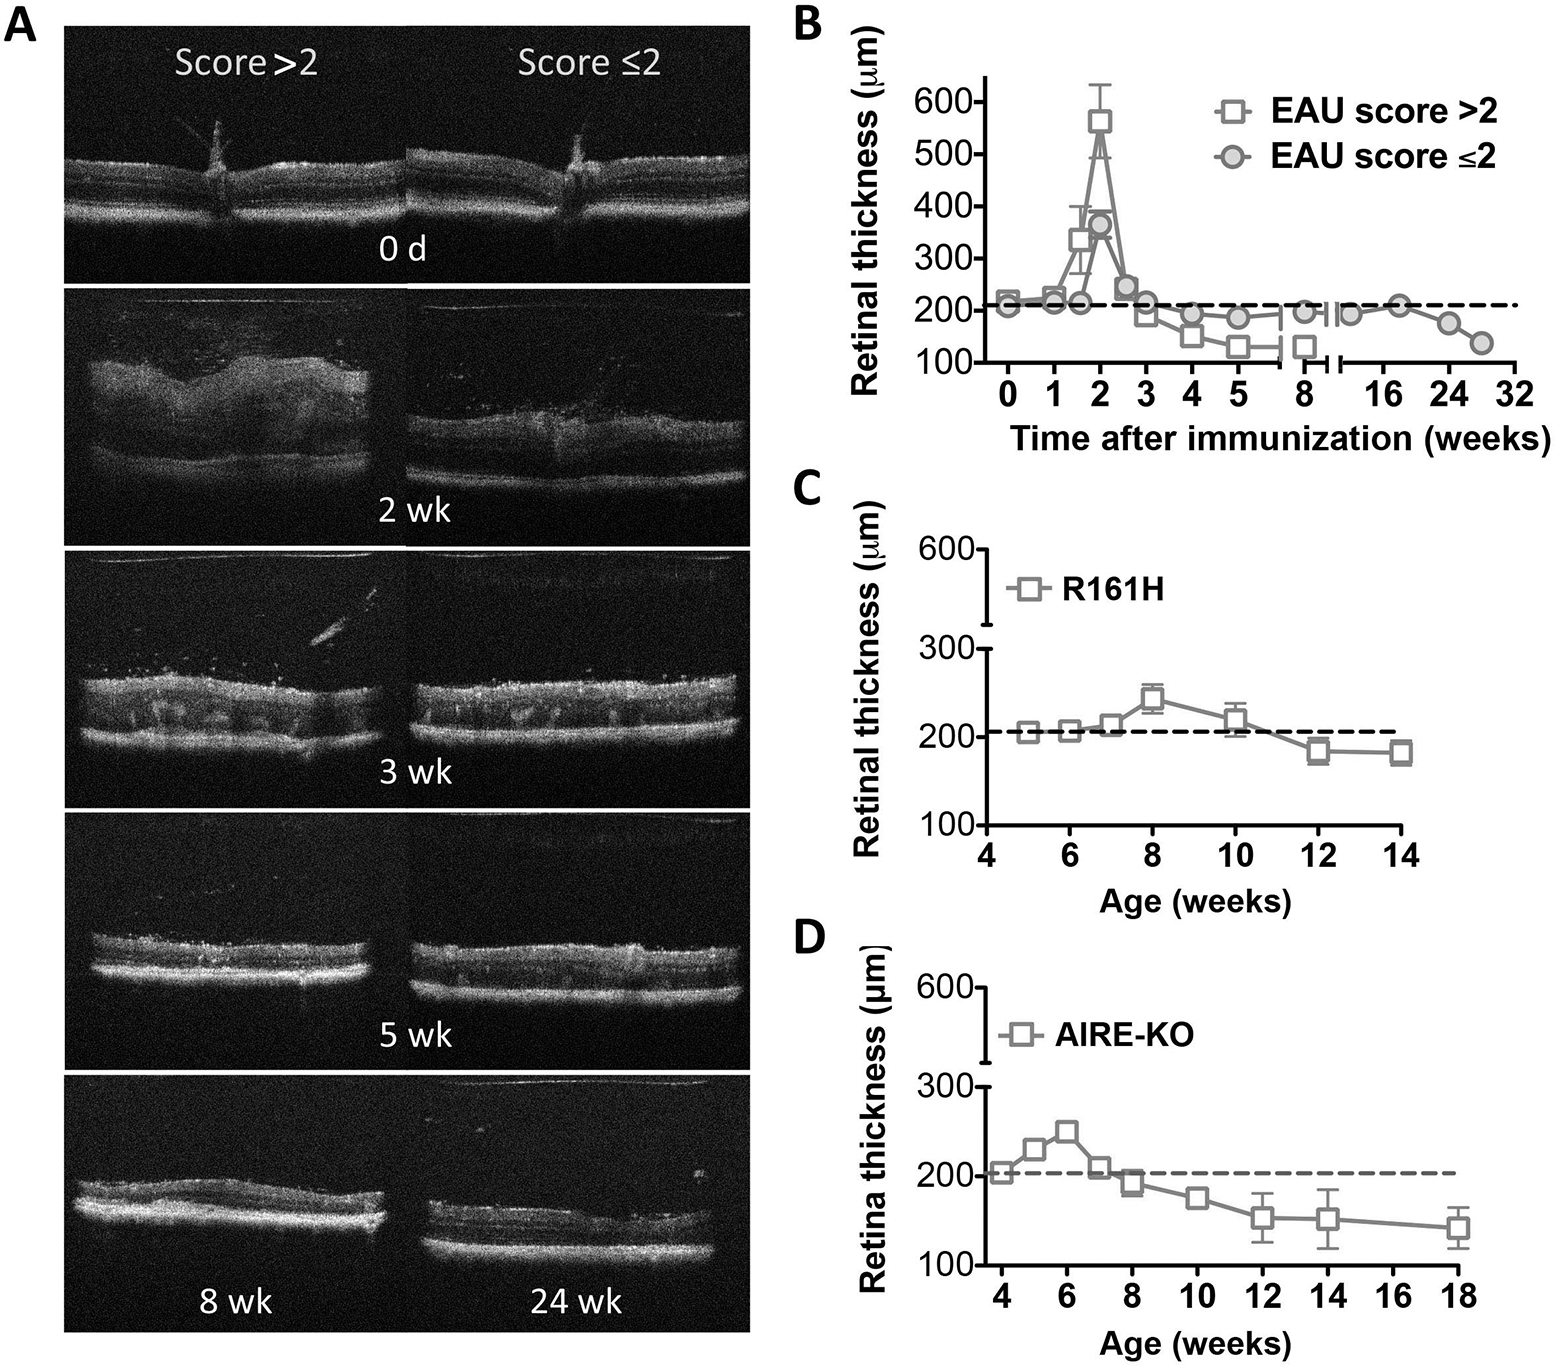
Mouse models of experimental autoimmune uveitis (EAU) mimic unique features of human uveitis, and serve as a template for preclinical study. The "classical" EAU model is induced by active immunization of mice with the retinal protein IRBP in adjuvant, and has proved to be a useful tool to study basic mechanisms and novel therapy in human uveitis. Several spontaneous models of uveitis induced by autoreactive T cells targeting on IRBP have been recently developed in IRBP specific TCR transgenic mice (R161H) and in AIRE(-/-) mice. The "classical" immunization-induced EAU exhibits acute ocular inflammation with two distinct patterns: (i) severe monophasic form with extensive destruction of the retina and rapid loss of visual function, and (ii) lower grade form with an acute onset followed by a prolonged chronic phase of disease. The spontaneous models of uveitis in R161H and AIRE(-/-) mice have a gradual onset and develop chronic ocular inflammation that ultimately leads to retinal degeneration, along with a progressive decline of visual signal. The adjuvant-dependent model and adjuvant-free spontaneous models represent distinct aspects and/or various forms of human uveitis. This review will discuss and compare clinical manifestations, pathology as well as visual function of the retina in the different models of uveitis, as measured by fundus imaging and histology, optical coherence tomography (OCT) and electroretinography (ERG).
Conflict of interest statement
CONFLICT OF INTEREST
The authors confirm that this article content has no conflict of interest.
Figures


Similar articles
-
Comparative analysis of induced vs. spontaneous models of autoimmune uveitis targeting the interphotoreceptor retinoid binding protein.PLoS One. 2013 Aug 28;8(8):e72161. doi: 10.1371/journal.pone.0072161. eCollection 2013. PLoS One. 2013. PMID: 24015215 Free PMC article.
-
Comparative Analysis of the Interphotoreceptor Retinoid Binding ProteinInduced Models of Experimental Autoimmune Uveitis in B10.RIII versus C57BL/6 Mice.Curr Mol Med. 2018;18(9):602-611. doi: 10.2174/1566524019666190112132610. Curr Mol Med. 2018. PMID: 30636608
-
Breakdown of immune privilege and spontaneous autoimmunity in mice expressing a transgenic T cell receptor specific for a retinal autoantigen.J Autoimmun. 2013 Aug;44:21-33. doi: 10.1016/j.jaut.2013.06.003. Epub 2013 Jun 28. J Autoimmun. 2013. PMID: 23810578 Free PMC article.
-
Mouse models of experimental autoimmune uveitis.Ophthalmic Res. 2008;40(3-4):169-74. doi: 10.1159/000119871. Epub 2008 Apr 18. Ophthalmic Res. 2008. PMID: 18421234 Free PMC article. Review.
-
The Role of αA-Crystallin in Experimental Autoimmune Uveitis.Curr Mol Med. 2015;15(6):558-64. doi: 10.2174/1566524015666150731101146. Curr Mol Med. 2015. PMID: 26238368 Review.
Cited by
-
Antigen-Specific Intraocular Cytokine Responses Distinguish Ocular Tuberculosis From Undifferentiated Uveitis in Tuberculosis-Immunoreactive Patients.Am J Ophthalmol. 2023 Feb;246:31-41. doi: 10.1016/j.ajo.2022.08.029. Epub 2022 Sep 7. Am J Ophthalmol. 2023. PMID: 36087765 Free PMC article.
-
Kallistatin Attenuates Experimental Autoimmune Uveitis by Inhibiting Activation of T Cells.Front Immunol. 2020 May 21;11:975. doi: 10.3389/fimmu.2020.00975. eCollection 2020. Front Immunol. 2020. PMID: 32508841 Free PMC article.
-
TIGIT+ A2Ar-Dependent anti-uveitic Treg cells are a novel subset of Tregs associated with resolution of autoimmune uveitis.J Autoimmun. 2020 Jul;111:102441. doi: 10.1016/j.jaut.2020.102441. Epub 2020 Mar 20. J Autoimmun. 2020. PMID: 32201225 Free PMC article.
-
Identification of Natural Regulatory T Cell Epitopes Reveals Convergence on a Dominant Autoantigen.Immunity. 2017 Jul 18;47(1):107-117.e8. doi: 10.1016/j.immuni.2017.06.015. Epub 2017 Jul 11. Immunity. 2017. PMID: 28709804 Free PMC article.
-
Autoimmunity to neuroretina in the concurrent absence of IFN-γ and IL-17A is mediated by a GM-CSF-driven eosinophilic inflammation.J Autoimmun. 2020 Nov;114:102507. doi: 10.1016/j.jaut.2020.102507. Epub 2020 Jun 24. J Autoimmun. 2020. PMID: 32593472 Free PMC article.
References
-
- Durrani OM, Meads CA, Murray PI. Uveitis: a potentially blinding disease. Ophthalmologica 2004; 218: 223–36. - PubMed
-
- Gritz DC, Wong IG. Incidence and prevalence of uveitis in Northern California; the Northern California Epidemiology of Uveitis Study. Ophthalmology 2004; 111: 491–500; discussion 500. - PubMed
-
- Nussenblatt RB WS. Uveitis: fundamentals and clinical practice. Edition r, Editor. Philadelphia: Mosby: (Elsevier; ); 2004.
-
- Caspi RR, Chan CC, Wiggert B, Chader GJ. The mouse as a model of experimental autoimmune uveoretinitis (EAU). Curr Eye Res 1990; 9 Suppl: 169–74. - PubMed
Publication types
MeSH terms
Substances
Grants and funding
LinkOut - more resources
Full Text Sources
Medical