. 2015 Aug 4:5:12001.
doi: 10.1038/srep12001.

Spatiotemporal regulation of Heterochromatin Protein 1-alpha oligomerization and dynamics in live cells

Affiliations

Spatiotemporal regulation of Heterochromatin Protein 1-alpha oligomerization and dynamics in live cells

Elizabeth Hinde et al. Sci Rep. .

Abstract

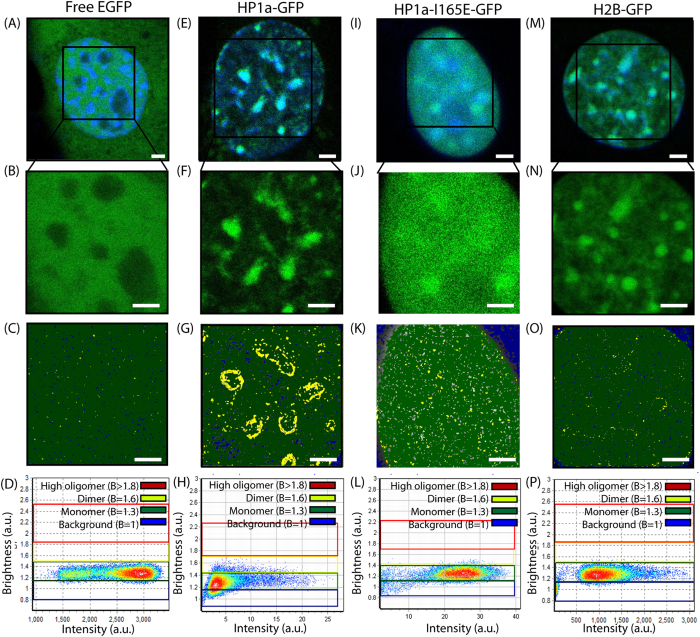
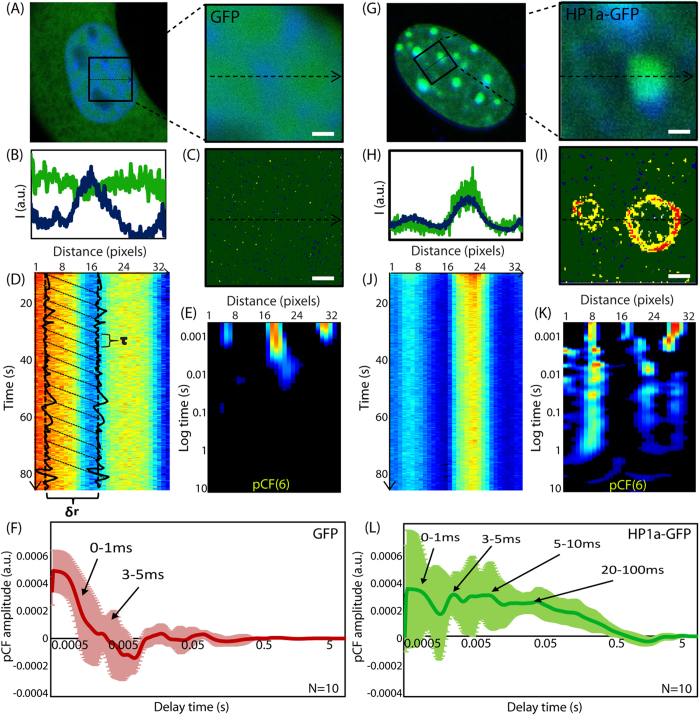
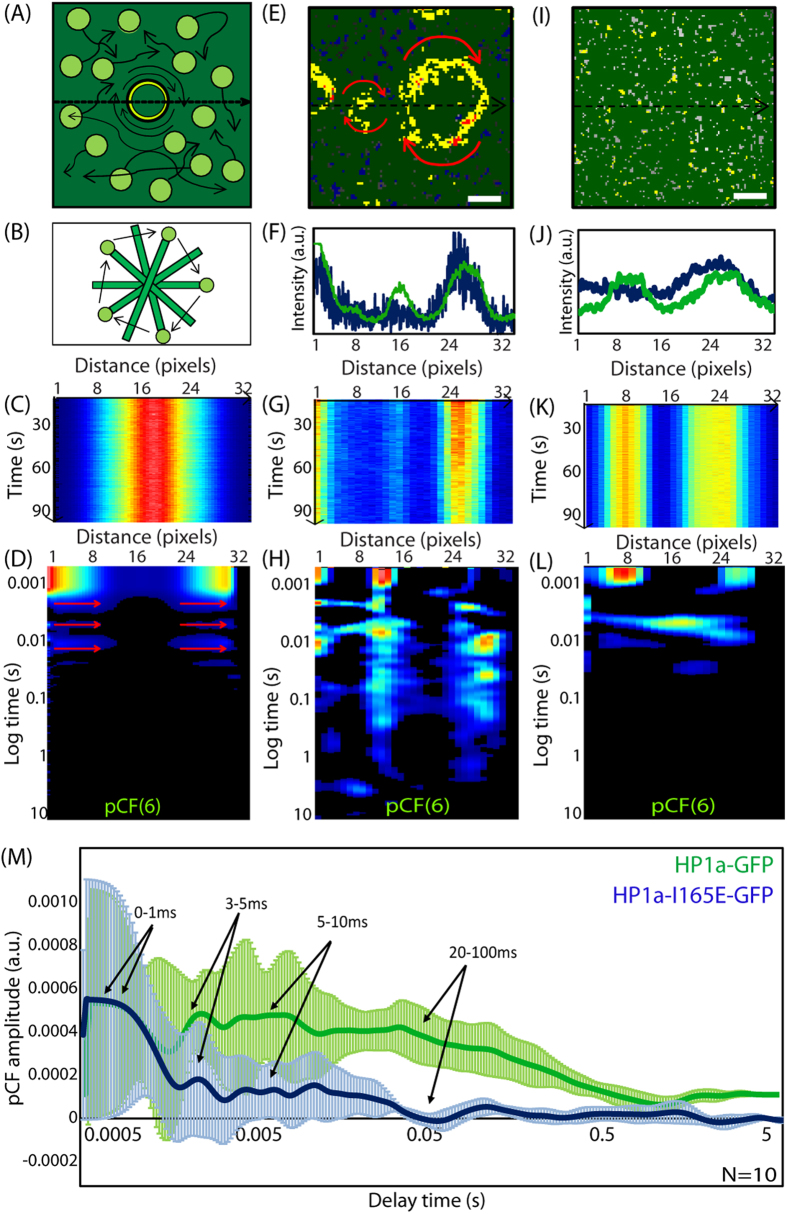
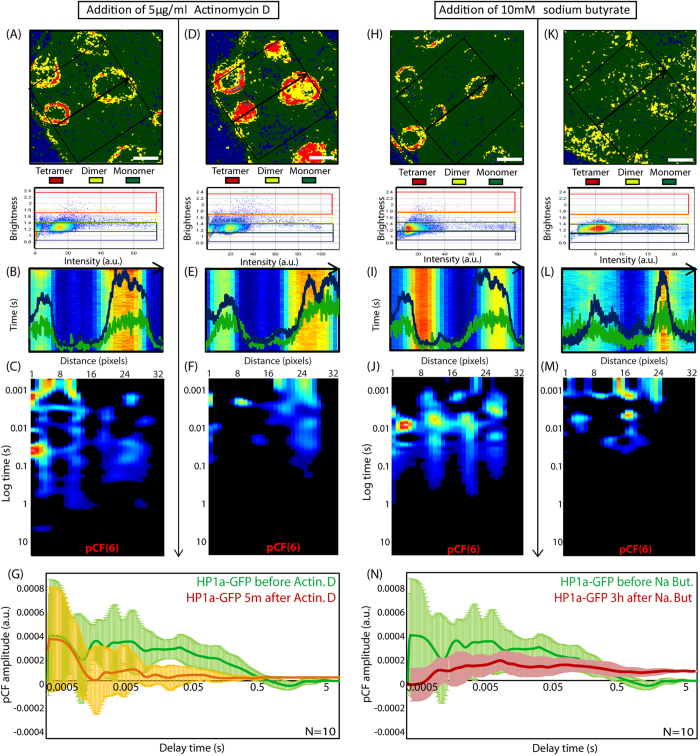
Heterochromatin protein 1 (HP1) is a central factor in establishing and maintaining the heterochromatin state. As consequence of playing a structural role in heterochromatin, HP1 proteins can have both an activating as well as repressive function in gene expression. Here we probe how oligomerisation of the HP1-α isoform modulates interaction with chromatin, by spatially resolved fluorescence correlation spectroscopy (FCS). We find from fluctuation analysis of HP1-α dynamics that this isoform exists as a dimer around the periphery of heterochromatin foci and these foci locally rotate with characteristic turn rates that range from 5-100 ms. From inhibition of HP1-α homo-oligomerization we find the slow turn rates (20-100 ms) are dimer dependent. From treatment with drugs that disrupt or promote chromatin compaction, we find that HP1-α dimers spatially redistribute to favor fast (5-10 ms) or slow (20-100 ms) turn rates. Collectively our results demonstrate HP1-α oligomerization is critical to the maintenance of heterochromatin and the tunable dynamics of this HP1 isoform.


Figures

Figure 1
Figure 1. Number and brightness analysis of HP1 alpha oligomerization.
(A) Intensity image of a NIH3T3 nucleus expressing free EGFP with the DNA stained by Hoechst 33342. (B) Region of interest from (A) selected for brightness analysis in the EGFP channel. (C) Region of interest in (B) pseudo-colored according to the brightness distribution of free EGFP in (D). As can be seen free EGFP only exists as a monomer throughout the nucleus. (E) Intensity image of a NIH3T3 nucleus expressing HP1-α-EGFP with the DNA stained by Hoechst 33342. (F) Region of interest from (E) selected for brightness analysis in the HP1-α-EGFP channel. (G) Region of interest in (F) pseudo-colored according to the brightness distribution of HP1α in (H). As can be seen dimers are located around the periphery of the heterochromatin foci. (I) Intensity image of a NIH3T3 nucleus expressing HP1-α-I165E-EGFP with the DNA stained by Hoechst 33342. (J) Region of interest from (I) selected for brightness analysis in the HP1-α-I165E-EGFP channel. (K) Region of interest in (J) pseudo-colored according to the brightness distribution of HP1-α-I165E-EGFP in (L). As can be seen HP1-α-I165E-EGFP is monomeric throughout the nucleus even at the periphery of heterochromatin foci. (M) Intensity image of a NIH3T3 nucleus expressing free H2B-EGFP with the DNA stained by Hoechst 33342. (N) Region of interest from (M) selected for brightness analysis in the H2B-EGFP channel. (O) Region of interest in (N) pseudo-colored according to the brightness distribution of H2B in (P). As can be seen H2B is monomeric throughout the nucleus even at the periphery of heterochromatin foci.
Figure 2
Figure 2. Pair correlation analysis of HP1 alpha molecular flow with respect to heterochromatin foci.
N&B analysis of HP1-α oligomerization. (A) Region of interest selected for pair correlation analysis in a NIH3T3 nucleus expressing free EGFP with the DNA stained by Hoechst 33342. (B) Intensity profile of free EGFP overlaid with the intensity profile of Hoechst 33342 along the selected region of interest reveals a heterochromatin region between pixels 8–16. (C) Region of interest in (A) pseudo-colored according to the brightness distribution of free EGFP (green = monomer, yellow = dimer, red = higher order oligomer). (D) Line scan acquired along the region of interest in the EGFP channel reveals an exclusion from the heterochromatin region. (E) Pair correlation analysis of free EGFP molecular flow with respect to a compact chromatin density region. (F) Average pair correlation profile for EGFP molecular flow in regions of heterochromatin foci (N = 10 cells) reveals molecular mobility on a time scale of 1–5 ms. (G) Region of interest selected for pair correlation analysis in a NIH3T3 nucleus expressing HP1-α-EGFP. (H) Intensity profile of HP1-α-EGFP overlaid with the intensity profile of Hoechst 33342 along the selected region of interest reveals a heterochromatin region between pixels 4–12 and 20–28. (I) Region of interest in (G) pseudo-colored according to the brightness distribution of HP1-α-EGFP (green = monomer, yellow = dimer, red = higher order oligomer). (J) Line scan acquired along the region of interest in the HP1-α-EGFP channel reveals a co-localisation with the heterochromatin regions. (K) Pair correlation analysis of HP1-α-EGFP molecular flow with respect to heterochromatin foci reveals multiple bands of correlation at the edges of the foci. pCF(6) in (E) and (G) indicates that pair correlation function is calculated at the distance of 6 pixels along the scanned line (see also Methods for further details). (L) Average pair correlation profile for HP1-α-EGFP molecular flow in regions of heterochromatin foci (N = 10 cells) molecular mobility on a timescale of 1–5 ms and then re-appearance due to a potential rotation from 5–10 ms and 20–100 ms.
Figure 3
Figure 3. HP1-α heterochromatin foci rotate at different turn rates that are dependent on dimerization.
(A) In vivo data suggests HP1-α to be bound to the edges of the heterochromatin foci as a dimer and foci to rotate with a characteristic time. (B) We simulate the rotating heterochromatin foci with a dimer periphery as a rotating stick with a fluorescent molecule on one end. (C) A simulated line scan acquired across the rotating stick results in a ‘heterochromatin foci’ between pixels 12–20. (D) Pair correlation analysis along the simulation line scan results in the multiple bands of correlation only at the ends of the simulated heterochromatin foci. (E) Brightness analysis of HP1-α dimerization around periphery of heterochromatin foci. (F) Intensity profile of free EGFP overlaid with the intensity profile of Hoechst 33342. (G) Line scan acquired along the region of interest in the HP1-α-EGFP channel reveals a co-localisation with the heterochromatin regions. (H) Pair correlation analysis of HP1-α-EGFP molecular flow reveals multiple bands of correlation at the edges of the foci. (I) Brightness analysis of HP1-α-I165E reveals loss of dimerization around periphery of heterochromatin foci. (J) Intensity profile of HP1-α-I165E-EGFP overlaid with the intensity profile of Hoechst 33342. (K) Line scan acquired along the region of interest in the HP1-α-I165E-EGFP channel reveals a co-localisation with the heterochromatin regions. (L) Pair correlation analysis of HP1-α-I165E-EGFP molecular flow reveals a loss of the long time scale bands of correlation at the edges of the foci. (M) Overlay of the average pair correlation profile for HP1-α-EGFP molecular flow (N = 10 cells) and HP1-α-I165E-EGFP molecular flow (N = 10 cells) in regions of heterochromatin foci, reveals the re-appearance of molecules on a timescale of 20–100 ms to be lost upon inhibition of dimerization.
Figure 4
Figure 4. Induction of chromatin compaction or loosening by drug treatment disrupts HP1-α oligomerization and molecular flow in both cases.
(A) Brightness analysis of HP1-α dimerization around periphery of heterochromatin foci. (B) Intensity profile of free EGFP and Hoechst 33342 superimposed over the line scan acquired across the heterochromatin foci in (A). (C) Pair correlation analysis of HP1-α-EGFP molecular flow reveals the multiple bands of correlation observed in Figs 2 and 3, at the edges of the foci. (D) Brightness analysis of HP1-α after treatment with Actinomycin D reveals HP1α to further oligomerize into a tetrameric form around the periphery of the heterochromatin foci. (E) Intensity profile of free EGFP and Hoechst 33342 superimposed over the line scan acquired across the heterochromatin foci in (D). (F) Pair correlation analysis of HP1-α-EGFP molecular flow after Actinomycin D treatment reveals the multiple bands of correlation observed in (C) to be disrupted. (G) Overlay of the average pair correlation profile for HP1-α-EGFP molecular flow before and after treatment with Actinomycrin D (N = 10 heterochromatin foci) reveals the re-appearance of molecules on a time scale of 20–100 ms to be inhibited. (H) Brightness analysis of HP1-α dimerization around periphery of heterochromatin foci. (I) Intensity profile of free EGFP and Hoechst 33342 superimposed over the line scan acquired across the heterochromatin foci in (H). (J) Pair correlation analysis of HP1-α-EGFP molecular flow reveals the multiple bands of correlation observed in Figs 2 and 3, at the edges of the foci. (K) Brightness analysis of HP1-α after treatment with Sodium Butyrate reveals HP1α oligomerization around the heterochromatin foci to be inhibited. (L) Intensity profile of free EGFP and Hoechst 33342 superimposed over the line scan acquired across the heterochromatin foci in (K). (M) Pair correlation analysis of HP1-α-EGFP molecular flow after treatment with sodium butyrate reveals the multiple bands of correlation in (L) to be disrupted. (N) Overlay of the average pair correlation profile for HP1-α-EGFP molecular flow before and after treatment with Sodium Butyrate (N = 10 heterochromatin foci) reveals the re-appearance of molecules on a time scale of 5–10 ms to be inhibited.

Similar articles

Cited by

References

    1. Muller K. P. et al.. Multiscale analysis of dynamics and interactions of heterochromatin protein 1 by fluorescence fluctuation microscopy. Biophys J 97, 2876–85 (2009). - PMC - PubMed
    1. Gorisch S. M., Wachsmuth M., Toth K. F., Lichter P. & Rippe K. Histone acetylation increases chromatin accessibility. J Cell Sci 118, 5825–34 (2005). - PubMed
    1. Baum M., Erdel F., Wachsmuth M. & Rippe K. Retrieving the intracellular topology from multi-scale protein mobility mapping in living cells. Nat Commun 5, 4494 (2014). - PMC - PubMed
    1. Di Rienzo C., Piazza V., Gratton E., Beltram F. & Cardarelli F. Probing short-range protein Brownian motion in the cytoplasm of living cells. Nat Commun 5, 5891 (2014). - PMC - PubMed
    1. Hinde E., Cardarelli F., Digman M. A. & Gratton E. In vivo pair correlation analysis of EGFP intranuclear diffusion reveals DNA-dependent molecular flow. Proc Natl Acad Sci U S A 107, 16560–5 (2010). - PMC - PubMed

Publication types

MeSH terms