. 2016 Mar;17(2):204-12.
doi: 10.1093/bib/bbv056. Epub 2015 Aug 3.

Normalization of circulating microRNA expression data obtained by quantitative real-time RT-PCR

Normalization of circulating microRNA expression data obtained by quantitative real-time RT-PCR

Francesco Marabita et al. Brief Bioinform. 2016 Mar.

Abstract

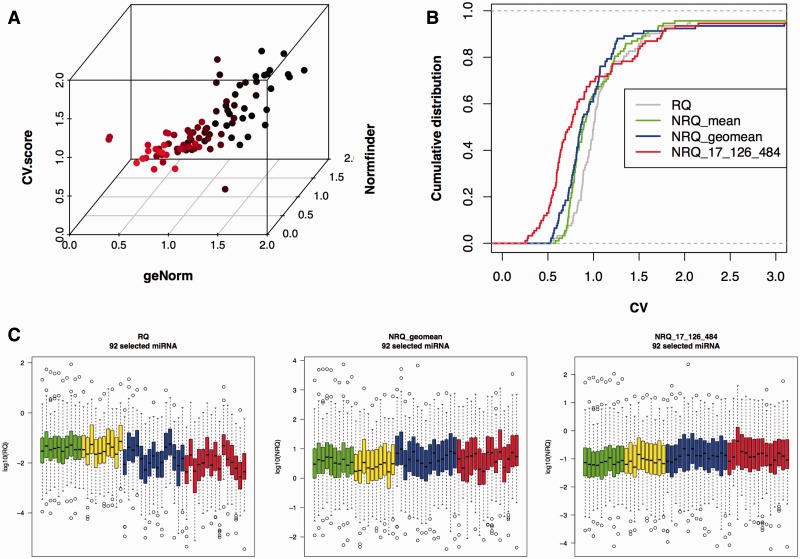
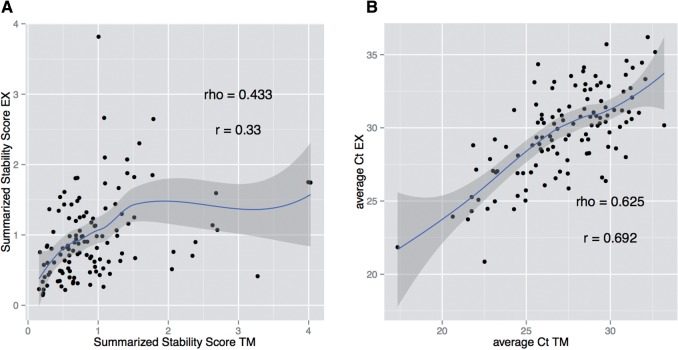
The high-throughput analysis of microRNAs (miRNAs) circulating within the blood of healthy and diseased individuals is an active area of biomarker research. Whereas quantitative real-time reverse transcription polymerase chain reaction (qPCR)-based methods are widely used, it is yet unresolved how the data should be normalized. Here, we show that a combination of different algorithms results in the identification of candidate reference miRNAs that can be exploited as normalizers, in both discovery and validation phases. Using the methodology considered here, we identify normalizers that are able to reduce nonbiological variation in the data and we present several case studies, to illustrate the relevance in the context of physiological or pathological scenarios. In conclusion, the discovery of stable reference miRNAs from high-throughput studies allows appropriate normalization of focused qPCR assays.

Keywords: Normfinder; circulating miRNA; geNorm; normalization; qPCR; reference genes.


Figures

Figure 1.
Figure 1.
Schematic representation of the normalization workflow.
Figure 2.
Figure 2.
Case study 1: Identification of stable normalizers and reduction of variability. (A) The three scores presented here are shown in a 3D scatterplot. (B) A cumulative distribution plot shows the reduction of the technical variability. The CV of RQ or NRQ was calculated for miRNAs detected in at least two-thirds of the samples. Data presented in the plot are either not normalized (RQ, gray line), normalized with the arithmetic mean (NRQ_mean, yellow line), geometric mean (NRQ_geomean, blue line) or with three stable controls (NRQ_17_126_484, red line). The left-shifted curves show a reduction on variability. (C) Box plots showing the distribution of RQ or NRQ for each sample, before and after normalization, for miRNAs detected in at least two-thirds of the samples. Each sample is colored according its biological group (green: healthy controls, yellow: chronic hepatitis, blue: liver cirrhosis, red: hepatocellular carcinoma). A colour version of this figure is available at BIB online: http://bib.oxfordjournals.org.
Figure 3.
Figure 3.
Case study 1: Validation of reference miRNA selection with PCA. PCA with autoscaled data shows independently that the combination of the presented algorithms is able to successfully identify stable miRNAs, which are grouped according to their variability. Blue spheres correspond to the top 10 stable miRNAs, while the red spheres correspond to the 10 most variable, according to the SSS. A colour version of this figure is available at BIB online: http://bib.oxfordjournals.org.
Figure 4.
Figure 4.
Case study 4: Platform comparison. (A) The SSS obtained with the two platforms is shown. Only miRNAs assayable and detected with both platforms in all samples were included. A loess smoothing and its confidence interval are shown. (B) Average Ct values are shown together with a loess smoothing and its confidence intervals.

References

    1. Mitchell PS, Parkin RK, Kroh EM, et al. Circulating microRNAs as stable blood-based markers for cancer detection. Proc Natl Acad Sci USA 2008;105:10513–18. - PMC - PubMed
    1. Chen X, Ba Y, Ma L, et al. Characterization of microRNAs in serum: a novel class of biomarkers for diagnosis of cancer and other diseases. Cell Res 2008;18:997–1006. - PubMed
    1. Mestdagh P, Hartmann N, Baeriswyl L, et al. Evaluation of quantitative miRNA expression platforms in the microRNA quality control (miRQC) study. Nat Methods 2014;11:809–15. - PubMed
    1. Pritchard CC, Kroh E, Wood B, et al. Blood cell origin of circulating microRNAs: a cautionary note for cancer biomarker studies. Cancer Prev Res (Phila) 2012;5:492–7. - PMC - PubMed
    1. Williams Z, Ben-Dov IZ, Elias R, et al. Comprehensive profiling of circulating microRNA via small RNA sequencing of cDNA libraries reveals biomarker potential and limitations. Proc Natl Acad Sci USA 2013;110:4255–60. - PMC - PubMed

MeSH terms