. 2015 Nov;24(11):2458-67.
doi: 10.1007/s00586-015-4172-y. Epub 2015 Aug 4.

Changes in perfusion and diffusion in the endplate regions of degenerating intervertebral discs: a DCE-MRI study

Affiliations

Changes in perfusion and diffusion in the endplate regions of degenerating intervertebral discs: a DCE-MRI study

Volkan Emre Arpinar et al. Eur Spine J. 2015 Nov.

Abstract

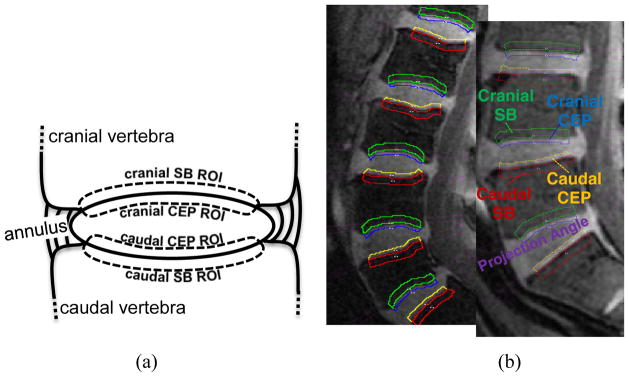
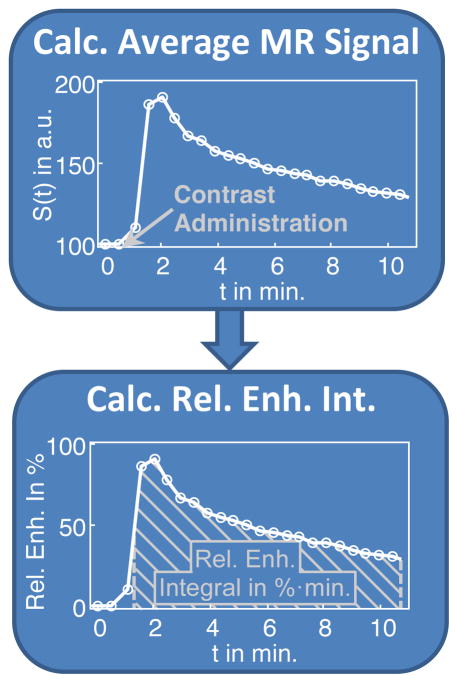
Purpose: Dynamic contrast-enhanced MRI (DCE-MRI) was used to investigate the associations between intervertebral disc degeneration and changes in perfusion and diffusion in the disc endplates.

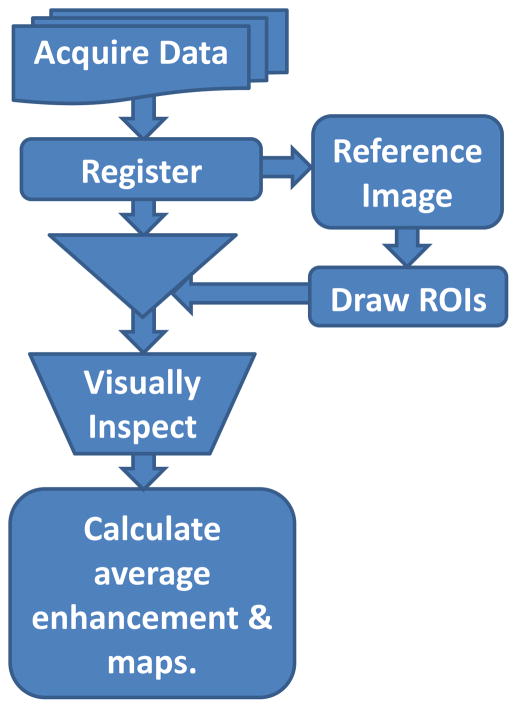
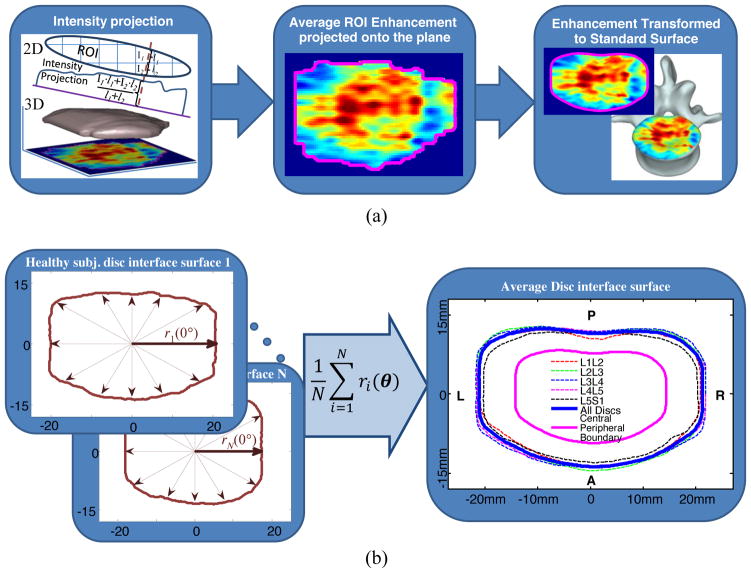
Methods: 56 participants underwent MRI scans. Changes in DCE-MRI signal enhancement in the endplate regions were analyzed. Also, a group template was generated for the endplates and enhancement maps were registered to this template for group analysis.

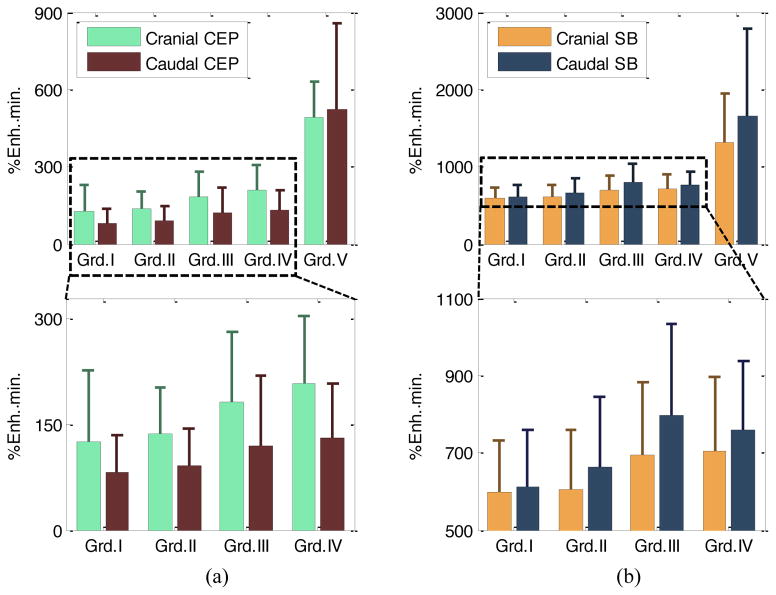
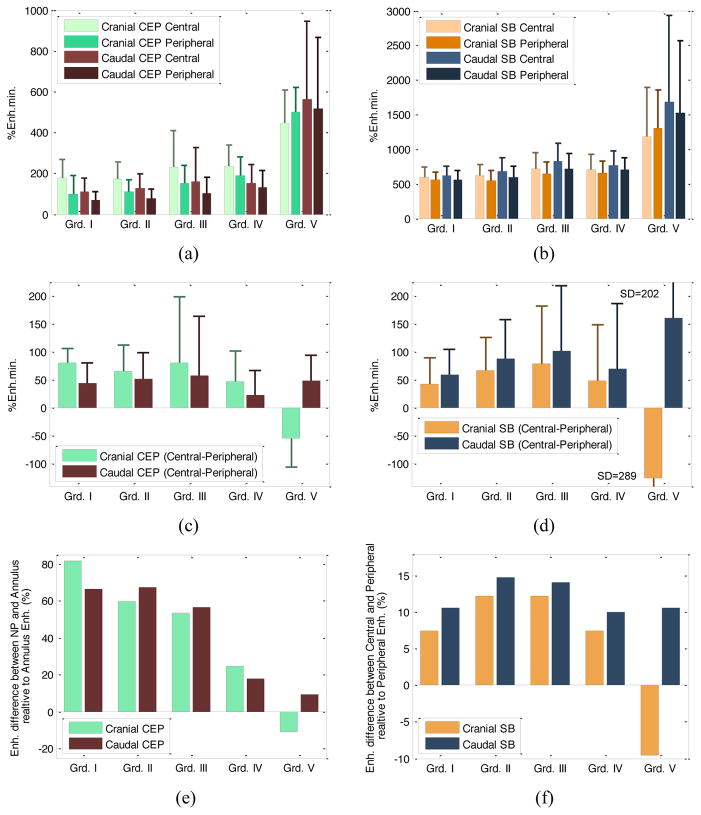
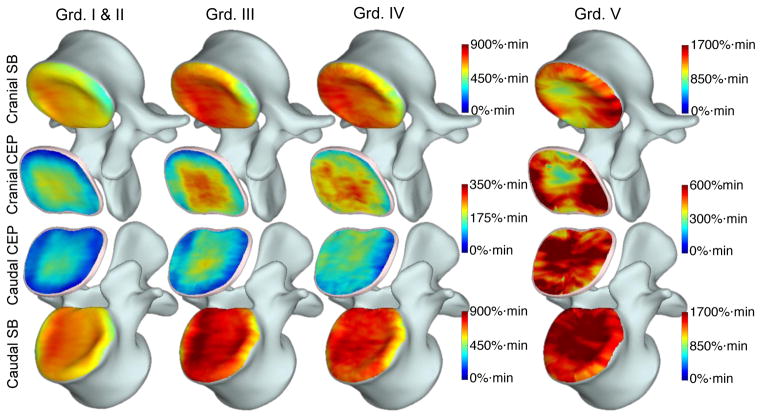
Results: DCE-MRI enhancement changed significantly in cranial endplates with increased degeneration. A similar trend was observed for caudal endplates, but it was not significant. Group-averaged enhancement maps revealed major changes in spatial distribution of endplate perfusion and diffusion with increasing disc degeneration especially in peripheral endplate regions.

Conclusions: Increased enhancement in the endplate regions of degenerating discs might be an indication of ongoing damage in these tissues. Therefore, DCE-MRI could aid in understanding the pathophysiology of disc degeneration. Moreover, it could be used in the planning of novel treatments such as stem cell therapy.

Keywords: Dynamic contrast-enhanced magnetic resonance imaging; Intervertebral disc degeneration; Intervertebral disc endplate; Lumbar spine.


Figures

Fig. 1
Fig. 1
Flow diagram of data processing pipeline.
Fig. 2
Fig. 2
(a) Schematic diagram of IVD and adjacent vertebral bodies and ROIs. ROIs were named according to their positions relative to the adjacent IVD. (b) ROIs and corresponding projection planes (magenta straight lines) are shown for two different subjects. Note the subject-to-subject variations in the geometry of endplate surfaces
Fig. 3
Fig. 3
Average MR signal within the ROI was converted to percent enhancement and the integral of the enhancement curve was calculated.
Fig. 4
Fig. 4
(a) Projection of voxel enhancement values onto a caudal plane and registration onto the template surface and mapping onto a representative vertebral body. (b) Schematic illustration of template surface generation using individual ROIs from healthy discs. The central region is shown with the magenta line and the peripheral region is the area between the magenta and the blue lines.
Fig. 5
Fig. 5
Mean and standard deviation of DCE-MRI enhancement for CEP ROIs (a), and SB ROIs (b) for Pfirrmann grades I to V (top panels). To illustrate changes from Grade I to IV in better detail, data from Grade V discs were excluded, and shown in the plots below. The range for y-axis for the SB regions was set between 500 and 1100 to show the dynamic range better. Note that different y-axis scales were used for CEP and SB regions because avascular CEPs have lower Gd-DTPA concentrations through diffusion.
Fig. 6
Fig. 6
Bar graphs of DCE-MRI enhancement for central and peripheral regions in CEP ROIs (a), and subchondral bone (SB) ROIs (b) for Pfirrmann grades I to V were shown. Note that different y-axis scales were used for CEP and SB regions. Enhancement differences (central-peripheral) were given in (c) and (d). In (e, f) mean enhancement difference (central-peripheral) relative to peripheral enhancement is shown.
Fig. 7
Fig. 7
Voxelwise enhancement maps in CEP and SB ROIs projected and transformed onto the template as described in Fig. 4. Enhancement maps were grouped according to the degeneration grade of the corresponding disc and averaged to generate these maps. Color bars are included next to the plots to describe colors used in these maps. Different scales were used for CEP and SB regions. Also note that CEP and SB regions around Grade V discs had substantially elevated enhancement, therefore the scales had to be almost doubled to capture the increased dynamic range.

References

    1. Luoma K, Riihimäki H, Luukkonen R, et al. Low back pain in relation to lumbar disc degeneration. Spine. 2000;25:487–492. - PubMed
    1. Adams MA, Roughley PJ. What is intervertebral disc degeneration, and what causes it? Spine. 2006;31:2151–2161. doi: 10.1097/01.brs.0000231761.73859.2c. - DOI - PubMed
    1. Rajasekaran S, Naresh-Babu J, Murugan S. Review of postcontrast MRI studies on diffusion of human lumbar discs. J Magn Reson Imaging. 2007;25:410–418. doi: 10.1002/jmri.20853. - DOI - PubMed
    1. Moon SM, Yoder JH, Wright AC, et al. Evaluation of intervertebral disc cartilaginous endplate structure using magnetic resonance imaging. Eur Spine J Off Publ Eur Spine Soc Eur Spinal Deform Soc Eur Sect Cerv Spine Res Soc. 2013;22:1820–1828. doi: 10.1007/s00586-013-2798-1. - DOI - PMC - PubMed
    1. Boos N, Weissbach S, Rohrbach H, et al. Classification of age-related changes in lumbar intervertebral discs: 2002 Volvo Award in basic science. Spine. 2002;27:2631–2644. doi: 10.1097/01.BRS.0000035304.27153.5B. - DOI - PubMed

Publication types

LinkOut - more resources