. 2015 Nov;78(5):710-21.
doi: 10.1002/ana.24497. Epub 2015 Aug 24.

Clinical and pathological insights into the dynamic nature of the white matter multiple sclerosis plaque

Affiliations

Clinical and pathological insights into the dynamic nature of the white matter multiple sclerosis plaque

Josa M Frischer et al. Ann Neurol. 2015 Nov.

Abstract

Objective: An extensive analysis of white matter plaques in a large sample of multiple sclerosis (MS) autopsies provides insights into the dynamic nature of MS pathology.

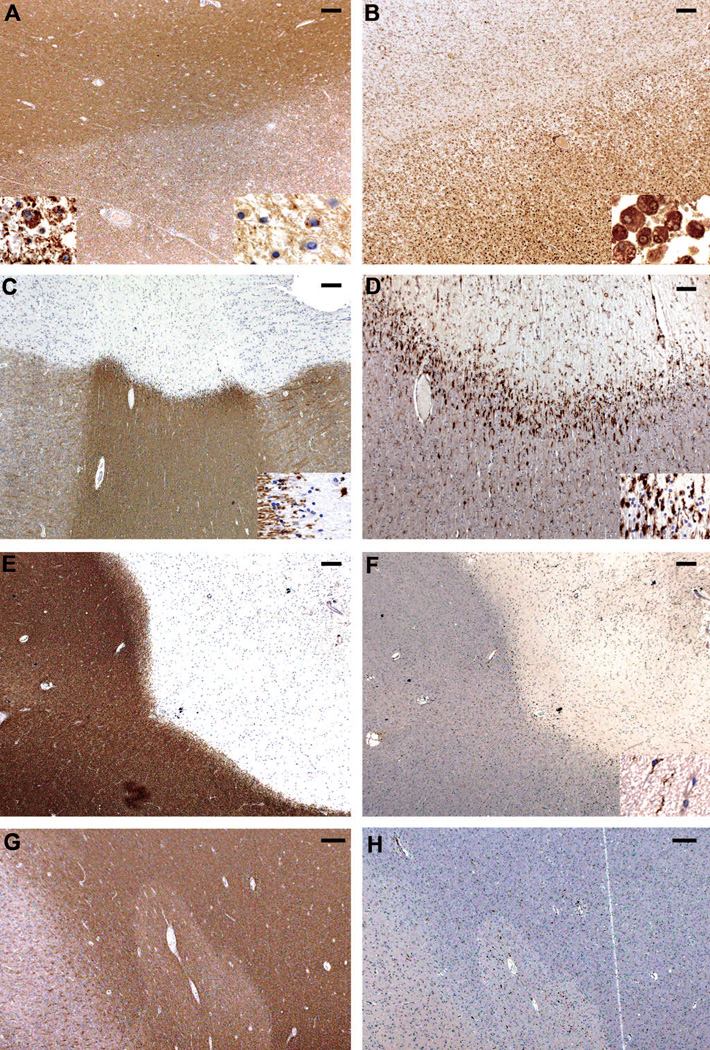
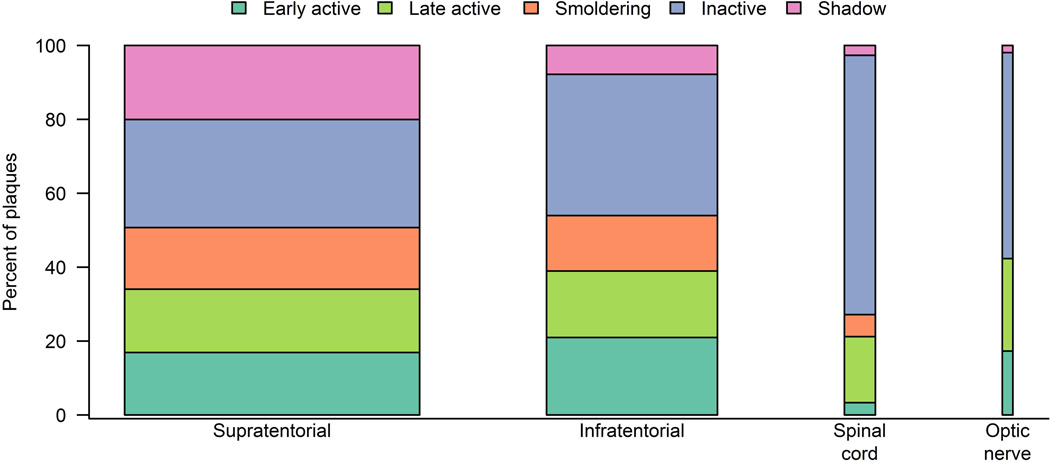
Methods: One hundred twenty MS cases (1,220 tissue blocks) were included. Plaque types were classified according to demyelinating activity based on stringent criteria. Early active, late active, smoldering, inactive, and shadow plaques were distinguished. A total of 2,476 MS white matter plaques were identified. Plaque type distribution was analyzed in relation to clinical data.

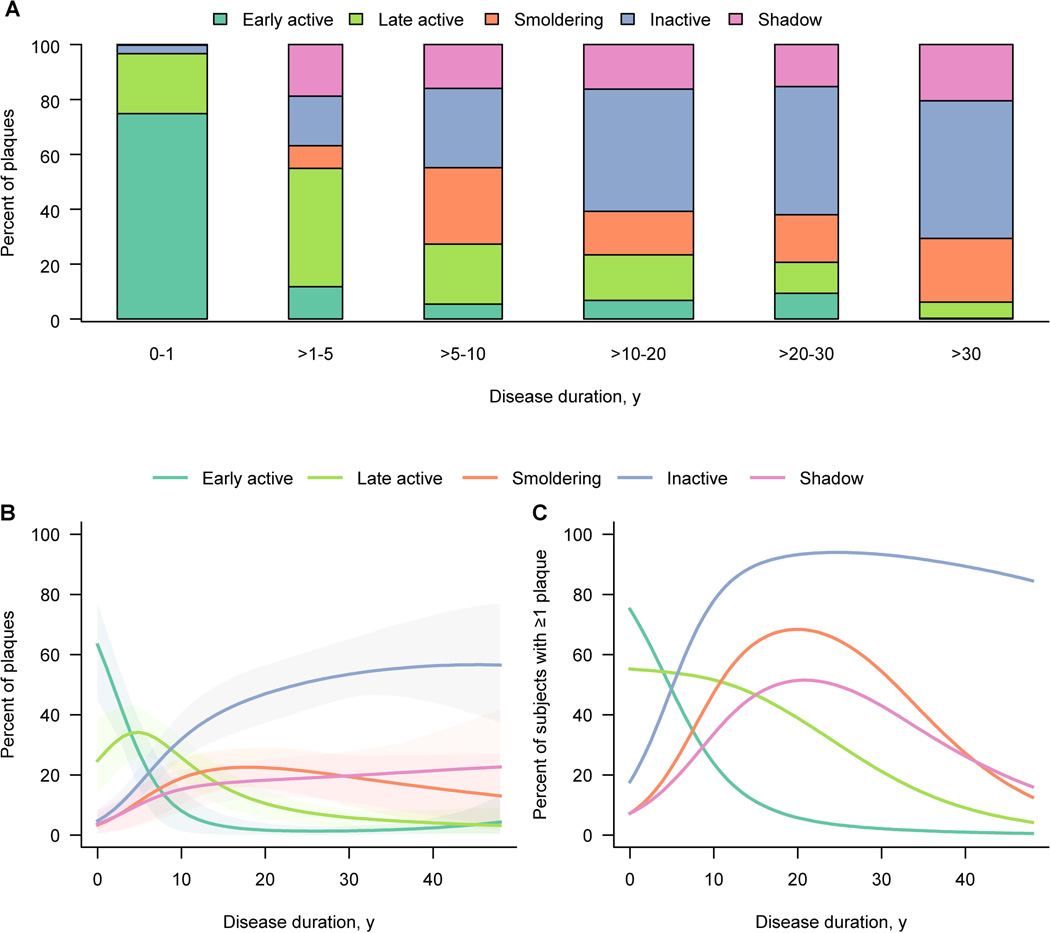
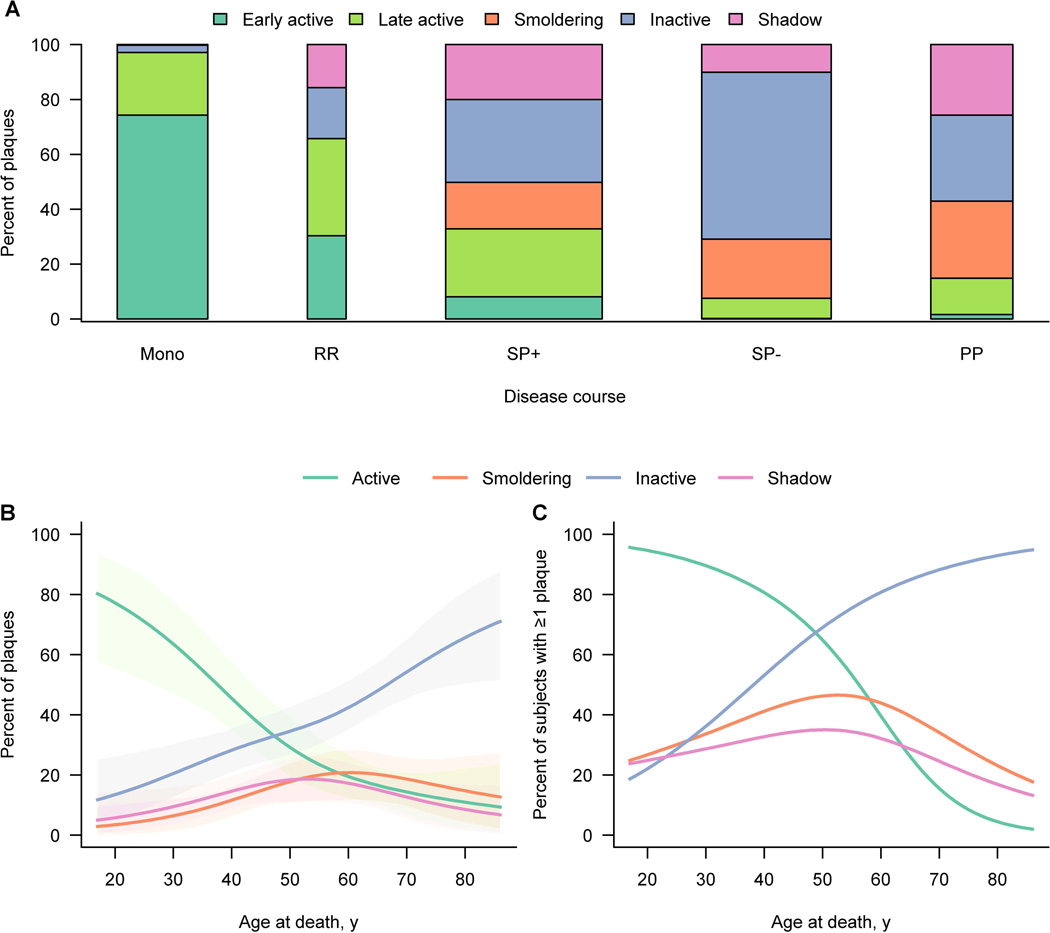
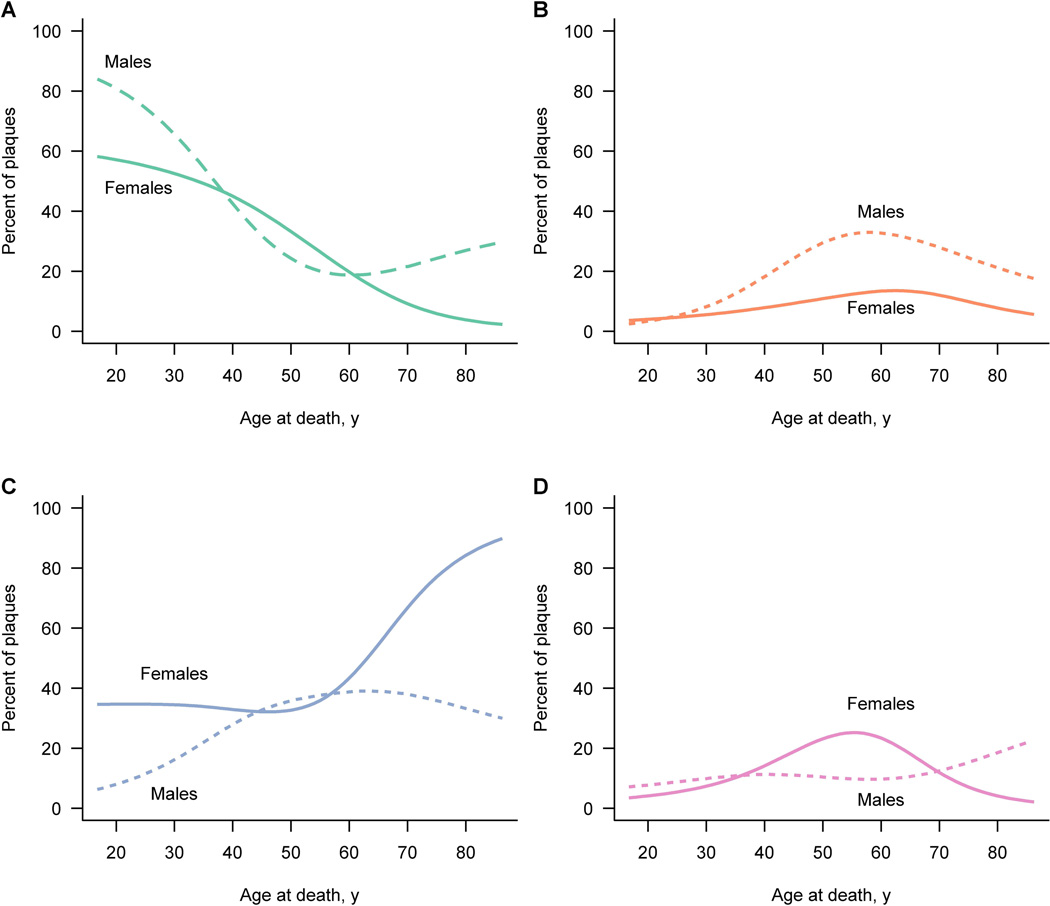
Results: Active plaques were most often found in early disease, whereas at later stages, smoldering, inactive, and shadow plaques predominated. The presence of early active plaques rapidly declined with disease duration. Plaque type distribution differed significantly by clinical course. The majority of plaques in acute monophasic and relapsing-remitting MS (RRMS) were active. Among secondary progressive MS (SPMS) cases with attacks, all plaque types could be distinguished including active plaques, in contrast to SPMS without attacks, in which inactive plaques predominated. Smoldering plaques were frequently and almost exclusively found in progressive MS. At 47 years of age, an equilibrium was observed between active and inactive plaques, whereas smoldering plaques began to peak. Men displayed a higher proportion of smoldering plaques.

Interpretation: Disease duration, clinical course, age, and gender contribute to the dynamic nature of white matter MS pathology. Active MS plaques predominate in acute and early RRMS and are the likely substrate of clinical attacks. Progressive MS transitions to an accumulation of smoldering plaques characterized by microglial activation and slow expansion of pre-existing plaques. Whether current MS therapeutics impact this pathological driver of disease progression remains uncertain.


Figures

Figure 1
Figure 1. Characterization of plaque types
Figure 1 gives an overview of plaque types. Left pannel (A, C, E, G) depicts PLP staining. Right pannel (B, D, F, H) shows staining for KiM1P positive microglia / macrophages. Characterization of plaque types reflects the demyelinating activity of each plaque. Bar in A-C, E-H= 200µm, Bar in D=100 µm. (A, B) Early active plaques (EAL) were defined by macrophages immunoreactive for minor myelin proteins (MOG positive macrophages right insert in A) as well as major myelin proteins (PLP positive macrophages left insert in A). (C, D) Smoldering plaques (also called slowly expanding plaques) typically showed a rather inactive centre with no or few macrophages, surrounded by a rim of activated microglia. Only few of these macrophages or microglia cells contained early myelin degradation products. Inserts depict plaque edge. (E, F) Inactive plaques revealed a sharp plaque border without or only few macrophages or activated microglia (insert). (G, H) Completely remyelinated plaques typically containing few macrophages without early myelin degradation products were classified as shadow plaques. Shadow plaques presented with a sharp plaque edge and were associated with fibrillary gliosis.
Figure 2
Figure 2. Distribution of plaque location
Figure 2 shows the distribution of plaque location. Bar widths indicate relative sample size. The majority of plaques (n=1439, 58%) were located supratentorial. A fair amount of plaques were found infratentorial (n=834, 34%). Additional plaques were found in the spinal cord (n=151, 6%) and in the optic nerve (n=52, 2%). Plaque type distribution was rather similar across block locations between supratentorial and infratentorial white matter. When using separate logistic regression models adjusted for age and disease duration, no regional differences were found for active plaques including specifically testing for early active or late active plaques. Differences were only observed among smoldering and inactive lesions: Lesions in the spinal cord were more likely to be inactive (p < 0.001, p=0.002) compared to supratentorial and infratentorial lesions. Lesions in the spinal cord were less likely to be smoldering (p=0.02) compared to supratentorial lesions. However, smoldering and inactive plaques were also both equally distributed between the supratentorial and the infratentorial white matter.
Figure 3
Figure 3. Distribution of plaque types by disease duration
(A) The bar plot shows the actual plaque distribution in relation to disease duration. The percentages shown for each subgroup or bar are calculated among all plaques for those subjects within the subgroup. Bar width is related to subgroup size. On multinomial modeling plaque type distribution differs significantly (p < 0.0001) among disease duration subgroups. (B) Graph B provides estimates of the percentage of plaques by type expressed as a function of the patient’s disease duration using multinomial modeling accounting for clustering of plaques within patient. Percentages across the curves add to 100 percent at a given duration. Shaded regions represent 95% cluster bootstrap confidence intervals. Significant differences are observed (p < 0.0001) based on multinomial modeling. (C) In graph C the estimated proportion of patients with at least one of each plaque type as a function of disease duration is depicted. Estimates are based on separate logistic regression models at the patient level. Percentages across the curves add to more than 100 percent since subjects could have at least one of several types of plaques.
Figure 4
Figure 4. Distribution of plaque types by disease course and age
(A) The bar plot shows the actual plaque distribution in relation to clinical course. The percentages shown for each subgroup or bar are calculated among all plaques for those subjects within the subgroup. Bar width is related to subgroup size. On multinomial modeling plaque type distribution differs significantly (p < 0.0001) among disease courses. (B) Graph B provides estimates of the percentage of plaques by type expressed as a function of the patient’s age at death using multinomial modeling accounting for clustering of plaques within patient. Percentages across the curves add to 100 percent at a given age. Shaded regions represent 95% cluster bootstrap confidence intervals. Early active and late active plaques are pooled as active plaques. Significant differences are observed (p < 0.0001) based on multinomial modeling. (C) In graph C the estimated proportion of patients with at least one of each plaque type as a function of age is depicted. Estimates are based on separate logistic regression models at the patient-level. Percentages across the curves add to more than 100 percent since subjects could have at least one of several types of plaques. Early active and late active plaques are pooled as active plaques.
Figure 5
Figure 5. Gender differences in plaque type distribution
Figure 5 depicts the estimated percent of each plaque type by age at death for males and females separately based on a multinomial regression model accounting for clustering of plaques within patient. Estimates for women are denoted by a solid line while estimates for men are denoted by a dotted line.

References

    1. Noseworthy JH, Lucchinetti C, Rodriguez M, Weinshenker BG. Multiple sclerosis. N Engl J Med. 2000;343(13):938–952. - PubMed
    1. Lassmann H, Bruck W, Lucchinetti CF. The immunopathology of multiple sclerosis: an overview. Brain Pathol. 2007;17(2):210–218. - PMC - PubMed
    1. Lassmann H, van Horssen J, Mahad D. Progressive multiple sclerosis: pathology and pathogenesis. Nat Rev Neurol. 2012;8(11):647–656. - PubMed
    1. Popescu BF, Lucchinetti CF. Pathology of demyelinating diseases. Annu Rev Pathol. 2012;7:185–217. - PubMed
    1. Kutzelnigg A, Lassmann H. Cortical lesions and brain atrophy in MS. J Neurol Sci. 2005;233(1–2):55–59. - PubMed

Publication types