. 2015 Nov;67(11):3004-15.
doi: 10.1002/art.39287.

A longitudinal biomarker for the extent of skin disease in patients with diffuse cutaneous systemic sclerosis

Affiliations

A longitudinal biomarker for the extent of skin disease in patients with diffuse cutaneous systemic sclerosis

Lisa M Rice et al. Arthritis Rheumatol. 2015 Nov.

Abstract

Objective: To define a pharmacodynamic biomarker based on gene expression in skin that would provide a biologic measure of the extent of disease in patients with diffuse cutaneous systemic sclerosis (dcSSc) and could be used to monitor skin disease longitudinally.

Methods: Skin biopsy specimens obtained from a cohort of patients with dcSSc (including longitudinal specimens) were analyzed by microarray. Expression of genes correlating with the modified Rodnan skin thickness score (MRSS) were examined for change over time using a NanoString platform, and a generalized estimating equation (GEE) was used to define and validate longitudinally measured pharmacodynamic biomarkers composed of multiple genes.

Results: Microarray analysis of genes parsed to include only those correlating with the MRSS revealed prominent clusters of profibrotic/transforming growth factor β-regulated, interferon-regulated/proteasome, macrophage, and vascular marker genes. Using genes changing longitudinally with the MRSS, we defined 2 multigene pharmacodynamic biomarkers. The first was defined mathematically by applying a GEE to longitudinal samples. This modeling method selected cross-sectional THBS1 and longitudinal THBS1 and MS4A4A. The second model was based on a weighted selection of genes, including additional genes that changed statistically significantly over time: CTGF, CD163, CCL2, and WIF1. In an independent validation data set, biomarker levels calculated using both models correlated highly with the MRSS.

Conclusion: Skin gene expression can be used effectively to monitor changes in SSc skin disease over time. We implemented 2 relatively simple models on a NanoString platform permitting highly reproducible assays that can be applied directly to samples from patients or collected as part of clinical trials.


Figures

Figure 1
Figure 1. Genes clustering with components of the four-gene biomarker
Genes selected from genes clustering with COMP/THBS1 (top panel, see Fig. 1s for all genes in this cluster) and SIGLEC1 (bottom panel, see Fig. 2s for all genes in this cluster) after unsupervised clustering of genes and subjects after selection of genes showing a correlation with the MRSS ≥ 0.4. The MRSS added into the gene set before normalization and clustering appears in the heatmap of the COMP/THBS1 cluster, with the numerical MRSS values show in “SKIN SCORE” between the two clusters. Four-gene biomarker genes are highlighted in yellow (COMP, THBS1, and SIGLEC1). Subjects (25 SSc patients and 4 healthy controls) analyzed are shown at the top of the figure. Red indicates up-regulated expression, green indicates down-regulated expression.
Figure 2
Figure 2. Additional profibrotic and proteasome gene clusters
Genes selected from genes clustering with PAI1 (serpin peptidase inhibitor, clade E) and CTGF (connective tissue growth factor) are shown in the Profibrotic II cluster (panel A) after unsupervised clustering as in Figure 1. Genes selected from genes clustering with major histocompatibility complex, class I are shown in the MHCI/proteasome cluster (panel B). Pearson correlations are shown to the left of each gene.
Figure 3
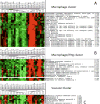
Figure 3. Macrophage and vascular gene clusters
Selected genes from a cluster of genes showing recognizable macrophage (panel A), macrophage and IFNγ-regulated genes (panel B), and genes associated with endothelium (Panel C) after unsupervised clustering as described in Figure 1. Genes selected from genes clustering with major histocompatibility complex, class I are shown in the MHCI/proteasome cluster. Pearson correlations are shown to the left of each gene.
Figure 4
Figure 4. Relationship between expression of biomarker genes and the MRSS
Correlations (Pearson’s) between nanostring mRNA skin gene expression and the MRSS in skin biopsies from patients with dcSSc (n=63). Values are stratified according to disease duration at time of biopsy; blue squares ≤ 24 months, pink squares ≤ 36 months, and open circles ≥ 37 months. Data are shown as R-values.
Figure 5
Figure 5. Comparisons of gene expression in longitudinal skin biopsies from dcSSc patients with MRSS
Panel A shows the pairwise correlation matrix of clinical characteristics and absolute change in mRNA gene expression from baseline. The color indicates direction of correlation (red= negative, blue= positive); the magnitude of the correlation is indicated by the percentage of the filled circle and intensity of shading. Variables are ordered using principal components analysis. Panel B shows the significance of association cross-sectionally and longitudinally of baseline gene expression and change in gene expression with MRSS values indicated in each graphic are p-values with beta coefficients and confidence intervals in Supplemental Table 5. Each color represents an individual patient followed over multiple visits.
Figure 6
Figure 6. Testing and validation of 2GSSc and Weighted Models
Graphs show correlations between 2GSSc biomarker score derived using the 2GSSc Model equation (panels A: p<0.0001 and B: p<0.0001) or the WSSc biomarker score using the Weighted Model equation (panels C: p=0.0002 and D: p<0.0001) and the clinically assessed MRSS. Values used to develop the models are from Boston Medical Center patients (panels A and C). Values used to validate the models are from Hospital for Special Surgery patients (panels B and D). R-values are indicated on each panel. Panel E. Histological features of skin were scored and compared to the MRSS, the 2GSSc biomarker score, the WSSc biomarker score, or genes making up the biomarker scores (THBS1, ADAM12, CCL2, CD163, CTGF, MS4A4A, and WIF1). Correlations between histological fibrosis and inflammation are charted in the corrgram with R-values as shown, The extent and shading of blue indicates the degree of positive correlations, the extent and shading of red the degree of negative correlations.

Comment in

References

    1. Farina G, Lafyatis D, Lemaire R, et al. A four-gene biomarker predicts skin disease in patients with diffuse cutaneous systemic sclerosis. Arthritis and rheumatism. 2010;62(2):580–8. doi: 10.1002/art.27220. [published Online First: Epub Date]|. - DOI - PMC - PubMed
    1. Gordon JK, Magr C, Udeh U, et al. Nilotinib (Tasigna™) In The Treatment Of Early Diffuse Systemic Sclerosis: A Single Group, Open Label Pilot Clinical Trial – One Year Results. American College of Rheuamtology Meeting Abstracts. 2013:709.
    1. Friendly M. Corrgrams: Exploratory Displays for Correlation Matrices. Tha American Statistician. 2002;56:316–24.
    1. Wright K. Corrgram: Plot a correlogram. R package version 1.6. 2014 http://CRAN.R-project.org/package=corrgram.
    1. McGraw KO, Wong SP. Forming inferences about some intraclass correlation coefficients. Psychological Methods. 1996;1:30–46.

Publication types