. 2015 Dec;25(12):1335-49.
doi: 10.1093/glycob/cwv058. Epub 2015 Aug 3.

Analysis of site-specific N-glycan remodeling in the endoplasmic reticulum and the Golgi

Affiliations

Analysis of site-specific N-glycan remodeling in the endoplasmic reticulum and the Golgi

Ivan Hang et al. Glycobiology. 2015 Dec.

Abstract

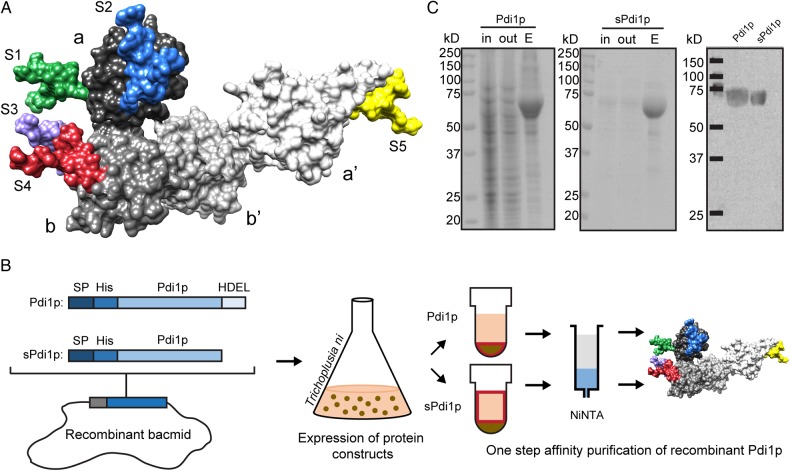
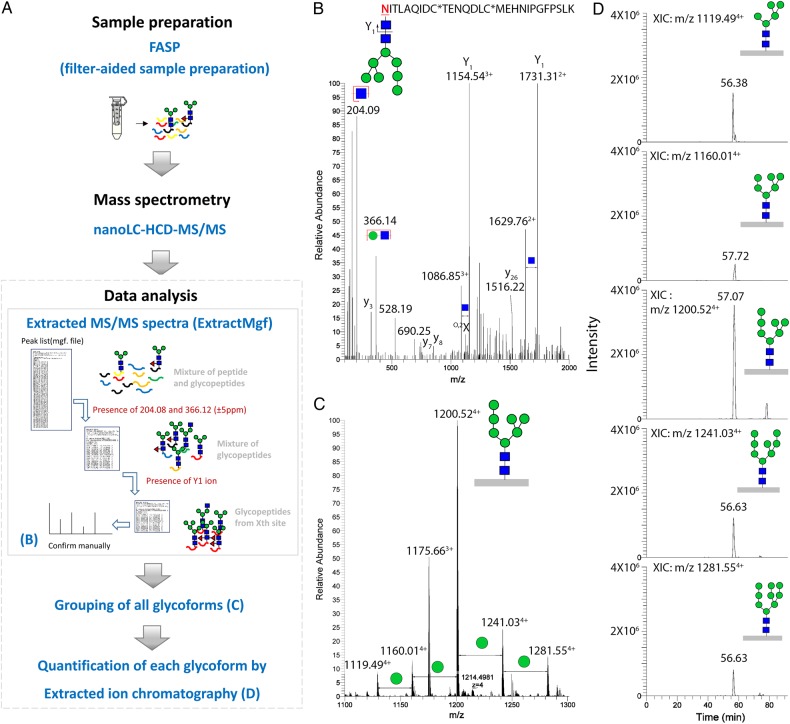
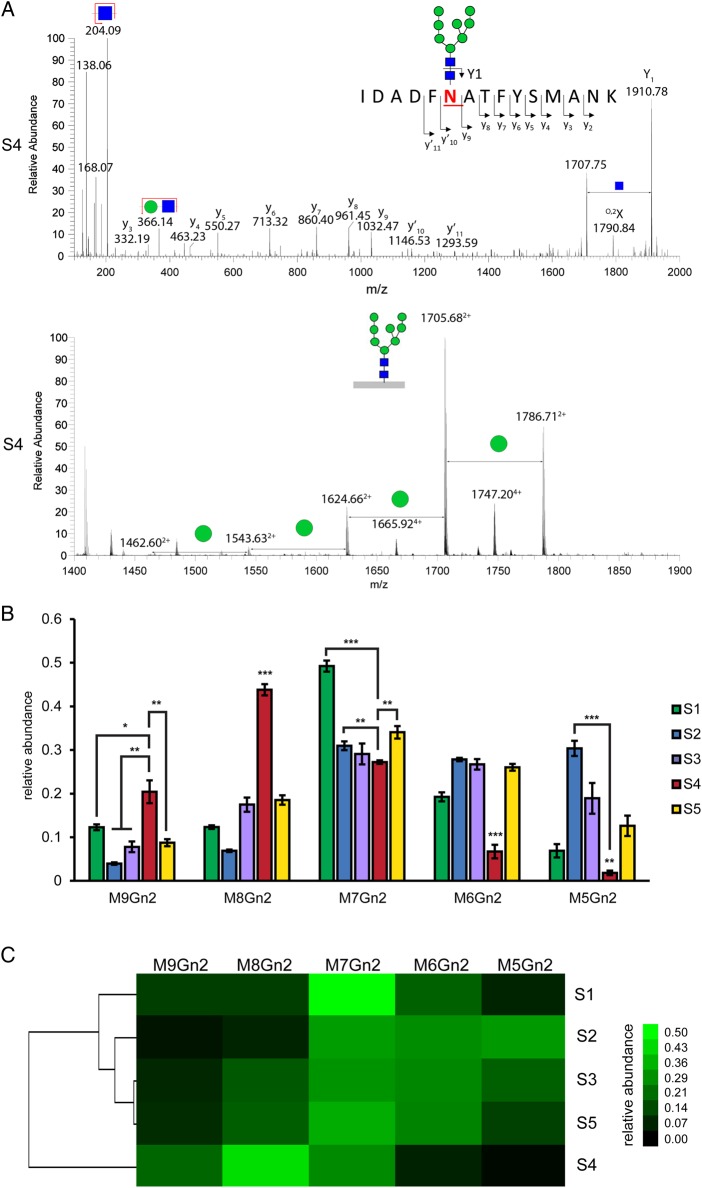
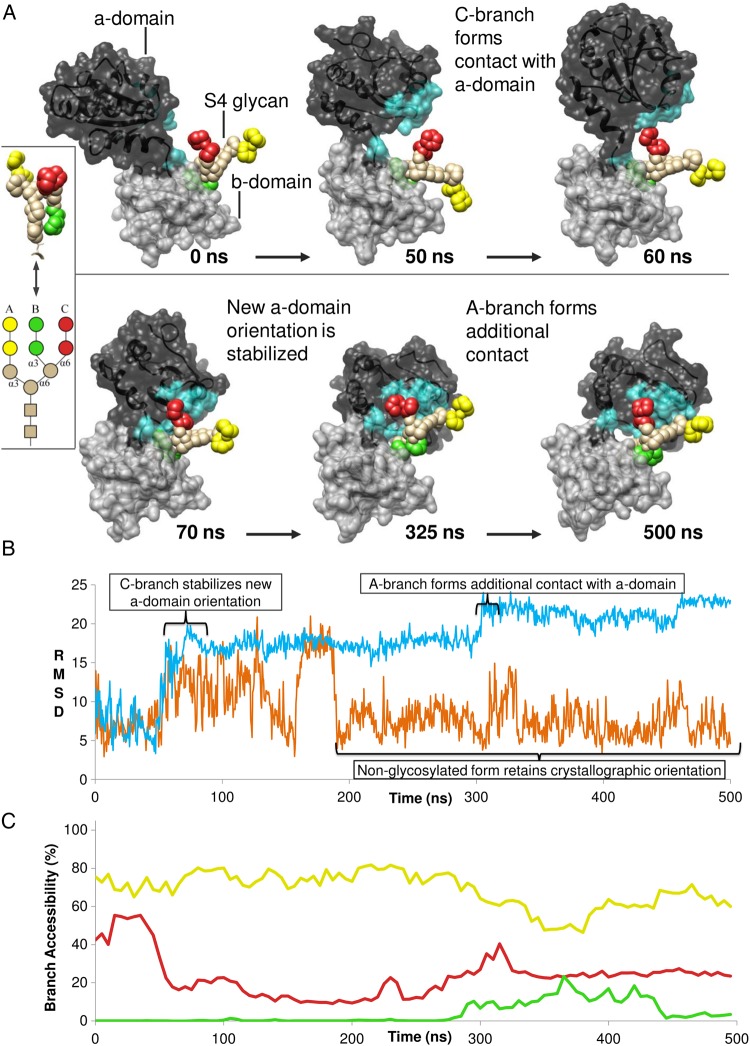
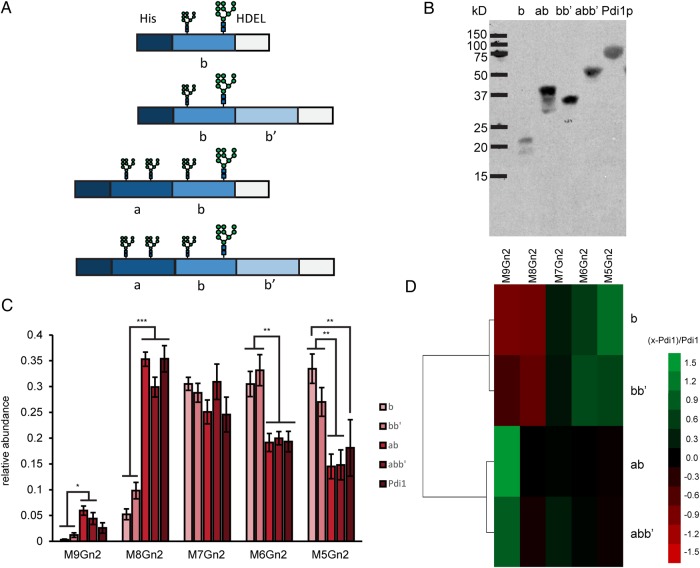
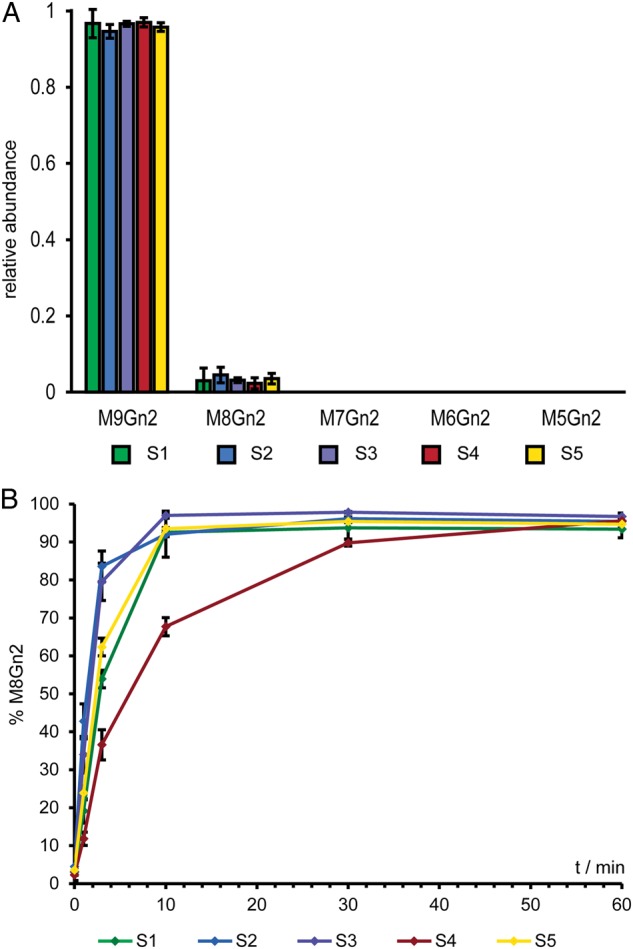
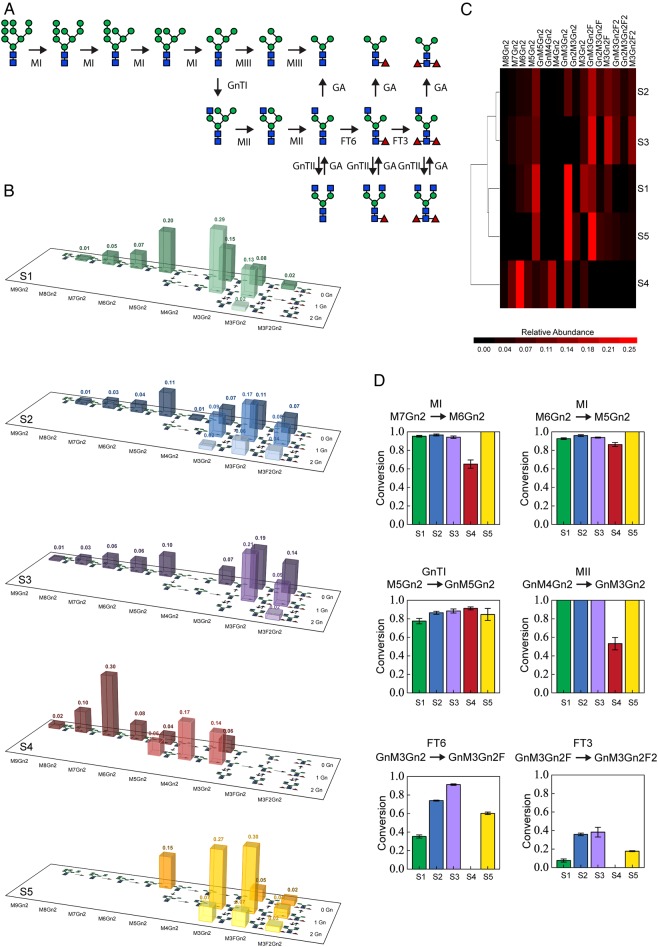
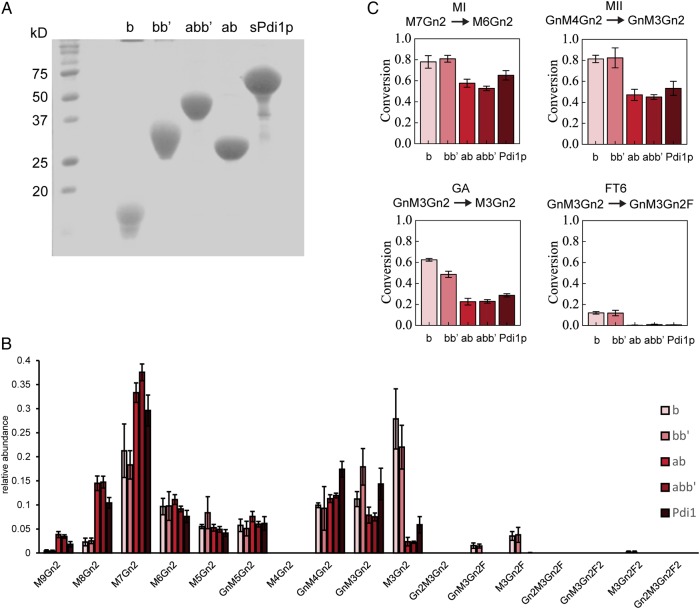
The hallmark of N-linked protein glycosylation is the generation of diverse glycan structures in the secretory pathway. Dynamic, non-template-driven processes of N-glycan remodeling in the endoplasmic reticulum and the Golgi provide the cellular setting for structural diversity. We applied newly developed mass spectrometry-based analytics to quantify site-specific N-glycan remodeling of the model protein Pdi1p expressed in insect cells. Molecular dynamics simulation, mutational analysis, kinetic studies of in vitro processing events and glycan flux analysis supported the defining role of the protein in N-glycan processing.

Keywords: Golgi; Golgi glycosylation; endoplasmic reticulum glycosylation; site-specific glycosylation.


Figures

Fig. 1.
Fig. 1.
Purification of recombinant Pdi1 and sPdi1p from insect cells. (A) Model of glycosylated Pdi1p. M9Gn2 N-glycans were modelled onto the five glycosites of the crystal structure of Pdi1p (PDB: 2B5E; www.glycam.org). Glycans are depicted in colors: S1 green, S2 blue, S3 purple, S4 red and S5 yellow. Different domains of Pdi1p are in different shades of gray. (B) Schematic representation of Pdi1p and sPdi1p purification. Trichoplusia ni cells were infected with recombinant viruses carrying expression copies of ER retained Pdi1p or secreted Pdi1p (sPdi1p). Pdi1p was purified via NiNTA chromatography from cell lysates; sPdi1p was isolated from culture supernatants. ER retention of full-length sPdi1p was disrupted by the presence of two additional amino acids at the protein's C-terminus (HDELLE) (Raykhel et al. 2007). SP: signal peptide; His: His10 tag, HDEL: ER retrieval signal. (C) Purification of Pdi1p and sPdi1p. Samples of input (in), flow-through (out) and eluted (E) fractions were analyzed by SDS–PAGE and stained with Coomassie (left/middle), or analyzed by immunoblot using anti-His5 antibodies (right).
Fig. 2.
Fig. 2.
Overall workflow for glycopeptide analysis by mass spectrometry. (A) Purified proteins were processed by FASP. The mixture of peptides and glycopeptides was analyzed by LC-HCD mass spectrometry. Raw data were transformed into a peak list and processed by ExtractMgf. For relative quantification, XIC of each glycoform was plotted and its corresponding peak area was integrated. The relative abundance of each form was calculated. Symbols represent monosaccharides: mannose (circle), N-acetylglucosamine (square) and fucose (triangle) (B) One MS/MS spectrum at m/z 1200.54 (z = 4) was assigned to the first glycosylation site of Pdi1p containing M7Gn2 glycoform. Glycan oxonium ions and doubly/triply charged Y1 at m/z 1154.54 (z = 3)/1731.31(z = 2) are indicated. The nomenclature of peptide fragment ions and glycan fragmentation ions was described previously (Roepstorff and Fohlman 1984; Domon et al. 1990; Dell et al. 1994). (C) The overall glycosylation profile of S1 obtained by grouping of MS spectra. Corresponding ions are indicated. (D) XIC of each glycoform sharing the same peptide backbone. See Supplementary data, Figure S2 and Table S2 for quantification of RNaseB glycans. (B–D) The structures of glycan isomers were assigned according to the biosynthesis pathway of insect cells shown in Figure 7A. This figure is available in black and white in print and in color at Glycobiology online.
Fig. 3.
Fig. 3.
Pdi1p retained in the ER and early Golgi displays site-specific glycan profiles. (A) Analysis of M8Gn2 on S4. The MS/MS spectrum of m/z 1705.68 (z = 2) was obtained as described in Figure 2. The peptide was identified by the Y1 ion (S4 peptide plus HexNAc at m/z 1910.78). The peptide sequence is displayed together with the attached M8Gn2 glycan. The underlined N represents the N-glycosite and y′ represents y ion without a glycan. (B) Site-specific N-glycan profile of Pdi1p. Pdi1p was expressed and purified and site-specific glycan profiles were analyzed. The relative abundance of the different glycoforms at a given site (S1 to S5) is shown. Data represent the mean values of glycan ratios of four independent experiments with error bars indicating the standard deviation. P-values were calculated by paired Student's t-test: * P < 0.05; ** P < 0.01; *** P < 0.001. (C) Similarity representation of five Pdi1p N-glycosylation sites based on the relative glycoform distribution. Similarity between site-specific profiles was calculated using the Euclidean distance and the dendogram was obtained by Centroid Linkage Clustering. The color scale represents the relative glycoform abundance from Figure 3B. See Supplementary data, Figure S3 and Table S3 for spectra and raw data. This figure is available in black and white in print and in color at Glycobiology online.
Fig. 4.
Fig. 4.
Molecular dynamics simulation of glycosylated Pdi1p-ab. (A) Six snapshots from the molecular dynamics simulation of the S4 glycosylated ab-domain variant of Pdi1p, showing the contacts formed between the S4 glycan and the a-domain (blue surface). The b-domains of each snapshot are aligned to the crystal structure coordinates. The glycan is shown as van-der-Waals spheres, with the A-branch in yellow, the B-branch in green and the C-branch in red. (B) A plot of the RMSD of the a-domain obtained over the course of the simulation relative to the crystal structure orientation (blue line: RMSD of the a-domain with S4 glycosylated, orange line: RMSD of a-domain without S4 glycosylation). (C) The relative solvent accessibility of the non-reducing terminal disaccharides of the A- (yellow), B- (green) and C-branches (red) of the S4 glycan over the course of the simulation.
Fig. 5.
Fig. 5.
S4 glycan processing of Pdi1p is improved when the a-domain is removed. (A) Schematic representation of the Pdi1p variants used. His: N-terminal His10 tag, HDEL: C-terminal HDEL ER retention signal. (B) Pdi1p variants were expressed and purified. Elution fractions were analyzed by SDS–PAGE and immunoblot using anti-His4 antibodies. (C) Relative abundance of glycoforms on S4 of purified full-length and truncated Pdi1p, indicated in different colors. Data represent the mean values of glycan ratios of four independent experiments with error bars indicating the standard deviation * P < 0.05; ** P < 0.01; *** P < 0.001. (D) Similarity representation of Pdi1p variants (indicated at the right) based on the difference in S4 glycoform abundance (given in Figure 6F) to full-length Pdi1p. The color scale represents values calculated by the equation: (x-Pdi1p)/Pdi1p (x is the average glycoform abundance of a specific variant; Pdi1p is the average glycoform abundance of full-length Pdi1p). Similarity between site-specific profiles was calculated as described in Figure 3C. See Supplementary data, Figure S4 and Table S4 for spectra and raw data. This figure is available in black and white in print and in color at Glycobiology online.
Fig. 6.
Fig. 6.
The S4 is processed more slowly by Mns1p in vitro. (A) N-Glycan analysis of M9Gn2-Pdi1p. Trichoplusia ni cells were incubated with kifunensine and infected with virus containing an expression copy of GST-tagged Pdi1p. GST-Pdi1p was affinity purified and the GST tag was removed. N-Glycan profiles were determined by MS analysis. Data represent the mean values of relative glycan abundances of three independent experiments with error bars indicating the standard deviation of mean. (B) M9Gn2-Pdi1p was incubated with Mns1p. At the indicated time points, aliquots were TCA precipitated and analyzed by MS. Mean values for the relative abundance of M8Gn2 at the different glycosites from three independent experiments were plotted with error bars representing the standard deviation of mean. See Supplementary data, Figure S5 and Table S5 for spectra and raw data.
Fig. 7.
Fig. 7.
Secreted Pdi1p shows site-specific glycan profiles. (A) N-Glycan-processing pathway of T. ni showing glycan structures and enzymes (MI, MII, MIII: α-mannosidase I, II and III; GnTI, GnTII: N-acetylglucosamine transferase I and II; GA: N-acetylglucosaminidase; FT6, FT3: α1,6- and α1,3-fucosyl transferase). (B) Site-specific glycan profiles of sPdi1p. Data represent the average values calculated from four independent experiments. Relative abundances for each glycoform are depicted above the corresponding column placed at the left of graphic structure representation. The processing pathway from (A) is depicted at the base of the charts. See Supplementary data, Table S6 for the complete data set including all glycoforms detected. (C) Pdi1p N-glycosylation sites arranged based on the similarity of their glycoprofiles. The similarity between site-specific glycan profiles and different glycoforms was calculated as described in Figure 3C. (D) Conversions for selected enzymes for each glycosite (S1 to S5). Site-specific enzyme conversion was obtained by glycan flux analysis using the relative abundances of each glycoform from (B). Error bars indicate standard deviation of mean values from four experiments. See Supplementary data, Figure S6 and Table S6 for spectra, a complete set of conversions for every enzyme and raw data. (B–D) The structures of glycan isomers were assigned according to the biosynthesis pathway of insect cells shown in (A). This figure is available in black and white in print and in color at Glycobiology online.
Fig. 8.
Fig. 8.
The glycan profile of secreted Pdi1p is altered by changing the protein structure. (A) Secreted Pdi1p and truncated versions were expressed in insect cells and purified as described in Figure 1. Eluted fractions were analyzed by SDS–PAGE and stained with Coomassie (left/middle). ER retention of sPdi1p was disrupted by the presence of two additional amino acids at the protein's C-terminus (HDELLE) (Raykhel et al. 2007); truncated versions do not contain a HDEL sequence. (B) Relative glycan abundances on S4 of purified full-length sPdi1p and secreted b-, bb′-, ab-, abb′-variants shown in different colors. Data represent the mean values of glycan ratios of three independent experiments with error bars indicating standard deviation of mean values. * P < 0.05; ** P < 0.01; *** P < 0.001. (C) Conversions of S4 N-glycan on sPdi1p variants were calculated as in Figure 6D. Conversions for selected enzymes were plotted for each variant. Error bars indicate standard deviation of mean values from four experiments. This figure is available in black and white in print and in color at Glycobiology online.
Fig. 9.
Fig. 9.
Altering the processing machinery changes the glycan profile of secreted Pdi1p. (A) GALT-1 expression levels were confirmed by immunoblotting using anti-FLAG antibody in three independent experiments. (B) sPdi1p was purified from cells infected with either an unmodified bacmid (−GalT) or a recombinant bacmid carrying an expression copy of GALT-1 (+GalT). Relative glycan abundances without core fucoses (−F), with core fucoses but without galactose (+F), and with galactose attached to the core fucose (+F, +Gal) were calculated for each site. The data represent mean values from three independent experiments. See Supplementary data, Table S7 for data on individual glycan structures. (C) Similarity of the five glycosites was calculated from relative glycan abundances as described in Figure 3C. See Supplementary data, Figure S7 for glycan profiles of S1, S2 and S3, and immunoblot of GALT-1 expression, and Supplementary data, Table S7 for raw data. This figure is available in black and white in print and in color at Glycobiology online.

Similar articles

Cited by

References

    1. Aebi M, Bernasconi R, Clerc S, Molinari M. 2010. N-Glycan structures: Recognition and processing in the ER. Trends Biochem Sci. 35:74–82. - PubMed
    1. Antoniewicz MR. 2013. Dynamic metabolic flux analysis – Tools for probing transient states of metabolic networks. Curr Opin Biotechnol. 24:973–978. - PubMed
    1. Case DA, Babin V, Berryman JT, Betz RM, Cai Q, Cerutti DS, Cheatham TE, Darden TA, Duke RE, Gohlke H et al. . 2014. AMBER 14. San Francisco: University of California.
    1. Darden T, York D, Pedersen L. 1993. Particle mesh Ewald: An N⋅ log (N) method for Ewald sums in large systems. J Chem Phys. 98:10089.
    1. Dell A, Galadari A, Sastre F, Hitchen P. 2010. Similarities and differences in the glycosylation mechanisms in prokaryotes and eukaryotes. Int J Microbiol. 2010:148178. - PMC - PubMed

Publication types

MeSH terms

Substances