. 2015 Oct;35(20):3528-46.
doi: 10.1128/MCB.00518-15. Epub 2015 Aug 3.

Immunosuppression-Independent Role of Regulatory T Cells against Hypertension-Driven Renal Dysfunctions

Affiliations

Immunosuppression-Independent Role of Regulatory T Cells against Hypertension-Driven Renal Dysfunctions

Salvatore Fabbiano et al. Mol Cell Biol. 2015 Oct.

Abstract

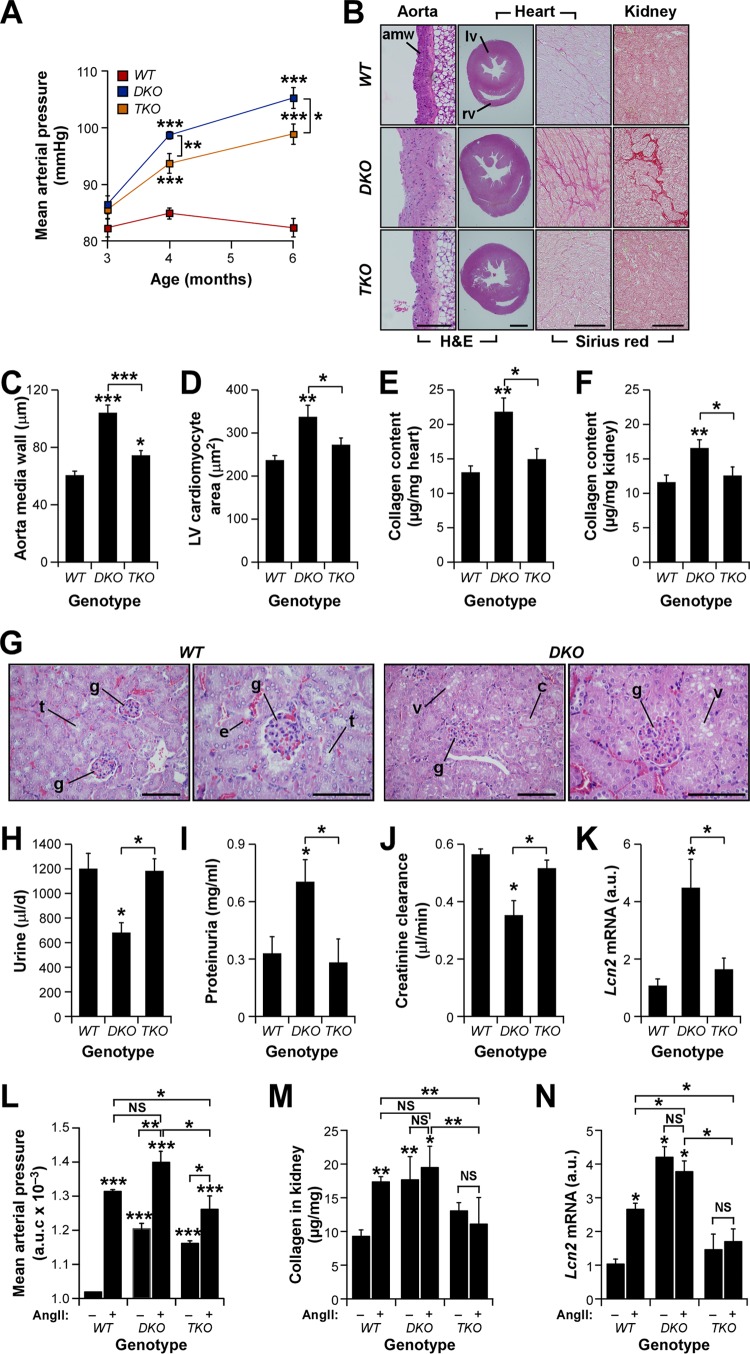
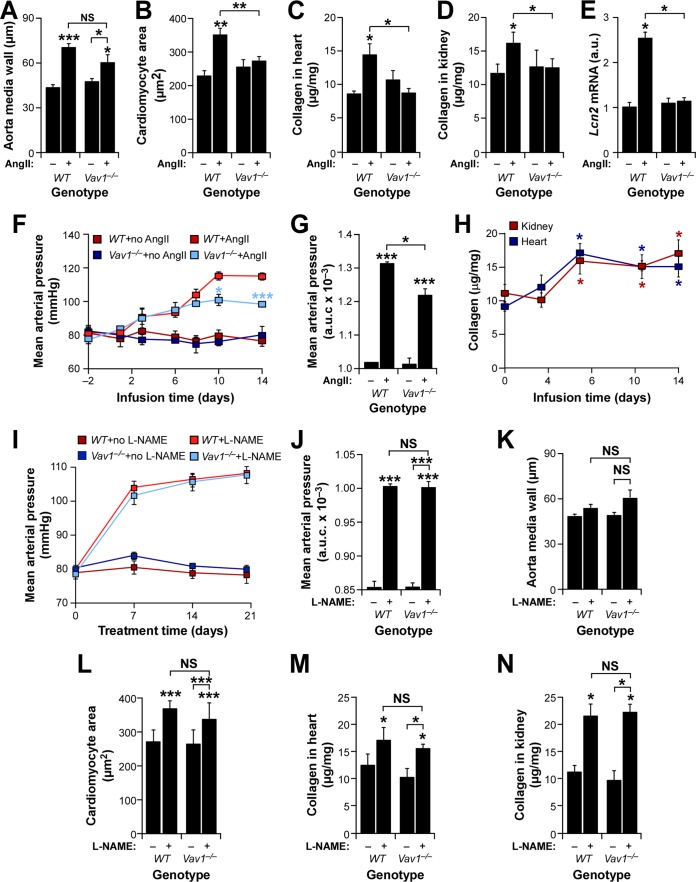
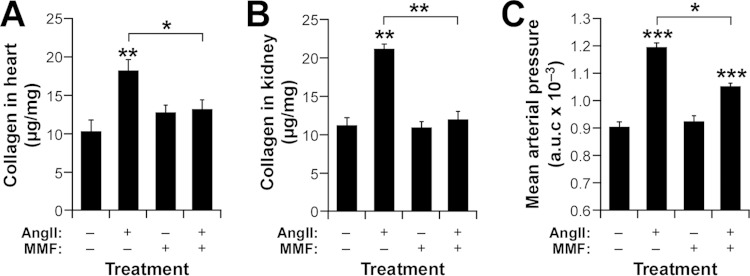
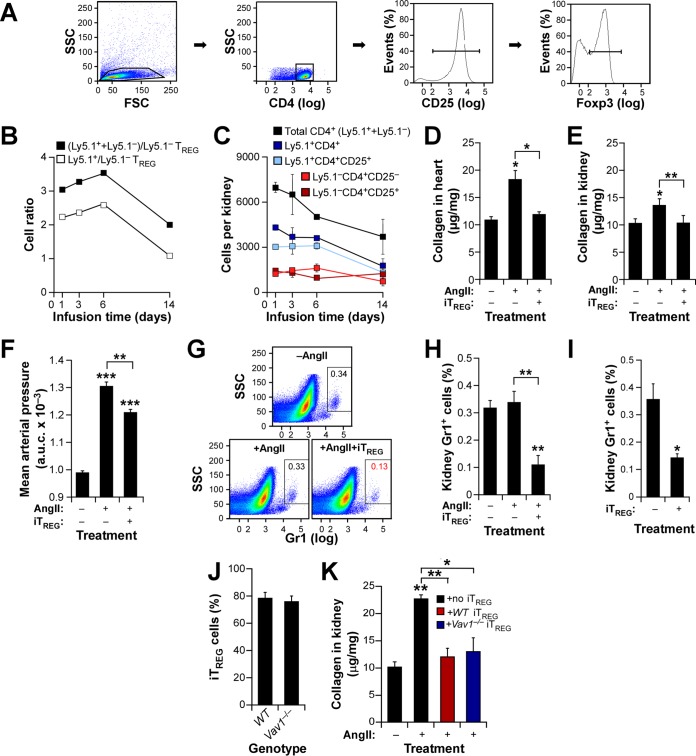
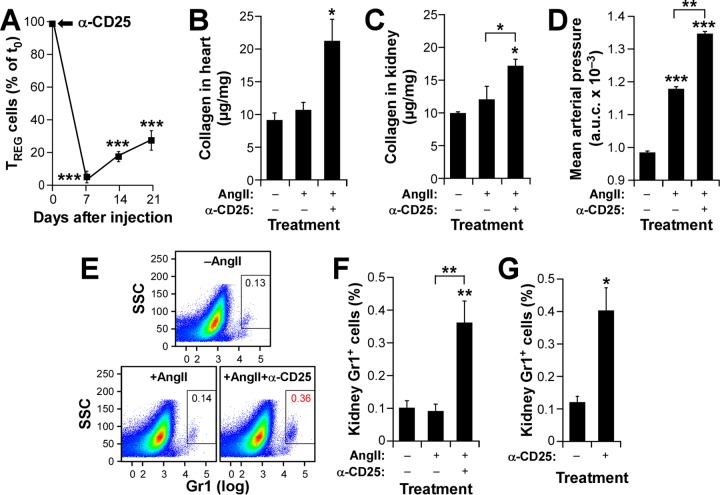
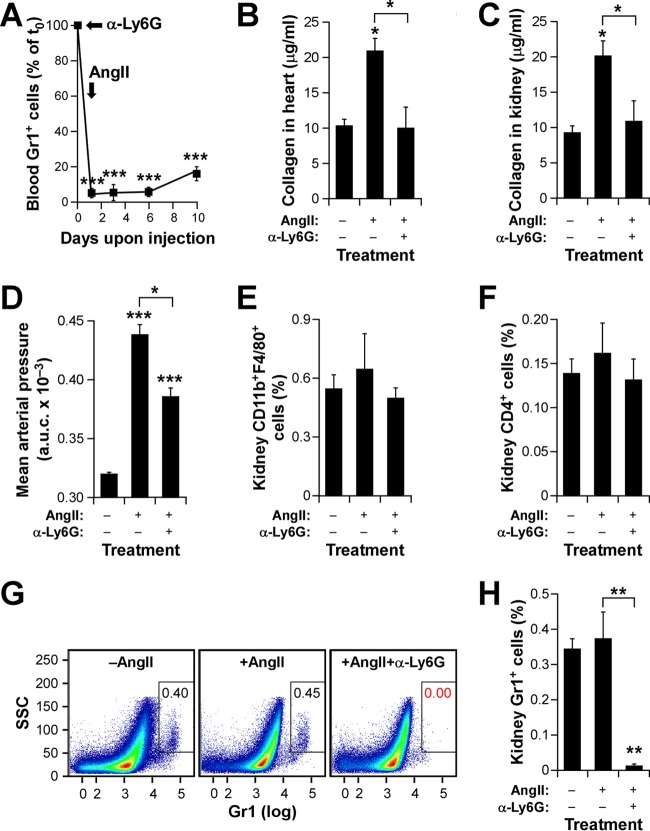
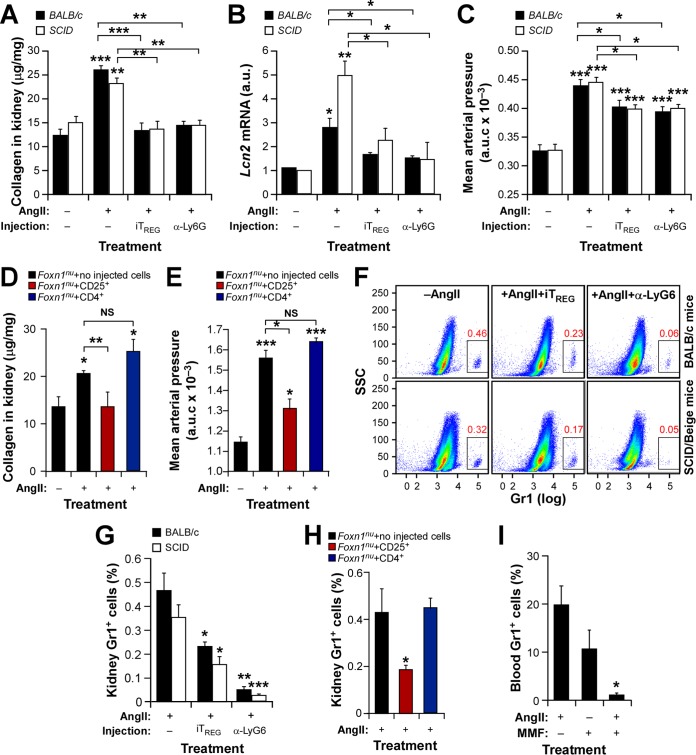
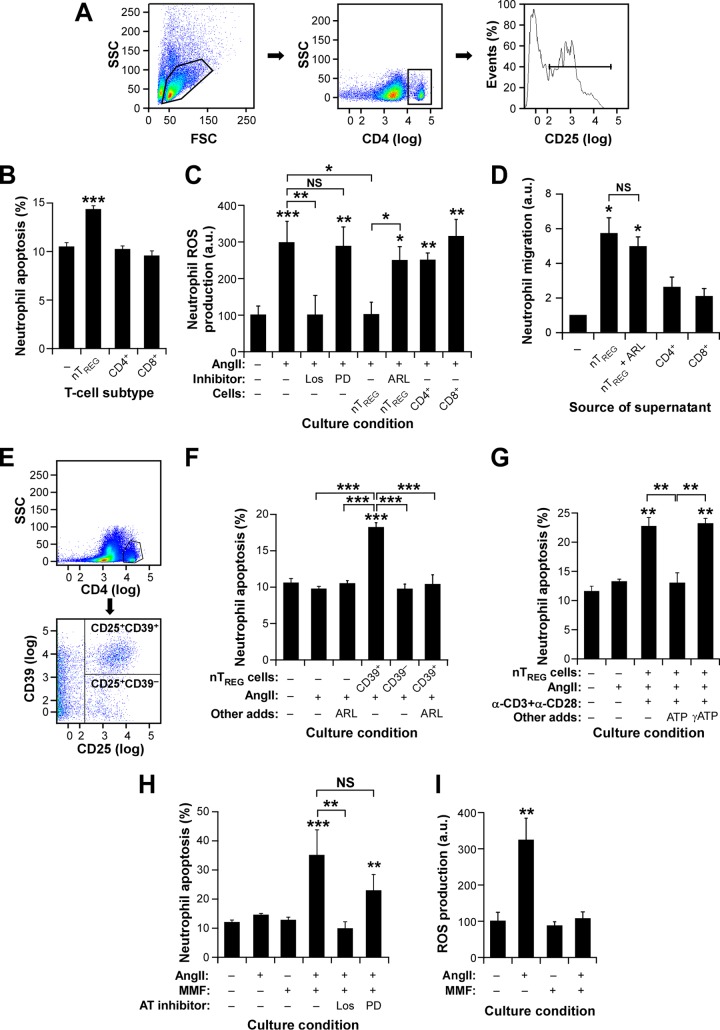
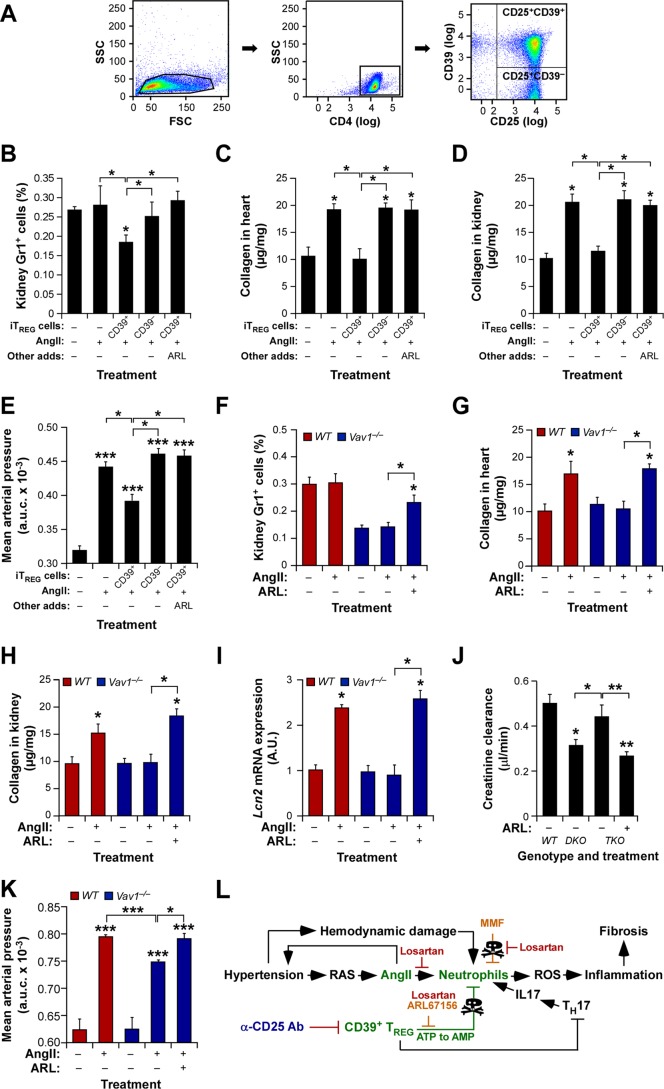
Hypertension-associated cardiorenal diseases represent one of the heaviest burdens for current health systems. In addition to hemodynamic damage, recent results have revealed that hematopoietic cells contribute to the development of these diseases by generating proinflammatory and profibrotic environments in the heart and kidney. However, the cell subtypes involved remain poorly characterized. Here we report that CD39(+) regulatory T (TREG) cells utilize an immunosuppression-independent mechanism to counteract renal and possibly cardiac damage during angiotensin II (AngII)-dependent hypertension. This mechanism relies on the direct apoptosis of tissue-resident neutrophils by the ecto-ATP diphosphohydrolase activity of CD39. In agreement with this, experimental and genetic alterations in TREG/TH cell ratios have a direct impact on tissue-resident neutrophil numbers, cardiomyocyte hypertrophy, cardiorenal fibrosis, and, to a lesser extent, arterial pressure elevation during AngII-driven hypertension. These results indicate that TREG cells constitute a first protective barrier against hypertension-driven tissue fibrosis and, in addition, suggest new therapeutic avenues to prevent hypertension-linked cardiorenal diseases.


Figures

Fig 1
Fig 1
Vav family TKO mice show protection against heart hypertrophy and cardiorenal fibrosis. (A) Evolution of mean arterial pressure in mice of the indicated genotypes. *, P ≤ 0.05; ***, P ≤ 0.001 (n = 8). (B) Examples of aorta, heart ventricle, left ventricle, and kidney sections (from left to right) obtained from 4-month-old mice of the indicated genotypes. Sections were stained as indicated. Sirius red-stained fibrotic deposits in interstitial areas are seen as dark pink areas (right). amw, aorta media wall; lv, left ventricle; rv, right ventricle. Bars, 100 μm. Similar results were obtained using serial sections and independent mice (n = 4). (C to F) Status of cardiovascular (C and D) and cardiorenal (E and F) parameters in mice of the indicated genotypes. LV, left ventricle. Asterisks indicate significant differences (*, P ≤ 0.05; **, P ≤ 0.01; ***, P ≤ 0.001) from the control or between the experimental groups indicated (n = 4). (G) Examples of kidney sections from mice of the indicated genotypes. WT mice exhibit normal glomeruli (g) and tubules (t), whereas DKO animals display typical signs of glomerular sclerosis, cytoplasmic vacuolar accumulation (v) in necrotic tubules, and protein casts (c). Erythrocytes (e) are seen as red spots in all sections. Bars, 50 μm. (H to J) Daily urine production (n = 6) (H), urine protein content (n = 6) (I), and creatinine clearance rates (n = 4) (J) in mice of the indicated genotypes. An asterisk indicates a significant difference (P ≤ 0.05) from the control or between the experimental groups indicated. (K) Levels of Lcn2 transcripts in the kidneys of animals of the indicated genotypes. An asterisk indicates a significant difference (*, P ≤ 0.05) from the control or between the experimental groups indicated (n = 4). (L to N) AUC (area under the curve) for mean arterial pressure (L) and renal parameters (M and N) in mice of the indicated genotypes that had either been left untreated (−) or infused with AngII (+). Asterisks indicate significant differences (*, P ≤ 0.05; **, P ≤ 0.01; ***, P ≤ 0.001) from the control or between the experimental groups indicated (n = 4). NS, not statistically significant. Error bars in all figures represent the standard errors of the means.
FIG 2
FIG 2
Vav1 gene deficiency protects against AngII-triggered cardiorenal dysfunctions. (A to E) Status of the indicated cardiovascular (A to C) and renal (D and E) parameters in mice of the indicated genotypes infused with AngII (+) or left untreated (−). *, P ≤ 0.05; **, P ≤ 0.01; ***, P ≤ 0.001 (n = 10). a.u., arbitrary units. (F and G) Mean arterial pressure evolution (F) and area under the curve (AUC) (G) for the indicated mouse strains and treatments. *, P ≤ 0.05; ***, P ≤ 0.001 (n = 6). (H) Kinetics of cardiorenal fibrosis development in AngII-treated WT mice. *, P ≤ 0.05 (n = 4). (I and J) Evolution (I) and AUC (J) of mean arterial pressure in mice of the indicated genotypes in the presence or absence of l-NAME. ***, P ≤ 0.001 (n = 4). (K to N) Status of the indicated vascular (K), heart (L and M), and renal (N) parameters in WT and Vav1−/− mice at the end of l-NAME treatment. Note that, in contrast to AngII infusion, oral administration of l-NAME does not induce aorta remodeling even in WT mice (K). *, P ≤ 0.05; ***, P ≤ 0.001 (n = 4). Statistical differences from untreated WT controls or between the indicated experimental groups are indicated.
FIG 3
FIG 3
MMF protects immunodeficient mice against cardiorenal fibrosis. (A to C) Cardiorenal fibrosis levels (A and B) and area under the curve (AUC) for blood pressure (C) developed by Foxn1nu mice after a 14-day treatment with the indicated agents. Asterisks indicate significant differences (*, P ≤ 0.05; **, P ≤ 0.01; ***, P ≤ 0.001) from the control or between the indicated experimental groups (n = 6).
FIG 4
FIG 4
Increased TREG/TH cell ratios protect against AngII-triggered cardiorenal fibrosis. (A) Example of purified iTREG cells used in these experiments. CD4+ cells obtained from homogenized spleens and separated by flow cytometry (two left panels) were cultured with antibodies to CD3, CD28, interleukin 2, and transforming growth factor β1. After 4 days, CD25 expression was checked by flow cytometry (third panel from left) and injected into mice. In some cases, aliquots of cells were checked for Foxp3 expression (right panel). (B) Ratios of the indicated cell populations in kidneys from animals injected with 2 × 10⁵ Ly5.1+ TREG cells and infused 24 h later with AngII for the indicated periods. (C) Mean numbers of the indicated cell populations in kidneys from mice used in the experiment for which results are shown in panel B (n = 4). (D to F) Cardiorenal fibrosis levels (D and E) and AUC for mean arterial pressure (F) in WT mice maintained under the indicated conditions for 14 days. Asterisks indicate significant differences (*, P ≤ 0.05; **, P ≤ 0.01; ***, P ≤ 0.001) from the control or between the indicated experimental groups (n = 4). (G and H) Representative example (G) and quantification (H) of neutrophils in kidneys from WT mice at the end of the experiments described in the legend to panel B. Asterisks indicate significant differences (**, P ≤ 0.01) from the control or between the indicated experimental groups (n = 4). (I) Quantification of kidney-resident neutrophils in WT mice treated as indicated. *, P ≤ 0.05 (n = 4). (J) Percentages of iTREG cells generated from splenic WT and Vav1−/− CD4+ CD25 T cells in cell culture (n = 4). (K) Extent of kidney fibrosis in AngII-infused Foxn1nu mice injected with the indicated iTREG cells. Asterisks indicate significant differences (*, P ≤ 0.05; **, P ≤ 0.01) from the control or between the indicated experimental groups (n = 4).
FIG 5
FIG 5
Immunodepletion of TREG cells restores renal fibrosis in Vav1-deficient mice. (A) Evolution of the CD4+ CD25+ cell population in Vav1−/− mice upon immunodepletion with antibodies to CD25. The time of injection (t0) is indicated by an arrow. ***, P ≤ 0.001 (n = 4). (B to D) Cardiorenal fibrosis levels (B and C) and AUC for mean arterial pressure (D) in Vav1−/− mice treated as indicated. Asterisks indicate significant differences (*, P ≤ 0.05; **, P ≤ 0.01; ***, P ≤ 0.001) from the control or between the indicated experimental groups (n = 4). (E and F) Representative example (E) and quantification (F) of neutrophils in kidneys from Vav1−/− mice used in the experiments for which results are shown in panels A to D. Asterisks indicate significant differences (**, P ≤ 0.01) from the control or between the indicated experimental groups (n = 4). (G) Quantification of kidney-resident neutrophils in Vav1−/− mice under the indicated conditions. *, P ≤ 0.05 (n = 4).
FIG 6
FIG 6
Neutrophils are involved in AngII-driven cardiorenal fibrosis. (A) Impact of the immunodepletion step on the numbers of neutrophils in WT mice. ***, P ≤ 0.001 (n = 4). The time points of antibody injection (α-Ly6G) and implantation of osmotic pumps (AngII) are indicated by arrows. (B and C) Extent of cardiorenal fibrosis obtained in WT animals injected with either a control antibody or an anti-Ly6G antibody and subsequently infused with AngII as indicated. Asterisks indicate significant differences (*, P ≤ 0.05) from the control or between the indicated experimental groups (n = 4). (D) AUC for the mean arterial pressure increase obtained in the experiment for which results are shown in panels A to C. Asterisks indicate significant differences (*, P ≤ 0.05; ***, P ≤ 0.001) from the control or between the indicated experimental groups (n = 4). (E and F) Quantification of kidney-resident macrophages (E) and CD4+ T cells (F) at the end of these experiments. (G and H) Representative dot plots (G) and quantification (H) of neutrophils present in kidneys at the end of these experiments. Asterisks indicate significant differences (**, P ≤ 0.01) from the control or between the indicated experimental groups (n = 4).
FIG 7
FIG 7
TREG cells protect against hypertension-driven fibrosis in an immunosuppression-independent manner. (A to E) Renal fibrosis (A and D), abundance of Lcn2 transcripts in kidneys (B), and AUC for mean arterial pressure levels (C and E) in the indicated mouse strains under the indicated treatment conditions. Asterisks indicate significant differences (*, P ≤ 0.05; **, P ≤ 0.01; ***, P ≤ 0.001) from the control or between the indicated experimental groups (n = 4). (F and G) Representative dot plots (F) and quantification (G) of kidney-resident neutrophils in the indicated mouse strains under the indicated treatment conditions. Asterisks indicate significant differences (*, P ≤ 0.05; **, P ≤ 0.01; ***, P ≤ 0.001) from the control or between the indicated experimental groups (n = 4). (H and I) Percentages of kidney-resident and circulating neutrophils in Foxn1nu mice under the indicated experimental conditions. Asterisks indicate significant differences (*, P ≤ 0.05) from the control (n = 4).
FIG 8
FIG 8
TREG cells induce CD39-dependent neutrophil apoptosis. (A) Example of the flow cytometry purification step for obtaining the splenic CD4+ CD25+ nTREG cells used in the experiments for which results are shown in panels B to D. (B and C) Apoptotic response (B) and ROS production (C) of neutrophils under the indicated in vitro conditions. ARL, ARL 67156; CD4+, CD4+ CD25 T cells; CD8+, CD8+ T cells; Los, losartan; PD, PD123319. Asterisks indicate significant differences (*, P ≤ 0.05; **, P ≤ 0.01; ***, P ≤ 0.001) from the control or between the indicated experimental groups (n = 4). (D) Effect of TREG cell-derived culture supernatants on neutrophil chemotaxis (values obtained with medium alone were given an arbitrary value of 1). Asterisks indicate significant differences (*, P ≤ 0.05) from the control; NS, no significant difference (n = 4). (E) Example of the purification step used to obtain the splenic CD39+ and CD39 nTREG cells used in the experiment for which results are shown in panel F. (F to H) Apoptotic responses of neutrophils under the indicated culture conditions. CD39+, CD4+ CD25+ CD39+ nTREG cells; CD39, CD4+ CD25+ CD39 nTREG cells; α-CD3 and α-CD28, antibodies to mouse CD3 and CD28, respectively. Asterisks indicate significant differences (**, P ≤ 0.01; ***, P ≤ 0.001) from the control or between the indicated experimental groups (n = 4). (I) AngII-stimulated ROS production by neutrophils under the indicated culture conditions. Asterisks indicate significant differences (**, P ≤ 0.01) from the control (n = 4).
Fig 9
Fig 9
CD39+ TREG cells are involved in the protection against AngII-driven cardiorenal dysfunctions. (A) Example of the flow cytometry-mediated purification of CD39+ and CD39 iTREG cells used in the experiments for which results are shown in panels B to E. (B to E) Percentages of kidney-infiltrating neutrophils (B), extent of cardiorenal fibrosis (C and D), and blood pressure levels (E) in WT mice under the indicated experimental conditions. Asterisks indicate significant differences (*, P ≤ 0.05; **, P ≤ 0.01; ***, P ≤ 0.001) from the control or between the indicated experimental groups (n = 4). (F to K) Percentages of kidney-infiltrating neutrophils (n = 4) (F), cardiorenal fibrosis levels (n = 4) (G and H), abundance of Lnc2 transcripts in kidneys (n = 4) (I), creatinine clearance rates (n = 6) (J), and overall blood pressure levels (n = 4) (K) in mice of the indicated genotypes under the indicated experimental conditions. Asterisks indicate significant differences (*, P ≤ 0.05; **, P ≤ 0.05; ***, P ≤ 0.001) from the control or between the indicated experimental groups. (L) The new mechanism (green) described in this work. Inhibitors tested exclusively in vitro or in vivo are shown in red or blue letters, respectively. Those used under both conditions are shown in light brown letters. The TREG-TH-neutrophil connection is proposed on the basis of previously published data (1, 2, 7, 8, 22). RAS, renin-angiotensin system.

References

    1. Josefowicz SZ, Lu LF, Rudensky AY. 2012. Regulatory T cells: mechanisms of differentiation and function. Annu Rev Immunol 30:531–564. doi:10.1146/annurev.immunol.25.022106.141623. - DOI - PMC - PubMed
    1. Shevach EM. 2009. Mechanisms of Foxp3+ T regulatory cell-mediated suppression. Immunity 30:636–645. doi:10.1016/j.immuni.2009.04.010. - DOI - PubMed
    1. Burzyn D, Benoist C, Mathis D. 2013. Regulatory T cells in nonlymphoid tissues. Nat Immunol 14:1007–1013. doi:10.1038/ni.2683. - DOI - PMC - PubMed
    1. Burzyn D, Kuswanto W, Kolodin D, Shadrach JL, Cerletti M, Jang Y, Sefik E, Tan TG, Wagers AJ, Benoist C, Mathis D. 2013. A special population of regulatory T cells potentiates muscle repair. Cell 155:1282–1295. doi:10.1016/j.cell.2013.10.054. - DOI - PMC - PubMed
    1. Kearney PM, Whelton M, Reynolds K, Muntner P, Whelton PK, He J. 2005. Global burden of hypertension: analysis of worldwide data. Lancet 365:217–223. doi:10.1016/S0140-6736(05)70151-3. - DOI - PubMed

Publication types

MeSH terms