. 2015 Sep 8;112(36):11306-11.
doi: 10.1073/pnas.1506184112. Epub 2015 Aug 3.

Crowded growth leads to the spontaneous evolution of semistable coexistence in laboratory yeast populations

Affiliations

Crowded growth leads to the spontaneous evolution of semistable coexistence in laboratory yeast populations

Evgeni M Frenkel et al. Proc Natl Acad Sci U S A. .

Abstract

Identifying the mechanisms that create and maintain biodiversity is a central challenge in biology. Stable diversification of microbial populations often requires the evolution of differences in resource utilization. Alternatively, coexistence can be maintained by specialization to exploit spatial heterogeneity in the environment. Here, we report spontaneous diversification maintained by a related but distinct mechanism: crowding avoidance. During experimental evolution of laboratory Saccharomyces cerevisiae populations, we observed the repeated appearance of "adherent" (A) lineages able to grow as a dispersed film, in contrast to their crowded "bottom-dweller" (B) ancestors. These two types stably coexist because dispersal reduces interference competition for nutrients among kin, at the cost of a slower maximum growth rate. This tradeoff causes the frequencies of the two types to oscillate around equilibrium over the course of repeated cycles of growth, crowding, and dispersal. However, further coevolution of the A and B types can perturb and eventually destroy their coexistence over longer time scales. We introduce a simple mathematical model of this "semistable" coexistence, which explains the interplay between ecological and evolutionary dynamics. Because crowded growth generally limits nutrient access in biofilms, the mechanism we report here may be broadly important in maintaining diversity in these natural environments.

Keywords: coexistence; crowding; experimental evolution; fungal adherence.


Conflict of interest statement

The authors declare no conflict of interest.

Figures

Fig. 1.
Fig. 1.
Coexistence due to negative frequency-dependent fitness. (A) Frequency of a fluorescently marked lineage over time. Colors represent independently evolved populations; each line is a replicate of the corresponding population in which the initial frequency of the marked lineage was perturbed to a given value. (B) Fitness of the marked strain as a function of its frequency, as calculated from the data in A. (C) Fluorescent image of one population shows that the marked lineage is located on the well walls, whereas the B type is located at the well bottom. (D) Microtiter wells containing isolated strains of the two types.
Fig. S1.
Fig. S1.
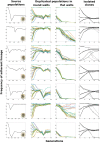
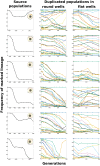
Coexistence due to negative frequency-dependent fitness (full data). Column 1 shows the original observation of marked lineages remaining at intermediate frequencies, suggesting frequency-dependent selection. (Insets) All these populations had dispersed pellet morphology. Columns 2 shows these lineages returned to their original frequencies after perturbation by sorting cytometry (Materials and Methods; note that the sharp decline in frequencies around generation 180 is an artifact of an experimental error, in which populations were temporarily propagated at dilution factors 210. Column 3 shows the resulting lineage dynamics when these populations were duplicated from round-bottom into flat-bottom wells (A cells do not adhere to the vertically sloped walls of flat wells, which eliminates the crowding avoidance effect by causing both types to be similarly confined to the well bottom, and hence prevents coexistence). Column 4 shows the competition of clones, one A and one B, drawn from the source population of each row and propagated in unshaken (solid lines) and shaken (dashed lines) round-bottom wells.
Fig. S2.
Fig. S2.
B types do not exhibit frequency dependent fitness. Column 1 shows the observation of marked lineages remaining at intermediate frequencies in populations subsequently shown to lack frequency-dependent selection. (Insets) None of these populations had dispersed pellet morphologies. Column 2 shows the dynamics of these lineages after perturbation by sorting cytometry, and column 3 shows their dynamics after duplication from round-bottom to flat-bottom wells.
Fig. S3.
Fig. S3.
Adherence phenocopied using antifungal drugs. The B ancestral strain (DBY15108) was grown at a range of drug concentrations in round-bottom wells. After saturation, cells were resuspended by shaking, allowed to settle, and imaged (Materials and Methods).
Fig. 2.
Fig. 2.
Effect of crowding on the growth of A and B strains. A schematic illustration of growth during one cycle is shown.
Fig. 3.
Fig. 3.
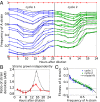
Population dynamics within growth cycles. (A) Frequency of the A type over the course of two growth cycles. Eighteen representative populations starting with different initial frequencies are shown (of 180 total populations; complete data are provided in Fig. S4). (B) Ratio of the densities of the A type relative to the B type when each strain is grown in isolation (absolute density measurements are provided in Fig. S5). (C) Net fitness of the A type across growth cycles in all populations as a function of starting frequency, calculated from the data in A and Fig. S4. Dashed lines are the best-fit model prediction.
Fig. S4.
Fig. S4.
A vs. B dynamics within each growth cycle. A strain frequencies in 162 populations are shown, in addition to the 18 shown in Fig. 3A.
Fig. S5.
Fig. S5.
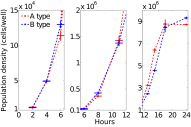
Growth curves of A and B strains. The densities of the A and B strains in Fig. 3 (EFY5 and EFY10, respectively) as measured in 15 replicates (mean ± SEM, horizontal error bars of ±30 min). The ratio of these growth curves is shown in Fig. 3B.
Fig. 4.
Fig. 4.
Semistability of the coexistence. We show the equilibrium frequency of A and B types as a function of their relative fitness in flat wells, which is a proxy for their ratio of growth rates, rA/rB. Each point represents the competition between one pair of A and B strains. Orange points are all pairwise combinations between 25 A strains and four B strains. The orange triangle is the constructed erg3Δ A strain vs. one of the B strains. Green points are competitions between four A strains and a cycloheximide-resistant B strain at a range of cycloheximide concentrations. Circled points correspond to two A strains that attained consistently higher than predicted equilibria, given their fitness. The dashed line is the model prediction; note this prediction involves no fitting.
Fig. S6.
Fig. S6.
Fitness in flat wells compared with the maximum growth rate in round wells. Absolute differences in growth rate are plotted on the x axis for 48 A and B strain pairs. These strains were measured at low density (<106 cells per milliliter) in round wells by mixing pairs of strains and assaying their proportions at the beginning and end of a 3-h interval (error bars are SEM for four biological replicates). The measurements of relative fitness in flat-bottom wells, plotted on the y axis, are the same as in Fig. 4.
Fig. 5.
Fig. 5.
Dependence of coexistence on fitness. (A) All pairwise competitions between a set of A strains (color-coded) and B strains of varied fitness. These fitness measurements were included in an earlier publication (28). (B) Similar data for A strains (strain numbers are indicated in the figure) vs. EFY64. Dashed curves show the model fit obtained by choosing the indicated values of rB = ln(2)/τB. EFY5 is the A strain in Fig. 3; hence, its rA = ln(2)/89 min−1. The rA values of the other A strains are determined by their fitness relative to strain EFY5.
Fig. 6.
Fig. 6.
Competition of two A strains and one B strain. The outcomes of competition for three combinations of strains are shown. Data points are color-coded by strain. Strain EFY64 is type B, and the other strains are type A. Dashed curves are model predictions based on the measured frequencies at generation 0, the model parameters nB and K inferred from Fig. 3, and growth rates inferred from the equilibrium frequencies in Fig. 5B (Materials and Methods). The outcomes of other three-strain competitions are shown in Fig. S7.
Fig. S7.
Fig. S7.
Competition between two A strains and one B strain. Dynamics in populations containing all pairwise combinations between two sets of A strains, indicated by numbering of rows and columns, and one B strain (EFY64). Data points are color-coded according to strain, and symbols (×, ♢, ○, ●) correspond to independent populations. Dashed curves are model predictions based on measured initial frequencies and parameters inferred from Figs. 3 and 5B (Materials and Methods). Measurements at generations 40 and 50 were performed on samples stored for ∼24 h at 4 °C, which appears to have biased those frequencies in favor of the nonfluorescent strain (EFY64).
Fig. S8.
Fig. S8.
Transitivity of fitness among A strains. All pairwise fitnesses between two sets of seven A strains measured in triplicate are shown. These data were used to determine the absolute fitnesses shown in Fig. 5B and were found to be consistent with transitive fitness among A strains (χ2=0.6; Materials and Methods).

Comment in

References

    1. Friesen ML, Saxer G, Travisano M, Doebeli M. Experimental evidence for sympatric ecological diversification due to frequency-dependent competition in Escherichia coli. Evolution. 2004;58(2):245–260. - PubMed
    1. Blount ZD, Borland CZ, Lenski RE. Historical contingency and the evolution of a key innovation in an experimental population of Escherichia coli. Proc Natl Acad Sci USA. 2008;105(23):7899–7906. - PMC - PubMed
    1. Craig MacLean R, Dickson A, Bell G. Resource competition and adaptive radiation in a microbial microcosm. Ecol Lett. 2005;8(1):38–46.
    1. Helling RB, Vargas CN, Adams J. Evolution of Escherichia coli during growth in a constant environment. Genetics. 1987;116(3):349–358. - PMC - PubMed
    1. Rozen DE, Philippe N, Arjan de Visser J, Lenski RE, Schneider D. Death and cannibalism in a seasonal environment facilitate bacterial coexistence. Ecol Lett. 2009;12(1):34–44. - PubMed

Publication types

LinkOut - more resources