Review
. 2015 Sep 19;370(1677):20140205.
doi: 10.1098/rstb.2014.0205.

Using perturbations to identify the brain circuits underlying active vision

Affiliations
Review

Using perturbations to identify the brain circuits underlying active vision

Robert H Wurtz. Philos Trans R Soc Lond B Biol Sci. .

Abstract

The visual and oculomotor systems in the brain have been studied extensively in the primate. Together, they can be regarded as a single brain system that underlies active vision--the normal vision that begins with visual processing in the retina and extends through the brain to the generation of eye movement by the brainstem. The system is probably one of the most thoroughly studied brain systems in the primate, and it offers an ideal opportunity to evaluate the advantages and disadvantages of the series of perturbation techniques that have been used to study it. The perturbations have been critical in moving from correlations between neuronal activity and behaviour closer to a causal relation between neuronal activity and behaviour. The same perturbation techniques have also been used to tease out neuronal circuits that are related to active vision that in turn are driving behaviour. The evolution of perturbation techniques includes ablation of both cortical and subcortical targets, punctate chemical lesions, reversible inactivations, electrical stimulation, and finally the expanding optogenetic techniques. The evolution of perturbation techniques has supported progressively stronger conclusions about what neuronal circuits in the brain underlie active vision and how the circuits themselves might be organized.

Keywords: behaviour; brain-circuits; inactivations; lesions; monkeys; optogenetics.


Figures

Figure 1.
Figure 1.
The brain circuits for visually guided saccades extend from cerebral cortex to the pons in the brain stem. This side view of the monkey brain shows that the circuit extends from retina to primary visual cortex (V1), then to extrastriate cortex, particularly to the lateral intraparietal (LIP) area and frontal eye field (FEF). From cortex, information reaches the superior colliculus (SC), and from there to brainstem oculomotor areas in midbrain and pons, and finally to the extraocular muscle motor neurons that project to the eye muscles to move the eye. This is a simplified brain circuit, and does not show a number of other circuits including those of the basal ganglia and the cerebellum. MT, middle temporal cortex; LGN, lateral geniculate nucleus; TE, anterior inferior temporal cortex.
Figure 2.
Figure 2.
An illustration of the methods and the limits of ablation. A subpial suction ablation of V1 cortex (top left) produced blindness in a segment of the visual field (shaded area on the bottom maps indicates at least two errors in four trials) for both stimulus detection and saccades. Within a month, this blindness recovered, which illustrates that during that month both the lesion deficit and the changing state of recovery were affecting the behaviour being tested. Addition of an electrolytic lesion in SC (top right) produced a blind region in the visual field related to the SC ablation (area within the solid line on the bottom maps again indicating at least two errors on four trials). Where the two lesions overlapped, the blindness remained for the duration of the experiments (4–15 weeks). Adapted from Mohler & Wurtz [15].
Figure 3.
Figure 3.
An advantage of chemical lesions: histological verification with the basic brain structure still visible. The chemical lesion was produced by ibotenic acid injected into area MT. The brain section is parasagittal, stained with cresyl violet for cell bodies and shows the ventral portion of the superior temporal sulcus. Dorsal is upward and anterior is to the right. Cortex on the left around the electrode track is grossly disrupted: there is a pronounced loss of neuronal cell bodies and massive gliosis. Cortex to the right of the injection area exhibits the normal columnar organization of cell bodies and laminar structure. The calibration is 500 um. Adapted from Newsome et al. [21].
Figure 4.
Figure 4.
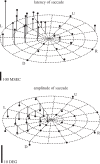
An advantage of reversible inactivation; behaviour can be tested immediately after the brain circuit is disrupted. The illustration shows any change in the latency and amplitude of saccades to visual targets across the visual field after muscimol inactivation of saccade-related neurons in the right SC. Eccentricities of dashed circles are 5, 10, 15, 20°—R, L, U and D are right, left, up and down, respectively. Only change in values for latency (top) and amplitude (bottom) following inactivation are shown: up is an increase and down is a decrease. The increase in the latency of the saccade (top) and the decrease in amplitude of the saccade (bottom) are limited to targets in the left (contralateral) visual field. Each point is the average of two trials. The deficits were clear when measured about an hour after the injection whereas with electrolytic lesions the tests that showed little deficits were done days after the lesions. Adapted from Hikosaka & Wurtz [23].
Figure 5.
Figure 5.
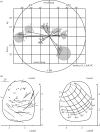
Electrical stimulation used to establish the relation between the location of neurons in the monkey SC and the saccades evoked by stimulation of the SC. (a) Comparison of SC visual fields (grey circles determined by visual neuron recording) and the vectors of saccades (arrows generated by stimulating at the site in the SC where the neurons with the visual receptive fields were located). The length of the arrow at each of the 14 sites represents the mean length of 8–14 stimulation-elicited saccades; the direction of each arrow represents the mean direction of saccades. The overlap between saccade ends and receptive fields is compelling. Adapted from [32]. (b) Determining whether there is an orderly map of amplitude and directions of saccades in the SC using saccades evoked by electrical stimulation. On the left are arrows indicating the amplitude and direction of saccades evoked by electrical stimulation at 42 points in the right SC. On the right are the smoothed contours of amplitudes from 2° to 50° and directions from −60° to +60° used to produce the standard map of the monkey SC. Adapted from [35].
Figure 6.
Figure 6.
Tests of the behavioural effects of optogenetic inactivation of SC saccade-related neurons previously transfected with Arch-T, which should inactivate the SC neurons in the presence of green laser light. Saccades were made to a visual target with and without laser stimulation. On the left, saccade endpoints are shown without (grey) and with (green) laser stimulation. Laser light was introduced into the intermediate layers of the SC on randomly interleaved trials at a point related to the visual field position indicated by neuronal recording. Green and black crosses indicate the mean saccade endpoints (±1 s.e.m.) with and without light, respectively. The grey hexagon is the site of the injection, and the sunburst is the location of the green light source, both displayed at the sites in the SC indicated by neuronal activity from an electrode attached to the injection pipette or to the stimulating optic fibre. In the centre and right are the average differences in saccade latency and saccade velocity respectively. Adapted from Cavanaugh et al. [42].

References

    1. Wurtz RH. 2008. Neuronal mechanisms of visual stability. Vis. Res. 48, 2070–2089. (10.1016/j.visres.2008.03.021) - DOI - PMC - PubMed
    1. Sommer MA, Wurtz RH. 2008. Brain circuits for the internal monitoring of movements. Annu. Rev. Neurosci. 31, 317–338. (10.1146/annurev.neuro.31.060407.125627) - DOI - PMC - PubMed
    1. Kuffler SW. 1953. Discharge patterns and functional organization of mammalian retina. J. Neurophysiol. 16, 37–68. - PubMed
    1. Hubel DH. 1959. Single unit activity in striate cortex of unrestrained cats. J. Physiol. 147, 226–238. (10.1113/jphysiol.1959.sp006238) - DOI - PMC - PubMed
    1. Hubel DH, Wiesel TN. 1968. Receptive fields and functional architecture of monkey striate cortex. J. Physiol. 195, 215–243. (10.1113/jphysiol.1968.sp008455) - DOI - PMC - PubMed

Publication types

LinkOut - more resources