. 2016 Feb;10(2):478-90.
doi: 10.1038/ismej.2015.128. Epub 2015 Aug 4.

Competitive strategies differentiate closely related species of marine actinobacteria

Affiliations

Competitive strategies differentiate closely related species of marine actinobacteria

Nastassia V Patin et al. ISME J. 2016 Feb.

Abstract

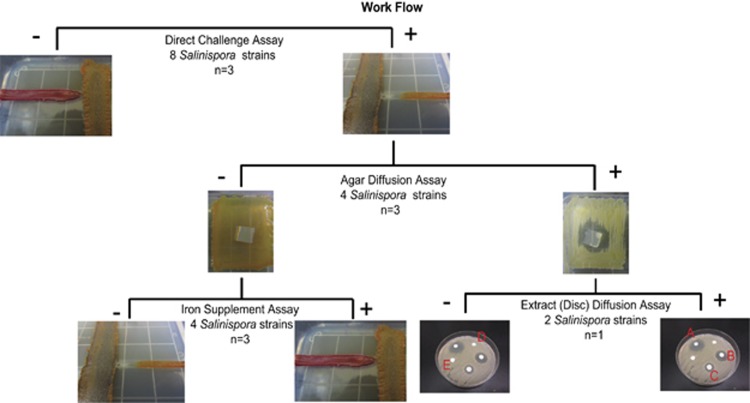
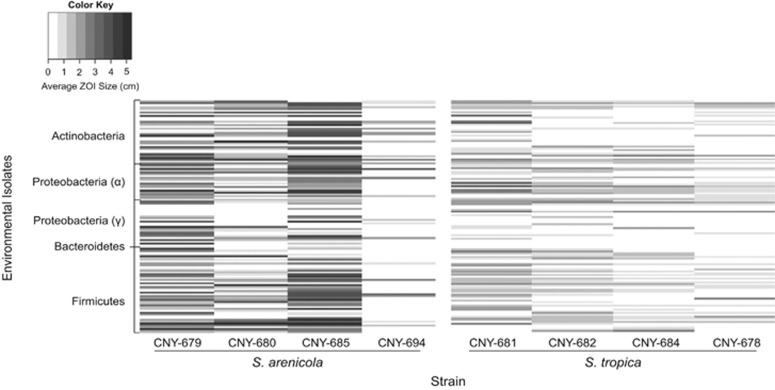
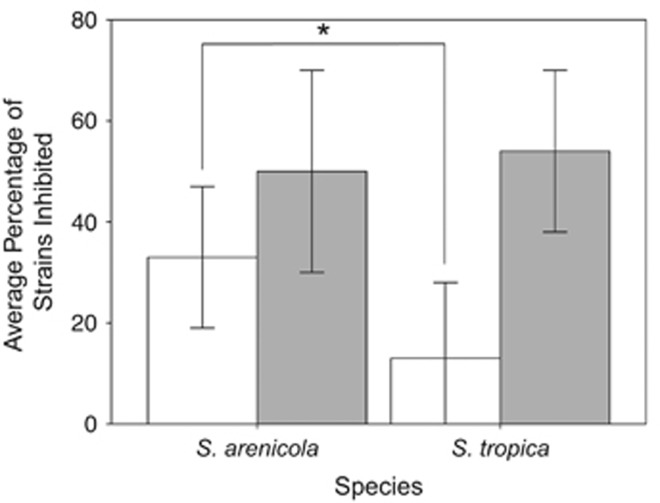
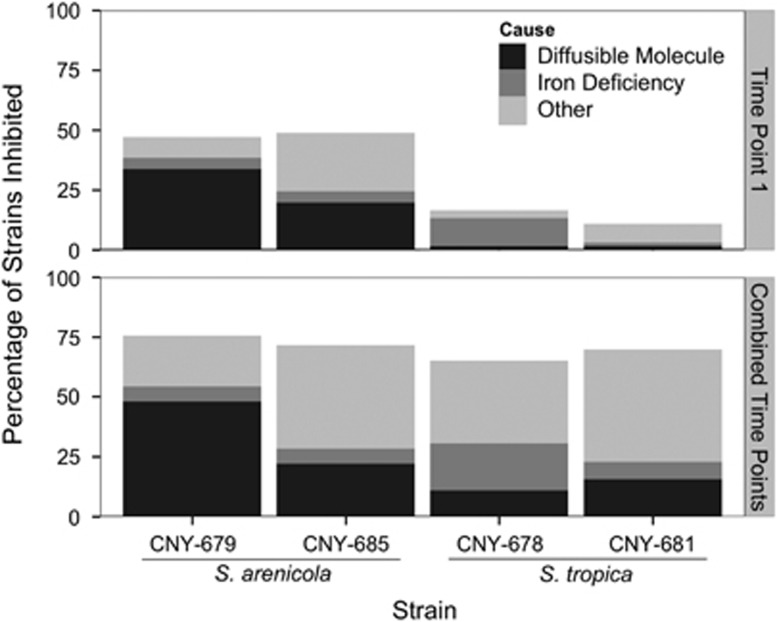
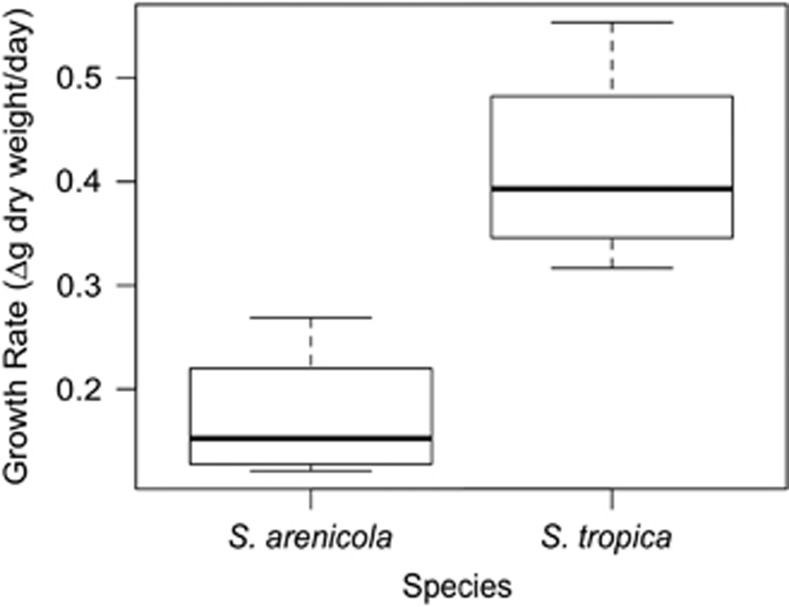
Although competition, niche partitioning, and spatial isolation have been used to describe the ecology and evolution of macro-organisms, it is less clear to what extent these principles account for the extraordinary levels of bacterial diversity observed in nature. Ecological interactions among bacteria are particularly challenging to address due to methodological limitations and uncertainties over how to recognize fundamental units of diversity and link them to the functional traits and evolutionary processes that led to their divergence. Here we show that two closely related marine actinomycete species can be differentiated based on competitive strategies. Using a direct challenge assay to investigate inhibitory interactions with members of the bacterial community, we observed a temporal difference in the onset of inhibition. The majority of inhibitory activity exhibited by Salinispora arenicola occurred early in its growth cycle and was linked to antibiotic production. In contrast, most inhibition by Salinispora tropica occurred later in the growth cycle and was more commonly linked to nutrient depletion or other sources. Comparative genomics support these differences, with S. arenicola containing nearly twice the number of secondary metabolite biosynthetic gene clusters as S. tropica, indicating a greater potential for secondary metabolite production. In contrast, S. tropica is enriched in gene clusters associated with the acquisition of growth-limiting nutrients such as iron. Coupled with differences in growth rates, the results reveal that S. arenicola uses interference competition at the expense of growth, whereas S. tropica preferentially employs a strategy of exploitation competition. The results support the ecological divergence of two co-occurring and closely related species of marine bacteria by providing evidence they have evolved fundamentally different strategies to compete in marine sediments.


Figures

Figure 1
Figure 1
Workflow. A direct challenge assay was used to detect the ability of established Salinispora cultures to inhibit the growth of co-occurring bacterial strains. All strains that were inhibited in the direct challenge assay (+) were tested further in an agar diffusion assay to determine whether the activity was due to a diffusible molecule. A positive result (+) was recorded when growth of the test strain was inhibited around the agar block but not around a medium control. Organic extracts generated from similar agar blocks were then tested against the sensitive strains in a disk-diffusion assay to determine whether the activity was organic soluble. Active organic extracts (ac) were identified based on the detection of zones of inhibition around the discs. Strains that were inhibited in the direct challenge assay but not in the agar diffusion assay were tested further to determine whether the inhibition was due to iron depletion. Iron depletion was identified as the source of the inhibition when growth was restored on iron-supplemented media (+).
Figure 2
Figure 2
Growth inhibition observed in the direct challenge assays over both time points. Each row corresponds to one bacterial strain tested against eight Salinispora strains. The bacteria are grouped by phyla, with the phylum Bacteriodetes represented by only one strain. The color intensity represents the average size (cm) of the zone of inhibition (ZOI) for triplicate assays.
Figure 3
Figure 3
Average percentage of strains inhibited by 12 S. arenicola and 13 S. tropica strains. White bars represent the results for the first time point (7 and 10 days for S. tropica and S. arenicola, respectively). Gray bars represent the combined percentage of strains inhibited at the first and second (23 days for both Salinispora species) time points. There was a significant difference between the average percentage of strains inhibited at the first time point by each species (*).
Figure 4
Figure 4
Sources of growth inhibition. The top panel presents the results from the first time point (7 days for S. tropica, 10 days for S. arenicola), whereas the bottom panel presents cumulative results from the first and second time points (23 days for both species). Sensitive isolates were tested in an agar diffusion assay to determine whether activity could be linked to a diffusible molecule. If negative, further tests were performed to determine whether growth was restored when excess iron was added to the medium, in which case the activity was attributed to iron depletion. If both assays were negative, growth inhibition was attributed to ‘other' sources. Each Salinispora strain was tested against the environmental isolates they inhibited in the direct challenge assays.
Figure 5
Figure 5
Salinispora growth rates. For each box, the dark horizontal bar represents the median value for the change in dry weight/day of the filtered cell biomass collected during exponential growth phase. The box edges represent the upper and lower quartiles of the data, and the whiskers represent the minimum and maximum values. The plot contains data from four strains of each species grown in triplicate.
Figure 6
Figure 6
MALDI-TOF imaging mass spectrometry of an S. arenicola CNY-679 interaction with Kytococcus sp. CUA-766. (a) MALDI plate setup with control samples in the top row, from left to right: media blank, Kytococcus sp. CUA-766 monoculture, S. arenicola CNY-679 monoculture. The sample in the bottom row contains the zone of inhibition between the two strains. The gray boxes define the areas chosen for imaging. (b) Spatial distribution of the m/z 696 ion, an exact match to rifamycin S (M+H), shown in green surrounding the S. arenicola colony and diffusing outwards toward the inhibited bacterial strain. This ion was observed in the S. arenicola monoculture but not in the medium blank or the Kytococcus sp. monoculture.

References

    1. Acinas SG, Klepac-Ceraj V, Hunt DE, Pharino C, Ceraj I, Distel DL et al. (2004). Fine-scale phylogenetic architecture of a complex bacterial community. Nature 430: 551–554. - PubMed
    1. Ahmed L, Jensen PR, Freel KC, Brown R, Jones AL, Kim BY et al. (2013). Salinispora pacifica sp. nov., an actinomycete from marine sediments. Antonie Van Leeuwenhoek 103: 1069–1078. - PubMed
    1. Anderson MJ. (2001). A new method for non-parametric multivariate analysis of variance. Austral Ecol 26: 32–46.
    1. Bellenger JP, Wichard T, Kustka AB, Kraepiel AML. (2008). Uptake of molybdenum and vanadium by a nitrogen-fixing soil bacterium using siderophores. Nat Geosci 1: 243–246.
    1. Berdy J. (2005). Bioactive microbial metabolites. A personal view. J Antibiot 58: 1–26. - PubMed

Publication types

MeSH terms