. 2015 Aug 4:6:7806.
doi: 10.1038/ncomms8806.

Diet and specific microbial exposure trigger features of environmental enteropathy in a novel murine model

Affiliations

Diet and specific microbial exposure trigger features of environmental enteropathy in a novel murine model

Eric M Brown et al. Nat Commun. .

Abstract

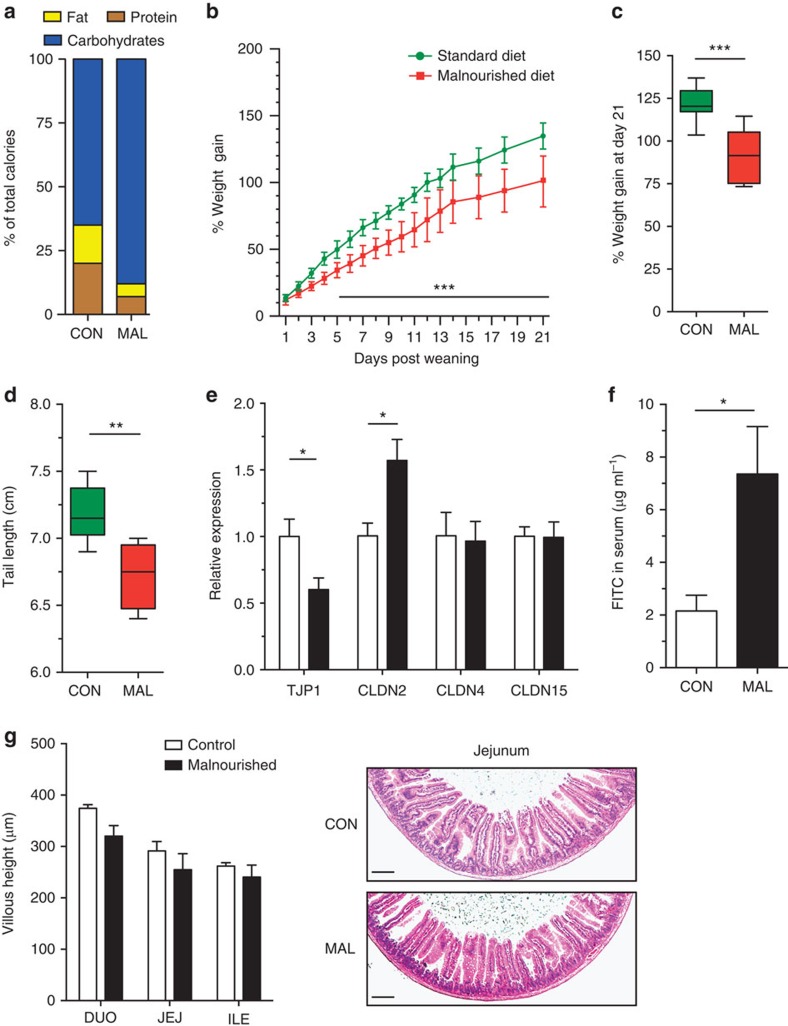
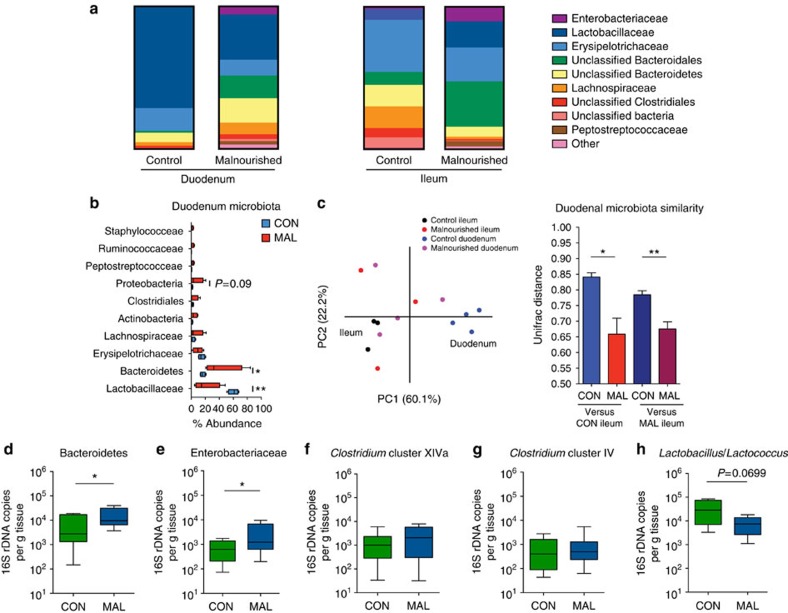
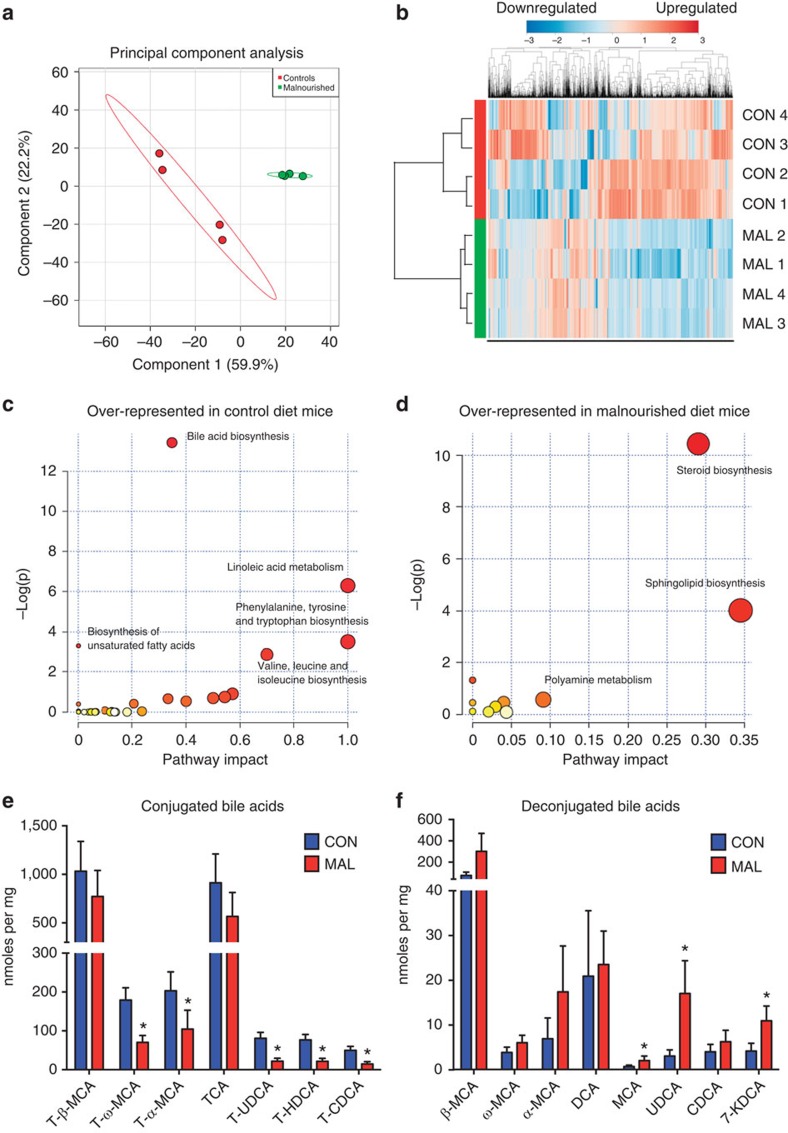
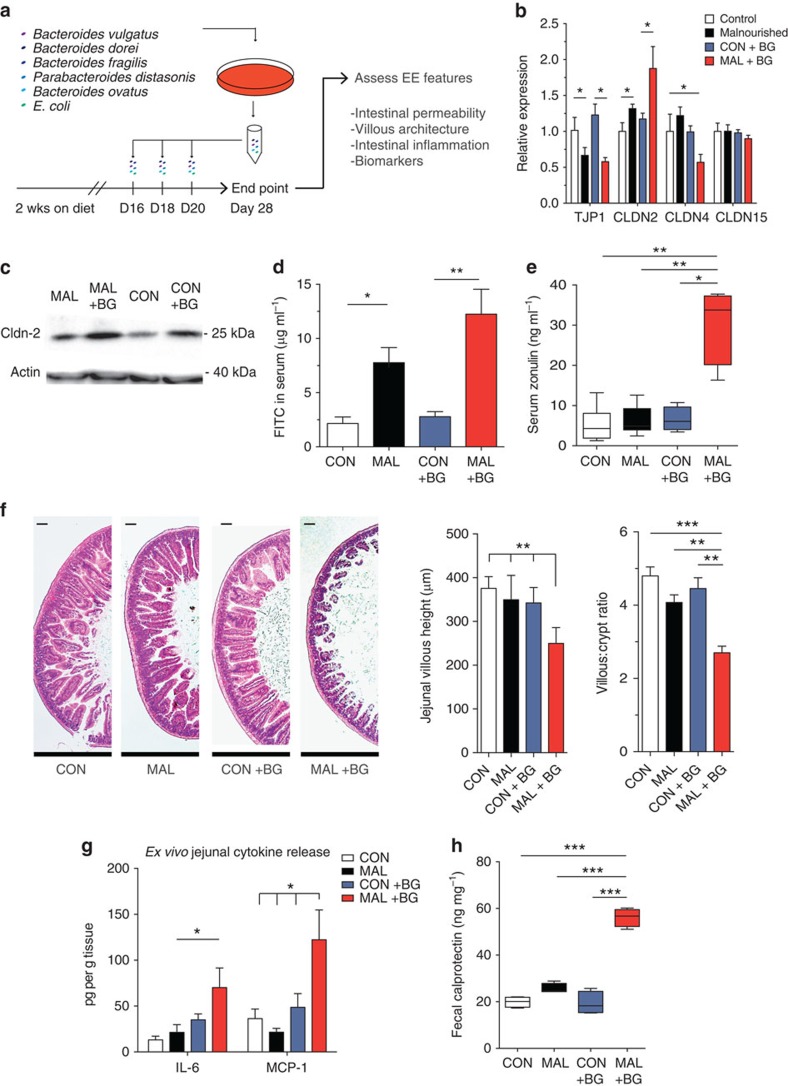
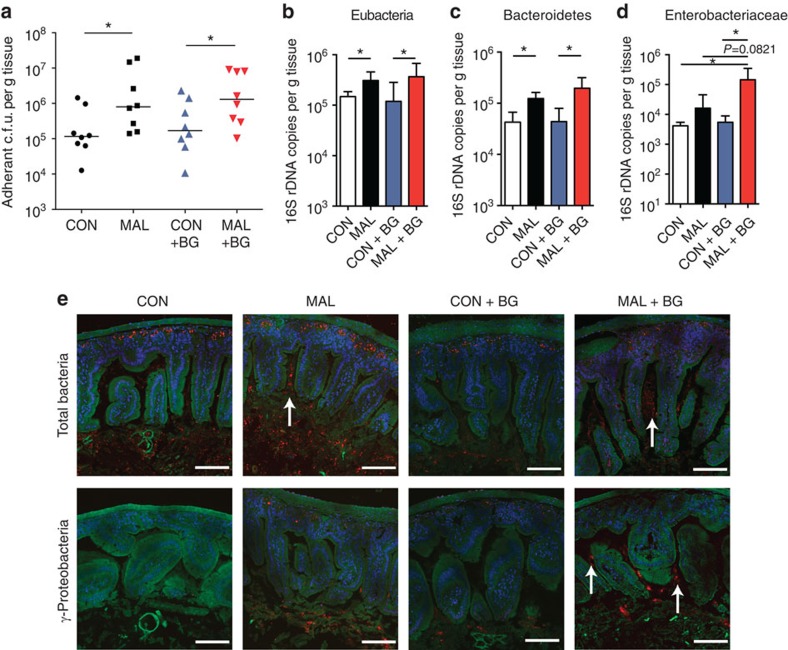
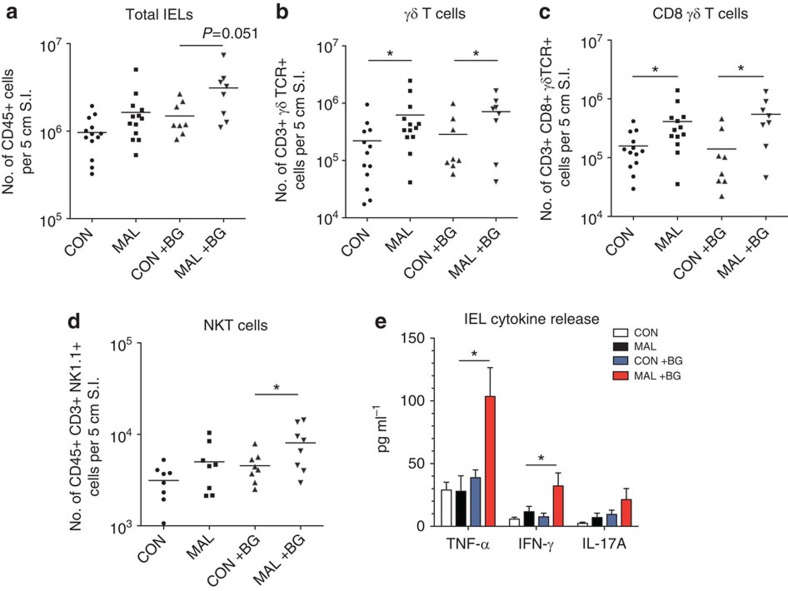
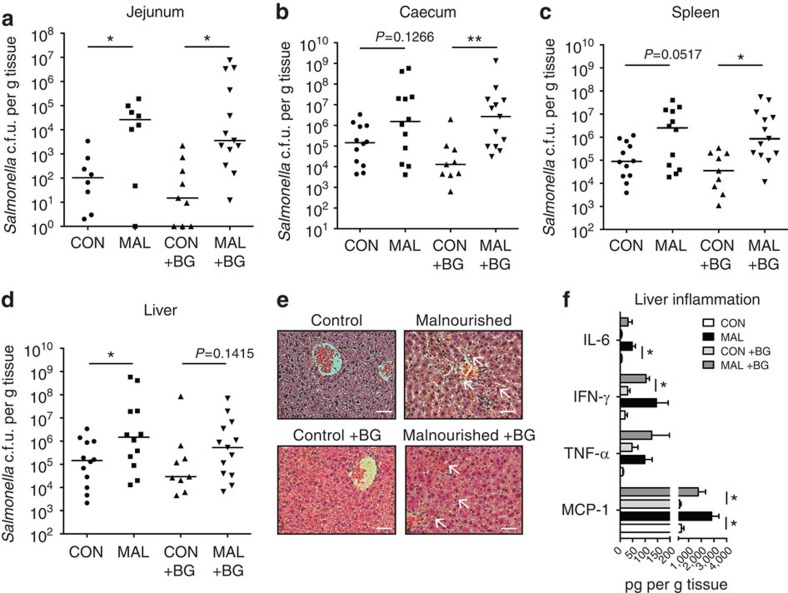
Environmental enteropathy (EE) is a subclinical chronic inflammatory disease of the small intestine and has a profound impact on the persistence of childhood malnutrition worldwide. However, the aetiology of the disease remains unknown and no animal model exists to date, the creation of which would aid in understanding this complex disease. Here we demonstrate that early-life consumption of a moderately malnourished diet, in combination with iterative oral exposure to commensal Bacteroidales species and Escherichia coli, remodels the murine small intestine to resemble features of EE observed in humans. We further report the profound changes that malnutrition imparts on the small intestinal microbiota, metabolite and intraepithelial lymphocyte composition, along with the susceptibility to enteric infection. Our findings provide evidence indicating that both diet and microbes combine to contribute to the aetiology of EE, and describe a novel murine model that can be used to elucidate the mechanisms behind this understudied disease.


Figures

Figure 1
Figure 1. Assessment of the growth rate and intestinal barrier function in C57BL/6 mice fed a malnourished or isocaloric control diet.
(a) A schematic of the components of each diet, expressed as a per cent of total calories. (b) Mice were given each diet post weaning, and daily weight change was assessed daily over a period of 21 days. Data are representative of the three independent experiments, n=8 mice per group. Data points represent the mean and error bars indicate the s.d. (***P<0.001, repeated measures analysis of variance). After 3 weeks of being fed each diet, the total amount of (c) weight gained and (d) final tail lengths were calculated. In the box and whisker plots shown, the middle bar represents the mean, the bottom and top of the box are the first and third quartiles, respectively, and whiskers indicate the range of the data. Data are representative of three independent experiments, n=8 mice per group (Student's t-test **P<0.01). (e) The jejunal mRNA expression of TJP1, CLDN2, CLDN4 and CLDN15 are expressed as fold change relative to the control-fed mice. Bars indicate the mean with s.e.m., and are representative of two independent experiments, eight mice per group (*P<0.05, Student's t-test). (f) Concentration of FITC in the serum was assessed 4 h post administration orally, after mice were fed each diet for 3 weeks. Bars indicate the mean with s.e.m., and are representative of two independent experiments, n=8 per group (*P<0.05, Student's t-test). (g) The average measured villous height in the duodenum (DUO), jejunum (JEJ) and ileum (ILE) with representative H&E-stained images of jejunum sections from mice exposed to each diet. Scale bar, 100 μm (in length). Bar graph indicates the mean with s.e.m., and is representative of three independent experiments, eight mice per group. CON, control; MAL, malnourished.
Figure 2
Figure 2. Relative abundance of the small intestinal microbiota in malnourished and control mice.
(a) A chart summarizing the pooled per cent abundance of the duodenal (n=4) and ileal (n=3) microbiota by family classification using the 16S rRNA gene. (b) A PCA plot of the microbial communities in the duodenum (n=4) and ileum (n=3) of mice on each diet. Communities were plotted based on a measure of UniFrac distance between the communities. This UniFrac distance measure was used to quantify the similarity between the microbiota in the duodenum of malnourished and control mice to the control ileum (left two bars) and the malnourished ileum (right two bars). A lower value indicates greater community similarity. Bars indicate the mean with s.e.m. (c) OTUs at the phylum and family level of taxonomy were plotted on a box and whisker graph to show changes in per cent abundance relative to the total number of OTUs in the duodenum of malnourished and control mice. OTUs from the Lactobacillaceae (**P<0.01), Bacteroidetes (*P<0.05) and Proteobacteria (P=0.09) were the three most significantly changed taxa between the mice (Mann–Whitney U-test). (dh) Real-time qPCR analysis of (d) mouse intestinal Bacteroidetes-specific 16S rDNA, (e) Enterobacteriaceae-specific 16S rDNA, (f) Clostridium cluster XIVa 16S rDNA, (g) Clostridium cluster IV 16S rDNA and (h) Lactobacillus/Lactococcus in each gram of duodenal tissue. Analysis was performed on DNA extracted from duodenal tissue of malnourished and control mice. Data are pooled from 3 independent experiments, 12 mice per group, and bars indicate the mean with s.e.m. (*P<0.05, Student's t-test). CON, control; MAL, malnourished.
Figure 3
Figure 3. Untargeted and targeted metabolomics of the small intestinal metabolome.
(a) A PCA plot showing separation of metabolomic data as detected by the positive ion channel from malnourished mice (green) and control mice (red). (b) A heat map of the relative abundance of all metabolites identified from the small intestinal metabolome as detected by the positive ion channel from malnourished and control mice (n=4). The malnourished (MAL) and control (CON) samples clustered together in the dendogram based on cluster analysis by the Ward method, with a Pearson distance measure. The heat map scale is a log2 base, from the range of −3 (blue) to +3 (red). (c,d) Plots showing over-represented pathways using Metaboanalyst 2.5 software in (c) control mice and (d) malnourished mice, as identified by the Kyoto Encyclopedia of Genes and Genomes database. The plot is graphed based on the log(P value; Welch's t-test; y axis) and per cent of pathway impacted (x axis). The size of the circles represents the number of metabolites identified to be part of the pathway. (e) Tauro-conjugated bile acid and (f) unconjugated bile acid concentrations in the small intestine of malnourished (n=3) and control (n=4) as determined by targeted metabolomics. Bars represent the mean±s.e.m., (*P<0.05, Mann–Whitney U-test). CA, cholic acid; CDCA, chenodeoxycholic acid; HDCA, hyodeoxycholic acid; KDCA, ketodeoxycholic acid; MCA, muricholic acid; T, tauro conjugation; UDCA, ursodeoxycholic acid.
Figure 4
Figure 4. Characterizing the impact of Bacteroidales–E. coli oral exposure on small intestinal histopathology, inflammation and intestinal permeability in malnourished and control mice.
(a) A schematic of the experimental design used to administer the Bacteroidales–E. coli cocktail. (b) The jejunal mRNA levels of TJP1, CLDN2, CLDN4 and CLDN15 were determined on unexposed mice on each diet (white and black bars), and BG-exposed mice on each diet (blue and red bars). The values are expressed as fold change relative to the control, unexposed mice. Representative of three independent experiments, n=5 per group. (c) Levels of CLDN2 protein blotted from extracted protein from jejunal IECs relative to the actin control. Blot is representative of three samples and two independent experiments (Supplementary Fig. 14). (d) Four hours after FITC–dextran administration, concentration of FITC in the serum in malnourished and control mice (n=8), and BG-exposed malnourished and control mice (n=8). Representative of two independent experiments. (e) Box and whisker plot of the concentration of zonulin in the sera of malnourished and control mice (n=8) and BG-exposed malnourished and control mice (n=8). Data are pooled from two independent experiments. (f) Histological assessment of H&E-stained jejunal tissues from BG-exposed and unexposed malnourished and control mice. Scale bars, 100 μm (in length). Images and graphs are representative of three independent experiments, five mice per group. (g) Concentrations of IL-6 and MCP-1 released in cultured jejunal tissue sections from BG-exposed and unexposed malnourished and control mice as measured by ELISA. Data are representative of two independent experiments, five mice per group. (h) Box and whisker plot of the concentration of faecal calprotectin in BG-exposed or unexposed malnourished mice (n=4 per group). All data in standard bar graphs are presented as the means with s.e.m. Box and whisker plots have a middle band that represents the mean, the bottom and top of box are the first and third quartiles, respectively, and the whiskers indicate the range of the data. Statistical analysis was performed using the one-way analysis of variance with post hoc Tukey's test (*P<0.05, **P<0.01, ***P<0.001). CON, control; MAL, malnourished; Wks, weeks.
Figure 5
Figure 5. Assessing the abundance, colonization and localization of small intestinal microbiota in mice with or without Bacteroidales–E. coli oral exposure.
(a) The total adherent anaerobic colony-forming units (c.f.u.'s) per gram of washed jejunal tissue in BG-exposed or unexposed malnourished and control mice. Data are pooled from two independent experiments (n=8), and bars indicate median values (*P<0.05, Mann–Whitney U-test). Real-time qPCR analysis of (b) the total Eubacteria 16S rDNA copies, (c) mouse intestinal Bacteroidetes-specific 16S rDNA and (d) Enterobacteriaceae-specific 16S rDNA, in each gram of jejunal tissue. Analysis was performed on DNA extracted from washed jejunum tissue of BG-exposed or unexposed malnourished and control mice. All data in bd are pooled from two independent experiments (n=8), and bars indicate the mean with s.e.m. (*P<0.05, one-way analysis of variance with post hoc Tukey's test). (e) Carnoy's-fixed jejunal tissues were probed for total 16S rDNA (Eub338) and γ-Proteobacteria-specific 16S rDNA (Gam42a) abundance using FISH. Images are representative of BG-exposed or unexposed malnourished and control mice. Actin is stained in green (488-Phalloidin), cell nuclei in blue (4,6-diamidino-2-phenylindole) and bacteria in red (Eub338 and Gam42a). Scale bars, 100 μm length, and white arrows point towards the presence of tissue-associated bacteria or bacteria within the villi. CON, control; MAL, malnourished.
Figure 6
Figure 6. Flow cytometry and cytokine secretion analysis of small intestinal IELs.
The total number of live (a) CD45+ cells, (b) CD45+CD3+γδTCR+ cells, (c) CD45+CD3+CD8+γδTCR+ cells and (d) CD45+CD3+NK1.1+ cells isolated from the upper 5 cm of the small intestine (duodenum) in BG-exposed and unexposed mice on each diet. Data from the unexposed malnourished and control mice are representative of three independent experiments pooled (n=13). Data from the BG-exposed malnourished and control mice are representative of two independent experiments (n=8). Bars indicate the mean values (*P<0.05, one-way analysis of variance (ANOVA) with post hoc Tukey's test). (e) Concentrations of TNF-α, IFN-γ and IL-17A after stimulation of cultured IELs for 48 h. Data are pooled from two independent experiments (n=8 per group). Bars indicate the mean values (*P<0.05, one-way ANOVA with post hoc Tukey's test). CON, control; MAL, malnourished.
Figure 7
Figure 7. Systemic colonization and tissue burden of S.Typhimurium in malnourished and control mice.
Total c.f.u. of Salmonella per gram of tissue was assessed 3 days post infection in the (a) jejunum, (b) caecum, (c) spleen and (d) liver in BG-exposed and unexposed malnourished and control mice fed the diet for 3 weeks. Data are pooled from two independent experiments (n=8–13 per group), and bars indicate median values (*P<0.05, Mann–Whitney U-test). (e) H&E-stained slices of the livers of BG-exposed and unexposed malnourished and control mice 3 days post Salmonella infection. Scale bars, 100 μm in length, and white arrows point towards pathological features. (f) Concentrations of IL-6, MCP-1, TNF-α and IFN-γ per gram of liver tissue 3 days post Salmonella infection as measured by cytokine bead array. Data are pooled from two independent experiments (n=8–13 per group). Bars indicate the mean with s.e.m. (*P<0.05, Student's t-test). CON, control; MAL, malnourished.

Comment in

  • Malnutrition: New mouse model of EE.
    Ray K. Ray K. Nat Rev Gastroenterol Hepatol. 2015 Sep;12(9):489. doi: 10.1038/nrgastro.2015.144. Epub 2015 Aug 18. Nat Rev Gastroenterol Hepatol. 2015. PMID: 26284563 No abstract available.

References

    1. Black R. E. et al.. Maternal and child undernutrition: global and regional exposures and health consequences. Lancet 371, 243–260 (2008). - PubMed
    1. Guerrant R. L., Oria R. B., Moore S. R., Oria M. O. & Lima A. A. Malnutrition as an enteric infectious disease with long-term effects on child development. Nutr. Rev. 66, 487–505 (2008). - PMC - PubMed
    1. Kar B., Rao S. & Chandramouli B. A. Cognitive development in children with chronic protein energy malnutrition. Behav. Brain Funct. 4, 1–12 (2008). - PMC - PubMed
    1. Gordon J. I., Dewey K. G., Mills D. A. & Medzhitov R. M. The human gut microbiota and undernutrition. Sci. Transl. Med. 4, 137ps112 (2012). - PubMed
    1. Subramanian S. et al.. Persistent gut microbiota immaturity in malnourished Bangladeshi children. Nature 510, 417–421 (2014). - PMC - PubMed

Publication types

MeSH terms

Associated data