. 2015 Aug 4;10(8):e0134394.
doi: 10.1371/journal.pone.0134394. eCollection 2015.

Neuroimmune and Neuropathic Responses of Spinal Cord and Dorsal Root Ganglia in Middle Age

Affiliations

Neuroimmune and Neuropathic Responses of Spinal Cord and Dorsal Root Ganglia in Middle Age

William Galbavy et al. PLoS One. .

Abstract

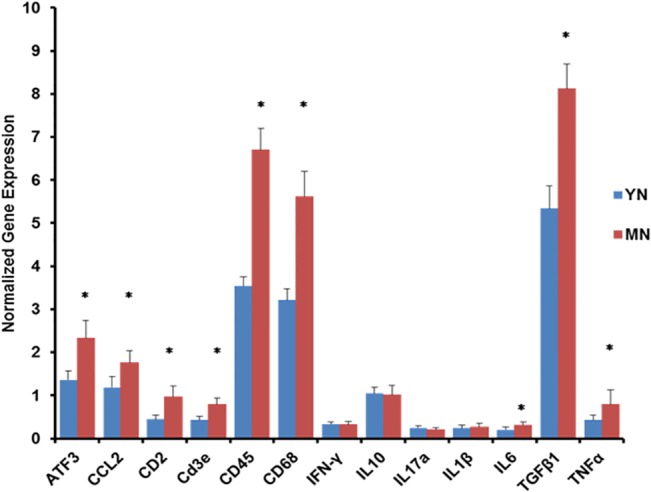
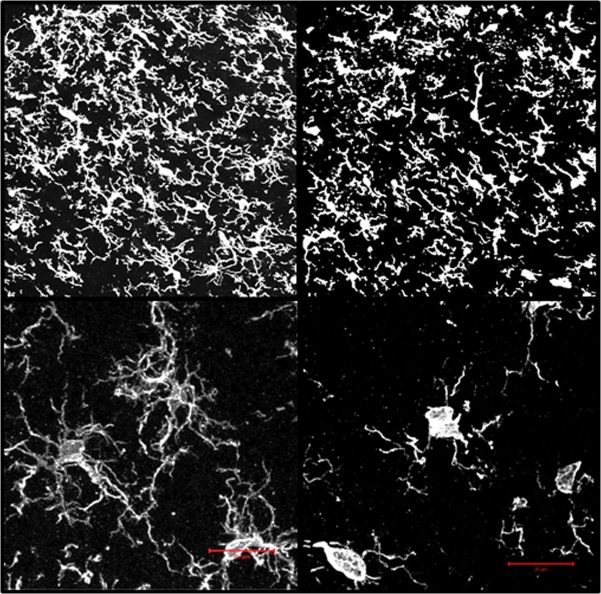
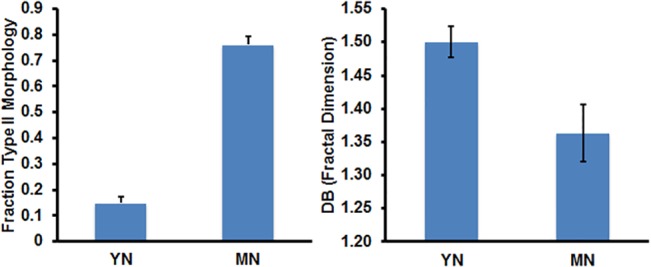
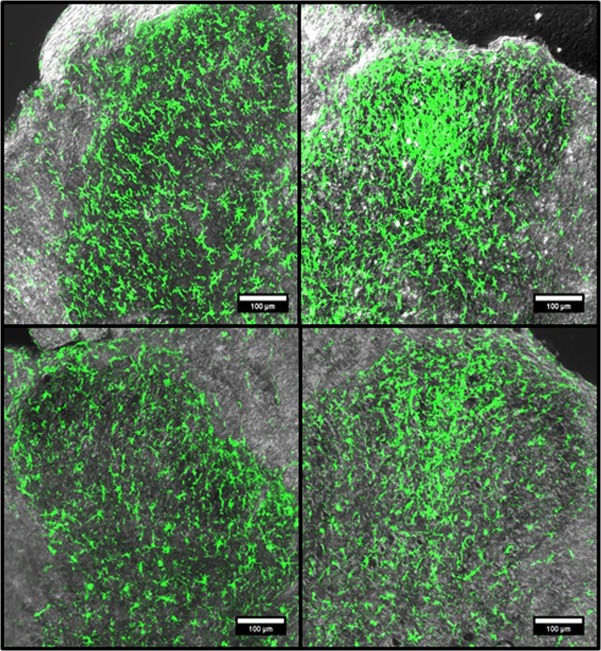
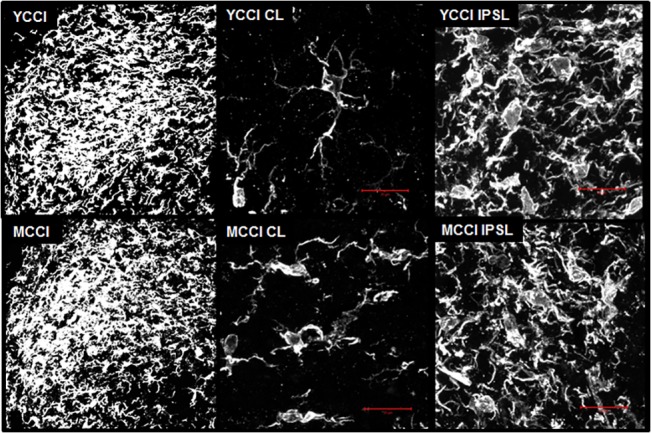
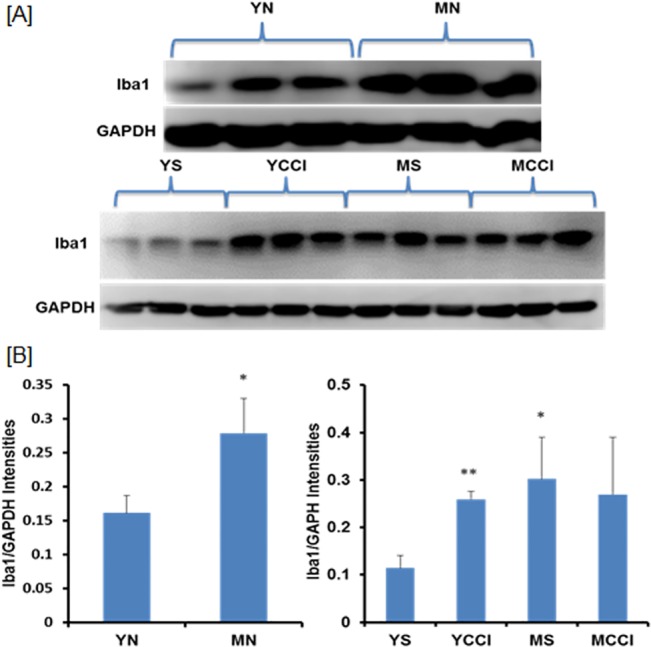
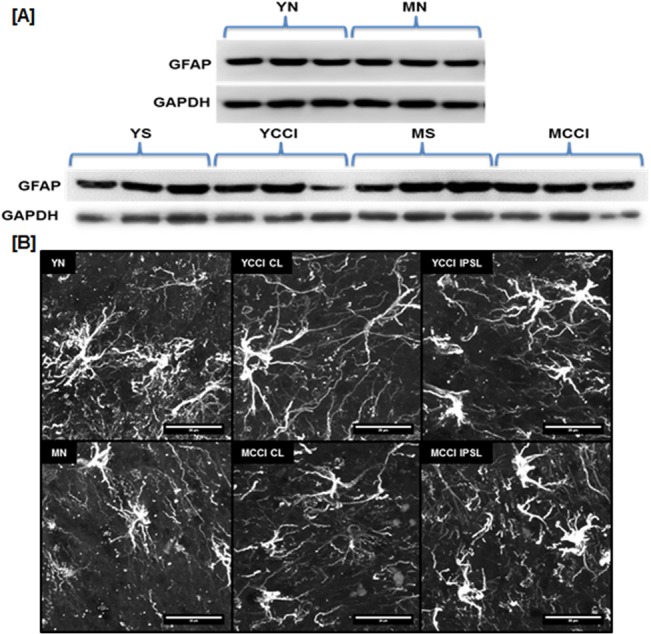
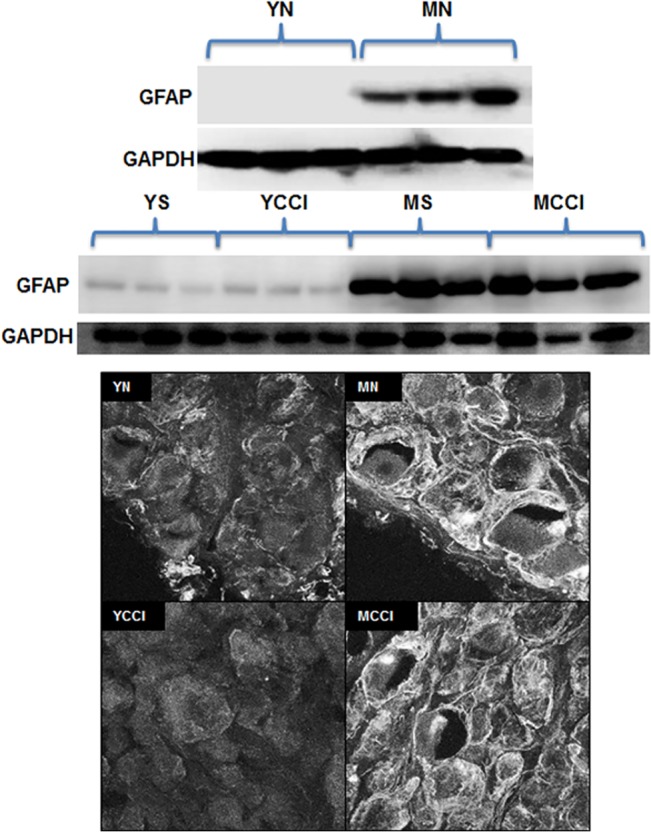
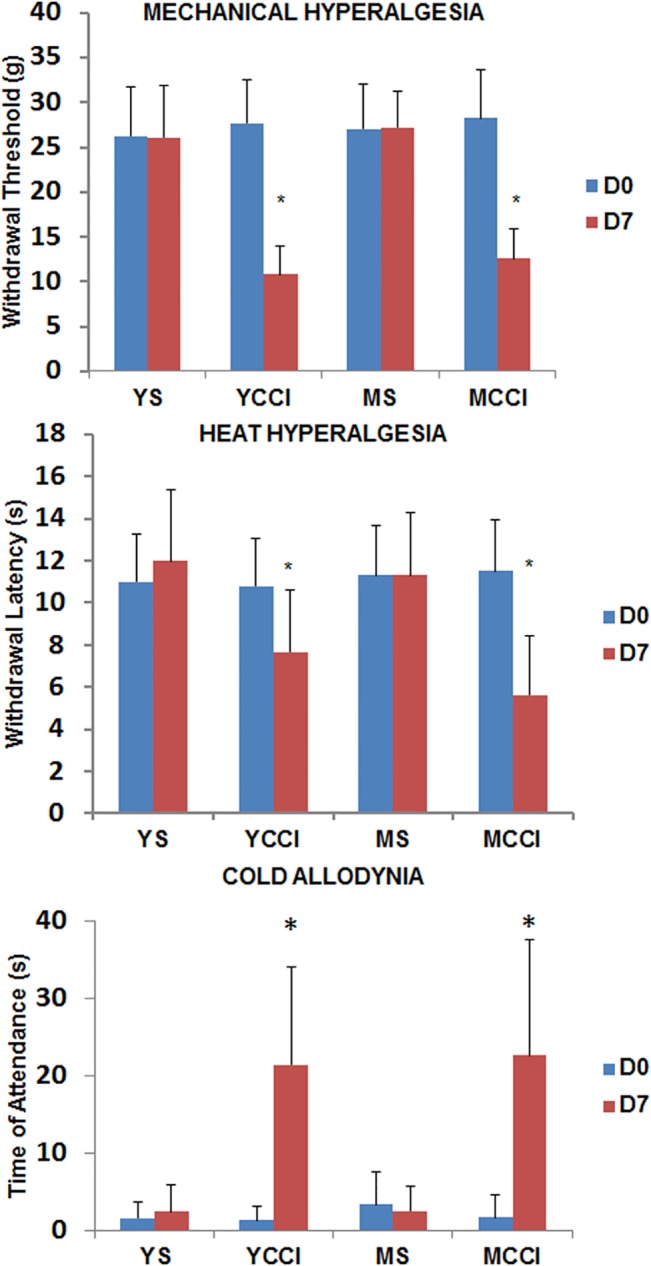
Prior studies of aging and neuropathic injury have focused on senescent animals compared to young adults, while changes in middle age, particularly in the dorsal root ganglia (DRG), have remained largely unexplored. 14 neuroimmune mRNA markers, previously associated with peripheral nerve injury, were measured in multiplex assays of lumbar spinal cord (LSC), and DRG from young and middle-aged (3, 17 month) naïve rats, or from rats subjected to chronic constriction injury (CCI) of the sciatic nerve (after 7 days), or from aged-matched sham controls. Results showed that CD2, CD3e, CD68, CD45, TNF-α, IL6, CCL2, ATF3 and TGFβ1 mRNA levels were substantially elevated in LSC from naïve middle-aged animals compared to young adults. Similarly, LSC samples from older sham animals showed increased levels of T-cell and microglial/macrophage markers. CCI induced further increases in CCL2, and IL6, and elevated ATF3 mRNA levels in LSC of young and middle-aged adults. Immunofluorescence images of dorsal horn microglia from middle-aged naïve or sham rats were typically hypertrophic with mostly thickened, de-ramified processes, similar to microglia following CCI. Unlike the spinal cord, marker expression profiles in naïve DRG were unchanged across age (except increased ATF3); whereas, levels of GFAP protein, localized to satellite glia, were highly elevated in middle age, but independent of nerve injury. Most neuroimmune markers were elevated in DRG following CCI in young adults, yet middle-aged animals showed little response to injury. No age-related changes in nociception (heat, cold, mechanical) were observed in naïve adults, or at days 3 or 7 post-CCI. The patterns of marker expression and microglial morphologies in healthy middle age are consistent with development of a para-inflammatory state involving microglial activation and T-cell marker elevation in the dorsal horn, and neuronal stress and satellite cell activation in the DRG. These changes, however, did not affect the establishment of neuropathic pain.


Conflict of interest statement

Competing Interests: The authors have declared that no competing interests exist.

Figures

Fig 1
Fig 1. Neuroimmune gene expression profile in lumbar spinal cords of naïve young and middle-aged rats.
Expression levels were normalized to the geomean of Hprt1 and Pplb expression and the ratios multiplied by 100. Results are presented as means +/- SD. Significance of differences between YN v MN * p < 0.0015.
Fig 2
Fig 2. Iba1 immunofluorescence images of the ipsilateral dorsal horns from naïve young (YN) and middle-aged (MN) rats rendered in 3D.
Upper Panels: individual optical sections (1.25 μm intervals through 25 μm thick sections) were acquired with a LSCM and 40x 1.4 NA objective lens and then recombined and rendered as three-dimensional images. Lower Panels: Two-photon immunofluorescence 3D renderings of Iba1 positive dorsal horn microglia from young and middle-aged naïve (YN and MN). Image stacks (0.44 μm optical sections through 25 μm thick specimens) were obtained using a two-photon laser scanning confocal microscope and 100 X 1.4 NA objective lens. Each stack set was recombined to create the 3D rendering. A single plane of the 3D image is shown for each. Scale bar = 25 μm. Rotatable 3D images are also available in S1 and S2 Files.
Fig 3
Fig 3. Analyses of confocal images of Iba1+ cells in sections of lumbar spinal cord dorsal horns from young or middle-aged naïve rats
(Left) Fraction of Iba1+ lumbar microglia exhibiting P2 morphology (see METHODS for description); data are presented as mean +/- SD, n = 3 rats per age group, and 2 independent spinal cord sections per animal; significance of difference in proportions of P2 morphology in YN and MN is p < 0.0001. (Right) DB is the fractal dimension, a measure of complexity related to the numbers of microglial processes and branching; where DB = -lim[logNε/logε], Ni = ith box counting grid and ϵ = box scale/image scale. The non-overlapping 95% confidence intervals of the means of six DB determinations for n = 3 per age group and 2 independent LSC sections per animal.
Fig 4
Fig 4. Representative Iba1 immunofluorescence images of young and middle aged of lumbar spinal cord dorsal horns from post-CCI day 7 animals, ipsilateral or contralateral to injury.
Immunofluorescence confocal images of the dorsal horns stained with Iba1 antibody were combined with corresponding transmitted light images. Young (YCCI) and middle-aged (MCCI) dorsal horns ipsilateral (IPSL) to injury are compared to the contralateral (CL) sides. Scale bars = 100 μm.
Fig 5
Fig 5. Iba1 immunofluorescence of the ipsilateral dorsal horns from post-CCI day 7 young (YCCI) and middle-aged (MCCI) rats rendered in 3D.
Left Panels: optical sections (1.25 μm intervals through 25 μm thick sections) were acquired with a LSCM and 40x 1.4 NA objective lens and then recombined and rendered as three-dimensional images. Middle and Right Panels: image stacks (0.44 μm optical sections through 25 μm thick specimens) were obtained using a two-photon laser scanning confocal microscope and 100 X 1.4 NA objective lens. Each stack set was recombined to create the 3D rendering. A single plane of the 3D image is shown for each. Scale bar = 25 μm.
Fig 6
Fig 6. Levels of Iba1 protein expression in young and middle-aged sham and post-CCI day 7 lumbar spinal cords.
Results were obtained for each sample (n = 3 per age group). A) immunoblots of lumbar spinal cord hemisection samples from naïve animals (Top), and samples ipsilateral to injury (Bottom), were probed with antibodies against the microglial marker Iba1 and house keeping enzyme GAPDH (loading control). B) Results are expressed as the mean ratios Iba1/GAPDH intensities +/- SD; significance YN v MN (*p = 0.0120), left panel, YS v YCCI (**p = 0.0006), YS v MS (*p = 0.0121) and MS v MCCI (p = 0.3500), right panel.
Fig 7
Fig 7. GFAP expression in lumbar spinal cords from young and middle-aged naïve (YN and MN) or post-CCI day 7 animals (YCCI and MCCI).
(A) Immunoblots of lumbar spinal cord extracts taken from naïve hemisections or 7 days post surgery that were probed with antibody against GFAP and loading control GAPDH (n = 3 per group). (B) GFAP immunofluorescence of dorsal horn astrocytes. Lumbar spinal cords were obtained from young and middle-aged naïve (YN and MN) or post-CCI day 7 animals (YCCI and MCCI), either ipsilateral (IPSL) or contralateral (CL) to injury. Optical sections (0.75 μm optical sections through 25 μm thick specimens) were acquired with a LSCM and 60x 1.4 NA objective lens, and the image stacks were then recombined and rendered in 3D. Scale bar = 20 μm
Fig 8
Fig 8. GFAP protein expression in young and middle-aged sham or CCI or naïve DRG.
(A) Immunoblots of DRG extracts were probed with antibody against GFAP or loading control GAPDH antibody. Upper panel: young and middle-aged naïve (YN and MN) DRG; lower panel: young and middle-aged sham (YS and MS) or CCI (YCCI and MCCI) DRG. (B) Typical immunofluorescence confocal images of 25 μm thick sections of DRG stained with GFAP antibody. Confocal images were acquired with a LSCM and 60 X 1.4 NA objective lens. L4 and L5 DRG were obtained ipsilateral to injury. Scale bar = 50 μm
Fig 9
Fig 9. Evoked pain responses at post-injury day 7 in young and middle aged rats before or after sham or CCI surgery.
Mechanical hyperalgesia (Top), measured as threshold pressure eliciting paw withdrawal; heat hyperalgesia (Middle), measured as latency time to hind paw withdrawal from a radiant heat source; cold allodynia (Bottom), measured as time of attendance to the affected paw. Results are presented as means +/- SD, n = 11 YS, YCCI, MCCI and n = 9 MS. Data were subjected to Two-Way ANOVA comparing day 7 to pre-injury baseline and differences due to age. * p< 0.0001 comparing day 7 to baseline; there were no significant differences related to age. Similar results were obtained on Day 3, and on Day 7 comparing ipsilateral to contralateral hind paw responses (S2 Fig).

References

    1. Franceschi C, Capri M, Monti D, Giunta S, Olivieri F, Sevini F, et al. Inflammaging and anti-inflammaging: a systemic perspective on aging and longevity emerged from studies in humans. Mechanisms of ageing and development. 2007;128(1):92–105. Epub 2006/11/23. 10.1016/j.mad.2006.11.016 . - DOI - PubMed
    1. Sansoni P, Vescovini R, Fagnoni F, Biasini C, Zanni F, Zanlari L, et al. The immune system in extreme longevity. Exp Gerontol. 2008;43(2):61–5. Epub 2007/09/18. doi: S0531-5565(07)00139-8 [pii] 10.1016/j.exger.2007.06.008 . - DOI - PubMed
    1. Franceschi C, Valensin S, Lescai F, Olivieri F, Licastro F, Grimaldi LM, et al. Neuroinflammation and the genetics of Alzheimer's disease: the search for a pro-inflammatory phenotype. Aging (Milano). 2001;13(3):163–70. Epub 2001/07/10. . - PubMed
    1. Giunta B, Fernandez F, Nikolic WV, Obregon D, Rrapo E, Town T, et al. Inflammaging as a prodrome to Alzheimer's disease. Journal of neuroinflammation. 2008;5:51 Epub 2008/11/19. 10.1186/1742-2094-5-51 - DOI - PMC - PubMed
    1. Mosher KI, Wyss-Coray T. Microglial dysfunction in brain aging and Alzheimer's disease. Biochemical pharmacology. 2014;88(4):594–604. Epub 2014/01/22. 10.1016/j.bcp.2014.01.008 - DOI - PMC - PubMed

Publication types

MeSH terms