. 2015 Aug 4;11(8):e1005073.
doi: 10.1371/journal.ppat.1005073. eCollection 2015 Aug.

Double-Edge Sword of Sustained ROCK Activation in Prion Diseases through Neuritogenesis Defects and Prion Accumulation

Affiliations

Double-Edge Sword of Sustained ROCK Activation in Prion Diseases through Neuritogenesis Defects and Prion Accumulation

Aurélie Alleaume-Butaux et al. PLoS Pathog. .

Abstract

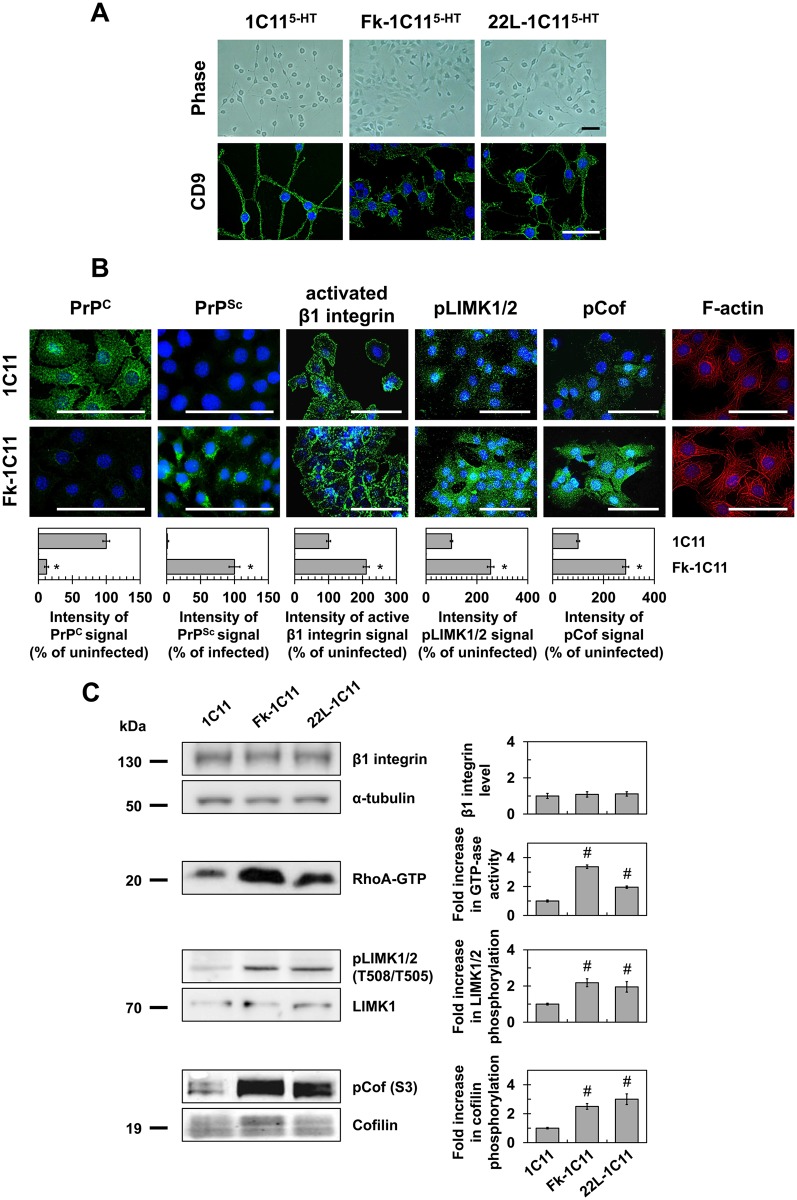
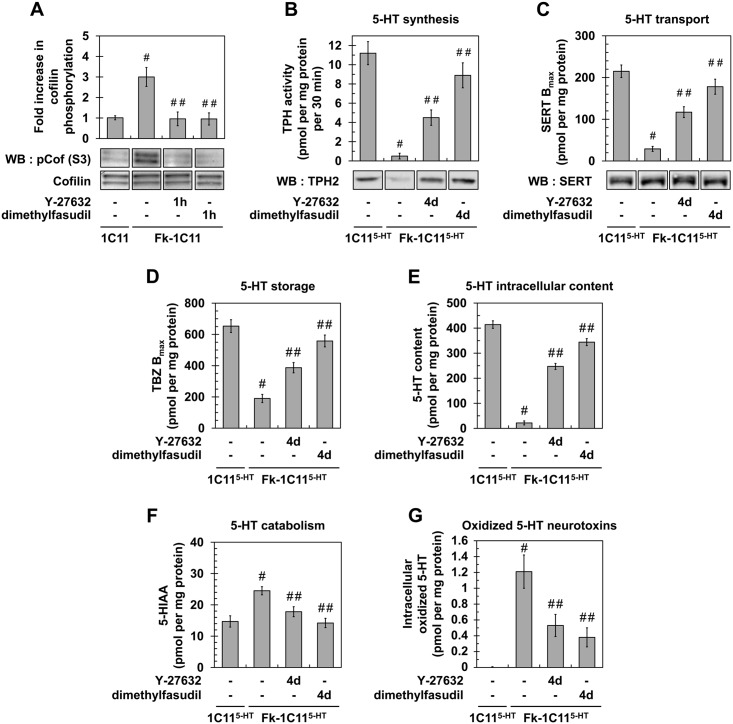
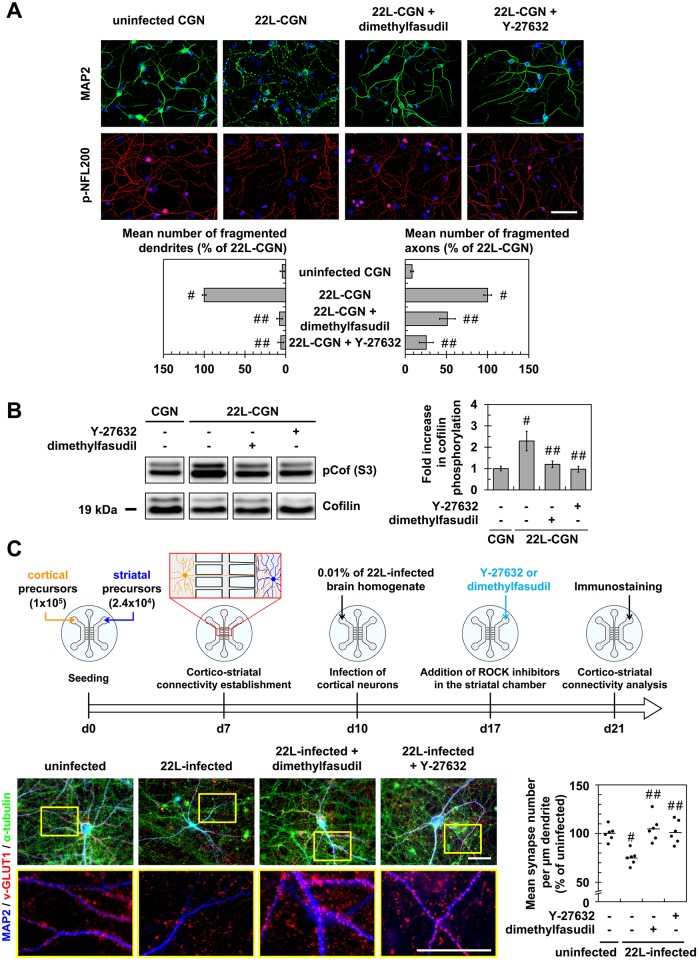
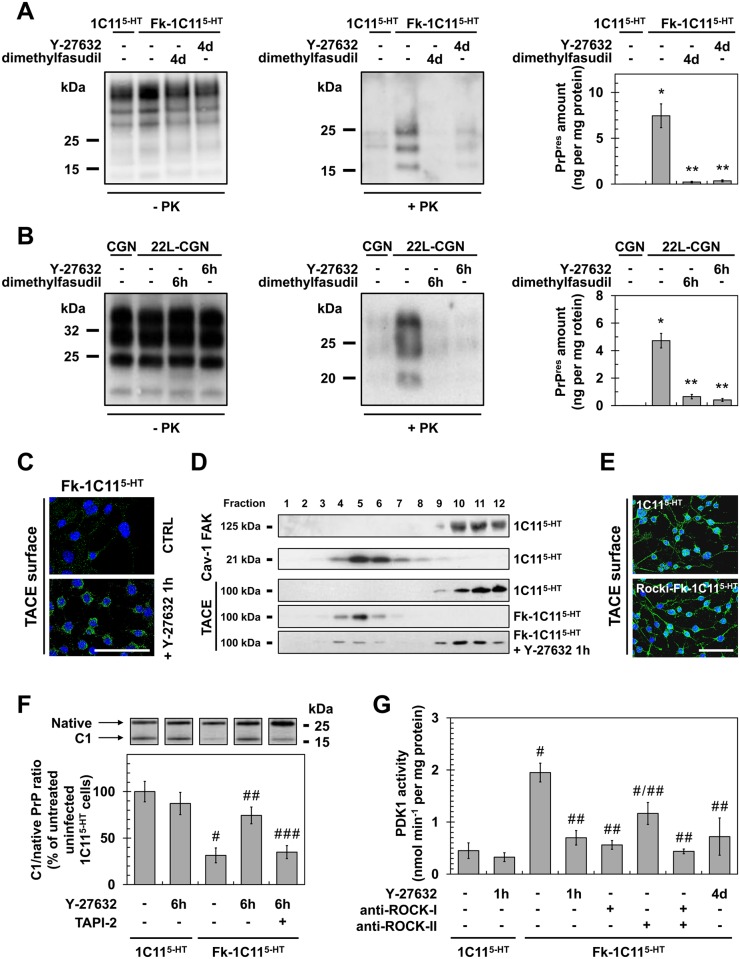
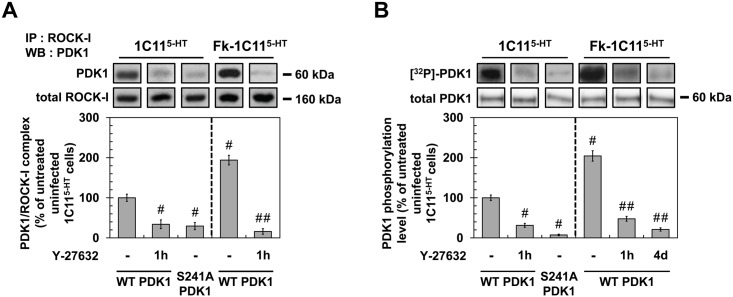
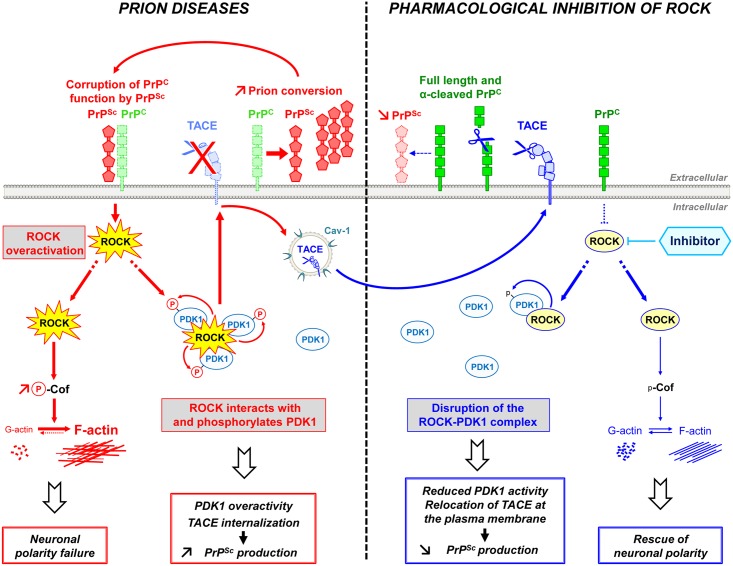
In prion diseases, synapse dysfunction, axon retraction and loss of neuronal polarity precede neuronal death. The mechanisms driving such polarization defects, however, remain unclear. Here, we examined the contribution of RhoA-associated coiled-coil containing kinases (ROCK), key players in neuritogenesis, to prion diseases. We found that overactivation of ROCK signaling occurred in neuronal stem cells infected by pathogenic prions (PrPSc) and impaired the sprouting of neurites. In reconstructed networks of mature neurons, PrPSc-induced ROCK overactivation provoked synapse disconnection and dendrite/axon degeneration. This overactivation of ROCK also disturbed overall neurotransmitter-associated functions. Importantly, we demonstrated that beyond its impact on neuronal polarity ROCK overactivity favored the production of PrPSc through a ROCK-dependent control of 3-phosphoinositide-dependent kinase 1 (PDK1) activity. In non-infectious conditions, ROCK and PDK1 associated within a complex and ROCK phosphorylated PDK1, conferring basal activity to PDK1. In prion-infected neurons, exacerbated ROCK activity increased the pool of PDK1 molecules physically interacting with and phosphorylated by ROCK. ROCK-induced PDK1 overstimulation then canceled the neuroprotective α-cleavage of normal cellular prion protein PrPC by TACE α-secretase, which physiologically precludes PrPSc production. In prion-infected cells, inhibition of ROCK rescued neurite sprouting, preserved neuronal architecture, restored neuronal functions and reduced the amount of PrPSc. In mice challenged with prions, inhibition of ROCK also lowered brain PrPSc accumulation, reduced motor impairment and extended survival. We conclude that ROCK overactivation exerts a double detrimental effect in prion diseases by altering neuronal polarity and triggering PrPSc accumulation. Eventually ROCK emerges as therapeutic target to combat prion diseases.


Conflict of interest statement

I have read the journal's policy and the authors of this manuscript have the following competing interests: JML has non-financial competing interests with Hoffmann La Roche Ltd laboratories. He acts as an expert witness for Hoffmann La Roche Ltd laboratories. This does not alter our adherence to all PLOS Pathogens policies on sharing data and materials.

Figures

Fig 1
Fig 1. Prion infection of 1C11 neuronal stem cells alters neuritogenesis by overactivating the RhoA-ROCK-LIMK-cofilin pathway and modifying the actin network.
(A) Phase pictures and cell contour staining with anti-tetraspanin CD9 antibody of Fk- or 22L-infected 1C115-HT cells as compared to uninfected neuronal 1C115-HT cells (day 4). Scale bars, 50 μm. (B) Immunofluorescent labeling of PrPC, PrPSc and activated β1 integrins at the surface of Fk-infected 1C11 cells as compared to their uninfected counterparts using SAF32, ICSM33 and 9EG7 antibodies, respectively. Immunofluorescent labeling of phospho-LIMK1/2 on Thr508/505 residues and phospho-cofilin on Ser3 and F-actin staining using TRITC-phalloidin within Fk-infected and uninfected 1C11 cells. Scale bars, 50 μm. (C) Western blots for total level of β1 integrins, phosphorylated LIMK1/2 and phosphorylated cofilin in 1C11 and Fk-1C11 cells. RhoA GTPase activity measured by pull-down assay in 1C11 and Fk-1C11 cells. Quantitative data are shown as the mean ± s.e.m. * P < 0.01 versus uninfected cells. # P < 0.05 versus uninfected cells.
Fig 2
Fig 2. Inhibition of ROCK restores neurotransmitter-associated functions in prion-infected 1C115-HT neuronal cells.
(A) Western blot and histogram quantifications for phosphorylated cofilin on Ser3 in Fk-infected 1C11 cells treated or not with dimethylfasudil (2 μM) or Y-27632 (100 μM) for 1h versus uninfected 1C11 cells. (B) 5-HT synthesis (TPH activity) and TPH immunoblotting, (C) transport by SERT (paroxetine binding) and SERT immunoblotting, (D) storage (VMAT-2 tetrabenazine binding), (E) intracellular content, and (F) catabolism (5-HIAA concentration) in uninfected 1C115-HT cells and Fk-infected 1C115-HT cells differentiated for 4 days along the serotonergic pathway in the absence or presence of Y-27632 (100 μM) or dimethylfasudil (2 μM). (G) Concentration of 5-HT-derived oxidized species in cell lysates of 1C115-HT cells and Fk-1C115-HT differentiated in the absence or presence of Y-27632 or dimethylfasudil. n = 6 for each condition. Values are the mean ± s.e.m. # P < 0.05 versus uninfected cells. ## P < 0.05 versus infected cells.
Fig 3
Fig 3. Inhibition of ROCK protects primary neuronal cultures from prion-induced synapse disconnection and neurite degradation.
(A) Immunofluorescent labeling of dendrites (anti-MAP2 staining, green) and axons (phospho-NFL200 staining, red) of cerebellar granule neurons (CGNs) infected with 22L prions for 7 days and then treated 4 days with Y-27623 (100 μM) or dimethylfasudil (2 μM) as compared to uninfected CGNs. Scale bars, 50 μm. Quantification histograms of neurons with fragmented dendrites or axons. (B) Western blot and histogram quantifications for phosphorylated cofilin on Ser3 in 22L-infected CGNs treated or not with dimethylfasudil or Y-27632 versus uninfected CGNs. (C) Schematic of the experimental procedure with a reconstructed cortico-striatal neuronal network on microfluidic devices and immunofluorescent labelings. Cortical neurons of a 10 days-in-vitro (DIV)-aged cortico-striatal network were infected with 22L prions for 7 days. Striatal neurons were then treated with Y-27632 (20 μM) or dimethylfasudil (2 μM) for 4 days. Dendrites (anti-MAP2 staining, blue) of striatal neurons and synapses (anti-v-GLUT1 staining, red) and axons (anti-α-tubulin, green) of cortical neurons were labeled with specific antibodies. Close proximity of blue (striatal dendrites) and red (v-GLUT1 cortical presynaptic terminal) signals indicates cortico-striatal connectivity. Scale bars, 50 μm. Each point corresponds to the mean of number synapses per μm dendrite determined from the analysis of ten pictures. n = 6 for each condition. For each group, individual mean values and mean (line) are shown. # P < 0.05 versus uninfected cells. ## P < 0.05 versus non treated infected cells.
Fig 4
Fig 4. ROCK inhibition lowers PrPSc level by rescuing TACE α-secretase neuroprotective activity towards PrPC in a PDK1-dependent manner.
(A, B) Amount of PrPSc in Rocki-Fk-1C115-HT cells differentiated into serotonergic neuronal cells for 4 days (4d) in the presence of Y-27632 (100 μM) or 22L-infected CGNs exposed for 6 h to Y-27632 (100 μM), as shown by western blotting (left) and quantified by ELISA (right). n = 10 for each condition. (C) Immunofluorescent labeling of TACE at the surface of Fk-infected 1C115-HT cells treated or not with the ROCK inhibitor (Y-27632, 100 μM) for 1 h. Scale bar, 50 μm. (D) Immunoblot analysis of sucrose gradient fractions of membranes of Fk-infected 1C115-HT cells treated or not with Y-27632 (100 μM, 1h) versus uninfected 1C115-HT to assess TACE displacement from the plasma membrane (FAK-enriched fractions) to caveolin-1-enriched vesicles. FAK = Focal Adhesion Kinase. Cav-1 = caveolin-1. (E) Immunofluorescent labeling of TACE at the surface of Rocki-Fk-1C115-HT differentiated for 4 days in the presence of Y-27632 (100 μM) versus uninfected 1C115-HT cells. Scale bar, 50 μm. (F) Western blot analysis (top) of the C1 fragment of PrP (C1) and full-length PrP (native) in Fk-infected 1C115-HT cells treated or not with Y-27632 (100 μM) or a combination of Y-27632 (100 μM) and TAPI-2 (100 μM) for 6 h versus uninfected cells and the ratio (bottom) of C1/native full-length PrP. n = 5 for each condition. (G) PDK1 activity in Fk-infected 1C115-HT cells treated or not with Y-27632 (100 μM, 1 h), in Fk-infected 1C115-HT bombarded with tungsten microprojectiles coated with ROCK-I or ROCK-II antibodies or both, or in Rocki-Fk-1C115-HT cells differentiated for 4 days in the presence of Y-27632 (100 μM) versus uninfected 1C115-HT cells. n = 5 for each condition. Values are the mean ± s.e.m. for all experiments. * P <0.01 versus uninfected cells. ** P <0.01 versus non-treated infected cells. # P <0.05 versus uninfected cells. ## P <0.05 versus non treated infected cells. ### P <0.05 versus infected cells treated with Y-27632.
Fig 5
Fig 5. ROCK-I interacts with PDK1 and phosphorylates PDK1.
(A) Immunoprecipitation of ROCK-I and immunoblotting of PDK1 in uninfected 1C115-HT or Fk-1C115-HT treated or not with Y-27632 (100 μM, 1h) as well as in 1C115-HT transfected with S241A PDK1 mutant. (B) Cell 32P metabolic labeling followed by PDK1 immunoprecipitation and western blotting for PDK1 phosphorylation level in uninfected 1C115-HT or Fk-1C115-HT treated or not with Y-27632 (100 μM, 1h) as well as in 1C115-HT transfected with S241A PDK1 mutant. Values are the mean ± s.e.m. # P < 0.05 versus non treated uninfected cells. ## P < 0.05 versus non treated infected cells.
Fig 6
Fig 6. ROCK inhibition with Y-27632 attenuates prion disease in mice.
(A) Cerebellar immunoperoxidase staining to visualize PrPSc deposition in the cerebellar cortex (CBCX) and deep cerebellar nuclei (DCN) of 22L-infected mice, Scale bars, 100 μm. (B) Immunoperoxidase staining to visualize phosphorylated cofilin on Ser3 in CBCX and DCN of mock-inoculated (SHAM) and 22L-infected mice. Scale bars, 100 μm. (C) Western blot and histogram quantifications for phosphorylated cofilin on Ser3 in 22L-infected mice infused or not with Y-27632 versus SHAM mice. n = 4 in triplicate. (D) Survival curves of SHAM and 22L-inoculated mice via the intracerebellar route (i.c.b.) infused or not with the ROCK inhibitor Y-27632 by intraperitoneal injection (i.p.) starting at 130 days after infection (5 mg per kg body weight per day; 0.25 μl h-1). n = 10 mice per group. (E) Static rod test between 130 and 160 days after infection in 22L-infected mice treated with Y-27632. n = 10 mice per group. (F) Left, Western-blot for proteinase K-resistant PrPSc in brain extracts from SHAM and 22L-infected mice infused or not with Y-27632. Right, post-mortem quantification of proteinase K-resistant PrPSc in brains of 22L-infected mice treated or not with Y-27632. n = 10 for each condition. (G) PDK1 activity in cerebellar extracts of 22L-infected mice treated or not with Y-27632 versus SHAM mice. n = 9 for each condition. (H) Immunoblot analysis of sucrose gradient fractions of cerebellar extracts of SHAM mice and 22L-infected mice infused or not with Y-27632 to assess TACE displacement from the plasma membrane (FAK-enriched fractions) to caveolin-1-enriched vesicles in vivo. (I) Western blot analysis (top) of the C1 fragment of PrP (C1) and full-length PrP (native) in cerebellar extracts from SHAM and 22L-infected mice infused or not with Y-27632 and the ratio (bottom) of C1/native full-length PrP. Note that mouse infection with 22L strain is associated with decreased PrP α-cleavage at the expense of PrP β-cleavage that generates C2 fragment [68, 69]. n = 5 for each condition. (J) ROCK immunoprecipitation followed by PDK1 western blotting in cerebellar extracts of 22L-infected mice treated or not with Y-27632 versus SHAM mice. n = 9 for each condition. Values are the mean ± s.e.m. * P < 0.01 versus SHAM mice. ** P < 0.01 versus 22L-infected mice. # P < 0.05 versus SHAM mice ## P < 0.05 versus 22L-infected mice.
Fig 7
Fig 7. Schematic representation of ROCK dysregulation in prion-infected cells and incidence of ROCK overactivity on neuritogenesis and PrPSc production.
Prion infection causes the overstimulation of ROCK. Overactivated ROCK alters neuronal polarity by disrupting the dynamics of F-actin cytoskeleton through the LIM kinases/cofilin signaling pathway. Overactivated ROCK also amplifies PrPSc production by acting on the PDK1/TACE signaling module. Prion infection increases the pool of PDK1 molecules interacting with ROCK and phosphorylated by ROCK, at the root of increased PDK1 activity. ROCK-induced PDK1 overactivation promotes the internalization of TACE α-secretase in caveolin-1-enriched vesicles, which cancels TACE neuroprotective α-cleavage of PrPC at the plasma membrane of prion-infected cells. The accumulation of PrPSc fuels the activation of ROCK, the formation of ROCK/PDK1 complex and the increase in PDK1 activity and thereby sustains a vicious circle that contributes to prion disease progression. The inhibition of ROCK with Y-27632 or dimethylfasudil (i) rescues F-actin plasticity necessary for neuritogenesis, synapse connectivity and the integrity of axon/dendrites, and (ii) disrupts the ROCK/PDK1 complex, which lowers PDK1 activity and allows TACE to target back to the plasma membrane. Relocated TACE upon ROCK inhibition recovers its cleavage activity towards PrPC and attenuates PrPC conversion into PrPSc. ROCK emerges as potential therapeutic target to combat prion diseases.

References

    1. Ferri A, Sanes JR, Coleman MP, Cunningham JM, Kato AC (2003) Inhibiting axon degeneration and synapse loss attenuates apoptosis and disease progression in a mouse model of motoneuron disease. Curr Biol 13: 669–673. - PubMed
    1. Gillingwater TH, Ingham CA, Coleman MP, Ribchester RR (2003) Ultrastructural correlates of synapse withdrawal at axotomized neuromuscular junctions in mutant and transgenic mice expressing the Wld gene. J Anat 203: 265–276. - PMC - PubMed
    1. Sievers C, Platt N, Perry VH, Coleman MP, Conforti L (2003) Neurites undergoing Wallerian degeneration show an apoptotic-like process with Annexin V positive staining and loss of mitochondrial membrane potential. Neurosci Res 46: 161–169. - PubMed
    1. Brose N, O'Connor V, Skehel P (2010) Synaptopathy: dysfunction of synaptic function? Biochem Soc Trans 38: 443–444. 10.1042/BST0380443 - DOI - PubMed
    1. Aguzzi A, Baumann F, Bremer J (2008) The prion's elusive reason for being. Annu Rev Neurosci 31: 439–477. 10.1146/annurev.neuro.31.060407.125620 - DOI - PubMed

Publication types

LinkOut - more resources