Deferoxamine Preconditioning of Neural-Like Cells Derived from Human Wharton's Jelly Mesenchymal Stem Cells as a Strategy to Promote Their Tolerance and Therapeutic Potential: An In Vitro Study
- PMID: 26242172
- PMCID: PMC11482441
- DOI: 10.1007/s10571-015-0249-8
Deferoxamine Preconditioning of Neural-Like Cells Derived from Human Wharton's Jelly Mesenchymal Stem Cells as a Strategy to Promote Their Tolerance and Therapeutic Potential: An In Vitro Study
Abstract
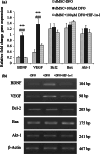
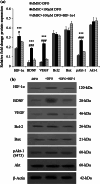
Transplantation of neural-like cells is considered as a promising therapeutic strategy developed for neurodegenerative disease in particular for ischemic stroke. Since cell survival is a major concern following cell implantation, a number of studies have underlined the protective effects of preconditioning with hypoxia or hypoxia mimetic pharmacological agents such as deferoxamine (DFO), induced by activation of hypoxia inducible factor-1 (HIF-1) and its target genes. The present study has investigated the effects of DFO preconditioning on some factors involved in cell survival, angiogenesis, and neurogenesis of neural-like cells derived from human Wharton's jelly mesenchymal stem cells (HWJ-MSCs) in presence of hydrogen peroxide (H2O2). HWJ-MSCs were differentiated toward neural-like cells for 14 days and neural cell markers were identified using immunocytochemistry. HWJ-MSC-derived neural-like cells were then treated with 100 µM DFO, as a known hypoxia mimetic agent for 48 h. mRNA and protein expression of HIF-1 target genes including brain-derived neurotrophic factors (BDNF) and vascular endothelial growth factor (VEGF) significantly increased using RT-PCR and Western blotting which were reversed by HIF-1α inhibitor, while, gene expression of Akt-1, Bcl-2, and Bax did not change significantly but pAkt-1 was up-regulated as compared to poor DFO group. However, addition of H2O2 to DFO-treated cells resulted in higher resistance to H2O2-induced cell death. Western blotting analysis also showed significant up-regulation of HIF-1α, BDNF, VEGF, and pAkt-1, and decrease of Bax/Bcl-2 ratio as compared to poor DFO. These results may suggest that DFO preconditioning of HWJ-MSC-derived neural-like cells improves their tolerance and therapeutic potential and might be considered as a valuable strategy to improve cell therapy.
Keywords: BDNF; Deferoxamine; Neural-like cells; Preconditioning; VEGF.
Figures


Similar articles
-
Preconditioning of Mesenchymal Stem Cells with Non-Toxic Concentration of Hydrogen Peroxide Against Oxidative Stress Induced Cell Death: The Role of Hypoxia-Inducible Factor-1.Adv Pharm Bull. 2019 Feb;9(1):76-83. doi: 10.15171/apb.2019.010. Epub 2019 Feb 21. Adv Pharm Bull. 2019. PMID: 31011561 Free PMC article.
-
Deferoxamine preconditioning potentiates mesenchymal stem cell homing in vitro and in streptozotocin-diabetic rats.Expert Opin Biol Ther. 2013 Jul;13(7):959-72. doi: 10.1517/14712598.2013.782390. Epub 2013 Mar 28. Expert Opin Biol Ther. 2013. PMID: 23536977
-
Preconditioning of canine adipose tissue-derived mesenchymal stem cells with deferoxamine potentiates anti-inflammatory effects by directing/reprogramming M2 macrophage polarization.Vet Immunol Immunopathol. 2020 Jan;219:109973. doi: 10.1016/j.vetimm.2019.109973. Epub 2019 Nov 10. Vet Immunol Immunopathol. 2020. PMID: 31765882
-
Enhanced Hepatogenic Differentiation of Human Wharton's Jelly-Derived Mesenchymal Stem Cells by Using Three-Step Protocol.Int J Mol Sci. 2019 Jun 20;20(12):3016. doi: 10.3390/ijms20123016. Int J Mol Sci. 2019. PMID: 31226809 Free PMC article.
-
Deferoxamine preconditioning activated hypoxia-inducible factor-1α and MyD88-dependent Toll-like receptor 4 signaling in intestinal stem cells.J Pediatr Surg. 2018 Nov;53(11):2349-2356. doi: 10.1016/j.jpedsurg.2018.01.023. Epub 2018 Feb 6. J Pediatr Surg. 2018. PMID: 29475626
Cited by
-
Outcomes of Deferoxamine Action on H2O2-Induced Growth Inhibition and Senescence Progression of Human Endometrial Stem Cells.Int J Mol Sci. 2021 Jun 3;22(11):6035. doi: 10.3390/ijms22116035. Int J Mol Sci. 2021. PMID: 34204881 Free PMC article.
-
L-mimosine and hypoxia can increase angiogenin production in dental pulp-derived cells.BMC Oral Health. 2017 May 25;17(1):87. doi: 10.1186/s12903-017-0373-6. BMC Oral Health. 2017. PMID: 28545523 Free PMC article.
-
In vitro and In vivo Studies on Mesenchymal Stem Cells for Ischemic Stroke Therapy: A Scoping Review of The Therapeutic Effect.Stem Cells Cloning. 2025 May 31;18:45-61. doi: 10.2147/SCCAA.S519338. eCollection 2025. Stem Cells Cloning. 2025. PMID: 40476222 Free PMC article. Review.
-
Pharmacologic preconditioning with berberine attenuating ischemia-induced apoptosis and promoting autophagy in neuron.Am J Transl Res. 2016 Feb 15;8(2):1197-207. eCollection 2016. Am J Transl Res. 2016. PMID: 27158406 Free PMC article.
-
Preconditioning of Mesenchymal Stem Cells with Non-Toxic Concentration of Hydrogen Peroxide Against Oxidative Stress Induced Cell Death: The Role of Hypoxia-Inducible Factor-1.Adv Pharm Bull. 2019 Feb;9(1):76-83. doi: 10.15171/apb.2019.010. Epub 2019 Feb 21. Adv Pharm Bull. 2019. PMID: 31011561 Free PMC article.
References
-
- Abdel-Salam OM (2011) Stem cell therapy for Alzheimer’s disease. CNS Neurol Disord 10(4):459–485 - PubMed
-
- Almeida RD, Manadas BJ, Melo CV, Gomes JR, Mendes CS, Grãos MM, Carvalho RF, Carvalho AP, Duarte CB (2005) Neuroprotection by BDNF against glutamate-induced apoptotic cell death is mediated by ERK and PI3-kinase pathways. Cell Death Differ 12(10):1329–1343 - PubMed
-
- Bliss T, Guzman R, Daadi M, Steinberg G (2007) Stem cells and stroke recovery: introduction cell transplantation therapy for stroke. Stroke 38:817–826 - PubMed
-
- Bradford M (1976) A rapid and sensitive method for the quantitation of microgram quantities of protein utilizing the principle of protein-dye binding. Anal Biochem 72:248–254 - PubMed
MeSH terms
Substances
LinkOut - more resources
Full Text Sources
Other Literature Sources
Research Materials
Miscellaneous

