. 2015 Aug 5:5:12678.
doi: 10.1038/srep12678.

Social Eavesdropping in Zebrafish: Tuning of Attention to Social Interactions

Affiliations

Social Eavesdropping in Zebrafish: Tuning of Attention to Social Interactions

Rodrigo Abril-de-Abreu et al. Sci Rep. .

Abstract

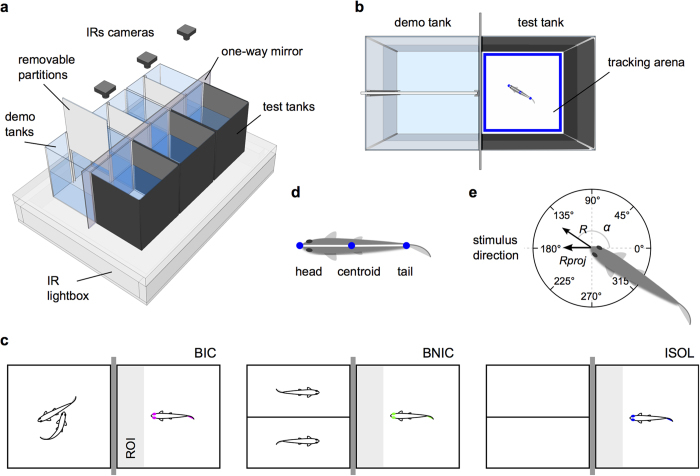
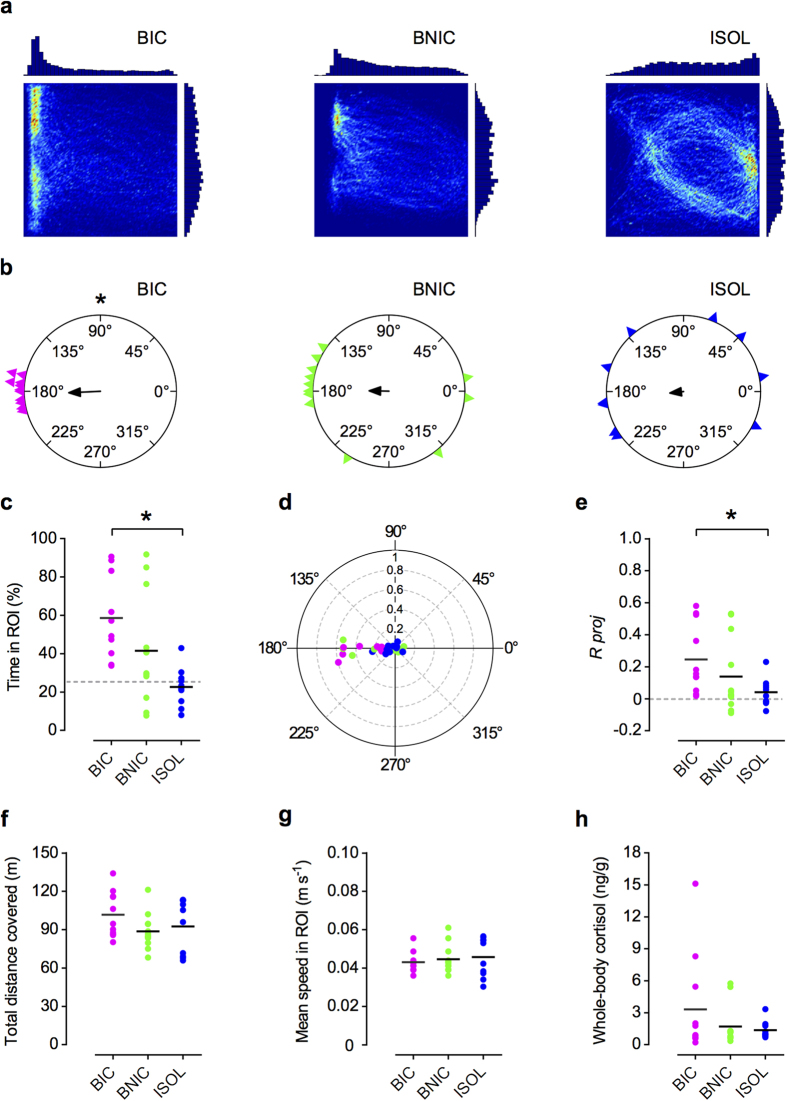
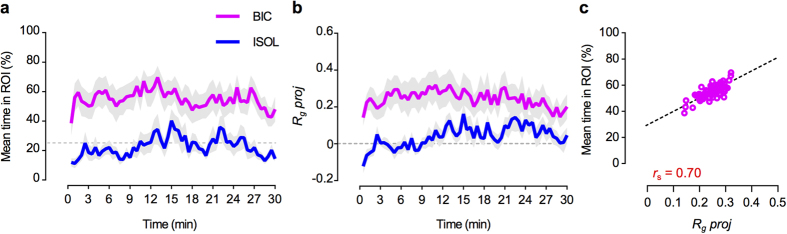
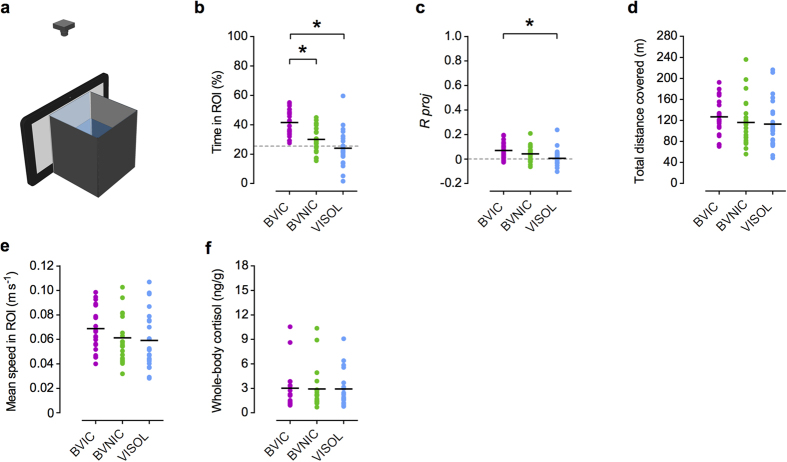
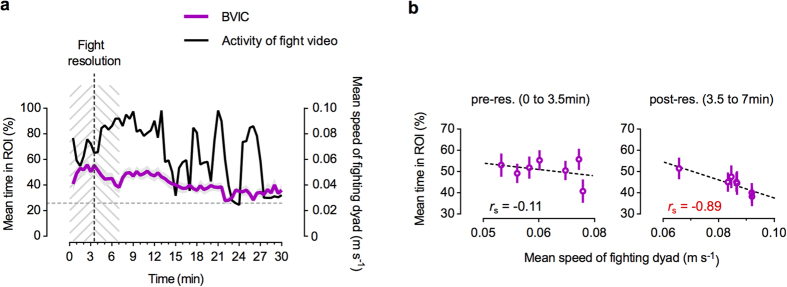
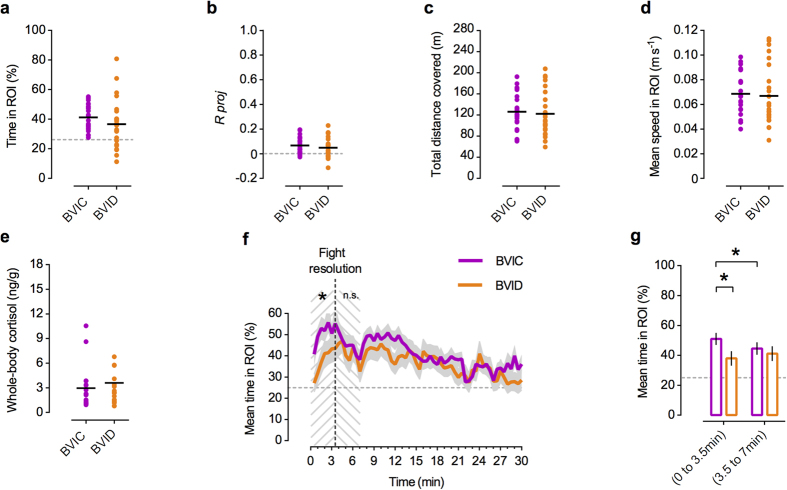
Group living animals may eavesdrop on signalling interactions between conspecifics in order to collect adaptively relevant information obtained from others, without incurring in the costs of first-hand information acquisition. This ability (aka social eavesdropping) is expected to impact Darwinian fitness, and hence predicts the evolution of cognitive processes that enable social animals to use public information available in the environment. These adaptive specializations in cognition may have evolved both at the level of learning and memory mechanisms, and at the level of input mechanisms, such as attention, which select the information that is available for learning. Here we used zebrafish to test if attention in a social species is tuned to the exchange of information between conspecifics. Our results show that zebrafish are more attentive towards interacting (i.e. fighting) than towards non-interacting pairs of conspecifics, with the exposure to fighting not increasing activity or stress levels. Moreover, using video playbacks to manipulate form features of the fighting fish, we show that during the assessment phase of the fight, bystanders' attention is more driven by form features of the interacting opponents; whereas during the post-resolution phase, it is driven by biological movement features of the dominant fish chasing the subordinate fish.


Figures

Figure 1
Figure 1. Behavioural paradigm.
(a) 3D diagram of the experimental setup. Fixed IRs cameras record all behavioural tests from above (see Methods). (b) Top view diagram of a demonstrator + test tank with focal fish. Each tracking arena (blue rectangle) is defined post-test for offline tracking of the recorded videos. (c) Schematic of the experimental treatments: bystander to fighting conspecifics (BIC); bystander to non-interacting conspecifics (BNIC); and socially isolated (ISOL). Focal fish represented with colour (BIC- magenta; BNIC- lime; ISOL- blue) and demonstrator fish (stimuli) represented in black. Region of interest (ROI) represented in light grey and one-way mirror in dark grey. (d) Schematic of the focal fish’s tracking points (blue dots) used for coordinates extraction. (e) Schematic of the focal fish’s possible mean orientations measured by its centroid-to-head axis angle α. 0° opposite and 180° directed towards the stimulus tank direction. R represents the mean resultant vector’s length and R proj its projection onto the stimulus direction.
Figure 2
Figure 2. Bystanders’ behavioural and hormonal results.
(a) 2D heatmaps and linear histograms of the time spent in each position of the tracking arena by a representative focal fish from each treatment: bystander to fighting conspecifics (BIC); bystander to non-interacting conspecifics (BNIC); and socially isolated (ISOL). The heatmaps are scaled from maximum relative value (red) to minimum relative value (dark blue). Linear histograms represented in arbitrary scale. (b) Circular plots of the focal fishes’ individual mean orientations for each treatment (BIC – magenta triangles, BNIC – lime triangles, ISOL – blue triangles) and the corresponding group mean resultant vector (black arrows). BIC fish deviate significantly from a uniform distribution, clustering around its group mean resultant vector. (c) Scatter plot (n = 10 to 12 / treatment) of the individual (coloured dots) and mean (black lines) percentage of time spent in the ROI for each treatment (BIC– magenta; BNIC– lime; ISOL– blue) during the 30 minutes test. Dashed grey line represents the value expected from a random distribution in the arena (25%). (d) Polar scatter plot of the focal fishes’ (coloured dots) individual mean resultant vector’s angles α (0˚ to 360˚) combined with corresponding vector lengths R (0 to 1), for each treatment. (e) Scatter plot of the individual (coloured dots) resultant vector’s lengths R projected (R proj) onto the stimulus direction (180˚) and corresponding group mean value Rg proj (black lines), for each treatment. Positive values indicate directional focus towards the stimulus; zero indicates no directionality (dashed grey line); negative values indicate directional focus opposite to the stimulus. (f,g,h) Scatter plots of the individual (coloured dots) and mean values (black lines) of the focal fishes’ total distance covered in the arena, mean speed in ROI and whole-body cortisol levels, for each treatment. * P < 0.05, ** P < 0.01, *** P < 0.001.
Figure 3
Figure 3. Bystanders’ temporal dynamics of proximity and directional focus towards fighting conspecifics.
(a) Comparison between the bystanders to fighting conspecifics’ (BIC) mean time in the ROI and the socially isolated (ISOL) reference fish, measured in 30 seconds bins, throughout the 30 minutes test. (b) Comparison between the BIC and ISOL fishes’ mean directional focus onto the stimulus direction (Rg proj), measured in 30 seconds bins, throughout the 30 minutes test. For both (a) and (b), the coloured thick lines (BIC- magenta; ISOL- blue) represent the mean values for each treatment. Grey shadows represent the standard error (SEM). The dashed grey line represents in (a) the value expected from a random distribution in the arena (25%); in (b) no directionality (Rg proj = 0). (c) Scatter plot of the BIC fishes’ mean time spent in the ROI as function of Rg proj. Open magenta circles represent the sampled (in 30 seconds bins) means. The Spearman correlation coefficient rs is shown in red. Dashed line indicates the regression line for easier visualization of trend.
Figure 4
Figure 4. Bystanders to video playbacks’ behavioural and hormonal results.
(a) Video playback setup: a tablet display replaces the demonstrator tank in the original experimental setup (see Methods). (b) Scatter plot (n = 23 / treatment) of the individual (coloured dots) and mean (black lines) percentage of time spent in the ROI for each treatment[bystander to video of fighting conspecifics (BVIC) - dark magenta; bystander to video of non-interacting conspecifics (BVNIC) - green; observing video of empty tank (VISOL) - light blue]. Dashed grey line represents the value expected from a random distribution in the arena (25%). (c) Scatter plot of the individual (coloured dots) resultant vectors’ lengths R projected (R proj) onto the stimulus direction (180˚) and corresponding group mean value Rg proj (black lines) for each treatment. Positive values indicate directional focus towards the stimulus; zero indicates no directionality (dashed grey line); negative values indicate directional focus opposite to the stimulus. (d,e,f) Scatter plots of the individual (coloured dots) and mean values (black lines) of the focal fishes’ total distance covered in the arena, mean speed in ROI and whole-body cortisol levels, for each treatment.
Figure 5
Figure 5. Video fight activity vs. bystanders’ proximity to the screen.
(a) Temporal dynamics of the mean speed of the fighting dyad (black curve) in the video and the BVIC fishes’ mean time spent in the ROI (dark magenta curve), measured in 30 seconds bins, throughout the 30 minutes test. Grey shadow represents the standard error (SEM); dashed grey horizontal line - value expected from a random distribution in the arena (25%); dashed black vertical line - video fight resolution time point (at 3.5 minutes); dashed grey areas - pre-resolution (0 to 3.5 min) and post-resolution (3.5 to 7 min) time intervals analysed. (b) Scatter plots of the BVIC fishes’ mean time spent in the ROI as function of the mean speed of the video’s fighting dyad (video activity), before (0 min to 3.5 min) and after (3.5 min to 7 min) the fight resolution point. Open circles and error bars represent the sampled (in 30 seconds bins) mean ± SEM points. The Spearman correlation coefficient rs is shown in red when significant (P < 0.05). Dashed lines indicate the regression line for easier visualization of trends.
Figure 6
Figure 6. Bystanders to fighting conspecifics versus bystanders to fighting dots.
(a–e) Scatter plots (n = 23 to 24 / treatment) of individual (coloured dots) and mean (black lines): time spent in the ROI; resultant vector’s length R projected (R proj) onto 180˚; total distance covered; mean speed in ROI; and whole-body cortisol levels (n = 18 to 19 / treatment), for the bystander to video of fighting conspecifics (BVIC - dark magenta) and bystander to video of fighting dots (BVID - orange) treatments. Grey dashed line represents in (a) the value expected from a random distribution in the arena (25%); and in (b) no directionality (R proj = 0). (f) Temporal dynamics’ comparison of the mean time spent in ROI, between BVIC (dark magenta) and BVID (orange) treatments. Grey shadows represent the standard error (SEM); dashed grey horizontal line – value expected from a random distribution in the arena (25%); dashed black vertical line - video fight resolution time point (at 3.5 minutes); dashed grey area – pre-resolution (0 to 3.5 min) and post-resolution (3.5 to 7 min) analysed time intervals. (g) Bars plot of mean ± SEM comparison between BVIC and BVID treatments, before and after the fight resolution event, in the previously defined time period (* P < 0.05).

Similar articles

Cited by

References

    1. Danchin E., Giraldeau L.-A., Valone T. J. & Wagner R. H. Public information: from nosy neighbors to cultural evolution. Science 305, 487–491 (2004). - PubMed
    1. Oliveira R. F., McGregor P. K. & Latruffe C. Know thine enemy: fighting fish gather information from observing conspecific interactions. Proc. R. Soc. B Biol. Sci. 265, 1045–1049 (1998).
    1. McGregor P. K. Signalling in Territorial Systems: A Context for Individual Identification, Ranging and Eavesdropping. Philos. Trans. R. Soc. B Biol. Sci. 340, 237–244 (1993).
    1. Peake T. M. in Anim. Commun. networks 13–37 (Cambridge University Press, Cambridge, 2005).
    1. Byrne R. W. & Whiten A. Machiavellian Intelligence: Social Expertise and the Evolution of Intellect in Monkeys, Apes, and Humans. Am. Sci. 77, 599 (1989).

Publication types

LinkOut - more resources