

Reflective oxygen saturation monitoring at hypothenar and its validation by human hypoxia experiment
- PMID: 26242309
- PMCID: PMC4523957
- DOI: 10.1186/s12938-015-0071-z
Reflective oxygen saturation monitoring at hypothenar and its validation by human hypoxia experiment
Abstract
Background: Pulse oxygen saturation (SpO2) is an important parameter for healthcare, and wearable sensors and systems for SpO2 monitoring have become increasingly popular. The aim of this paper is to develop a novel SpO2 monitoring system, which detects photoplethysmographic (PPG) signals at hypothenar with a reflection-mode sensor embedded into a glove.
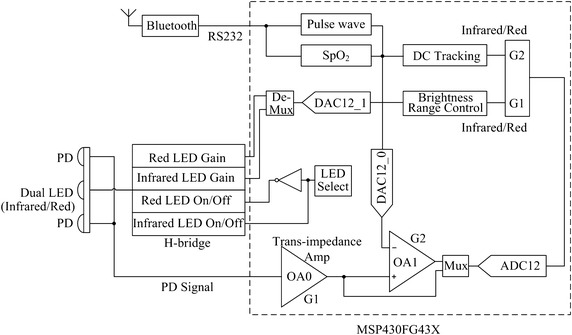
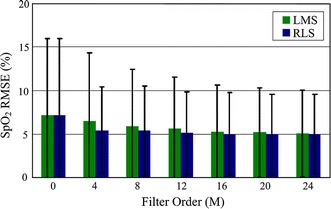
Methods: A special photo-detector section was designed with two photodiodes arranged symmetrically to the red and infrared light-emitting diodes (LED) to enhance the signal quality. The reflective sensor was placed in a soft silicon substrate sewn in a glove to fit the surface of the hypothenar. To lower the power consumption, the LED driving current was reduced and energy-efficient electronic components were applied. The performance for PPG signal detection and SpO2 monitoring was evaluated by human hypoxia experiments. Accelerometer-based adaptive noise cancellation (ANC) methods applying the least mean squares (LMS) and recursive least squares (RLS) algorithms were studied to suppress motion artifact.
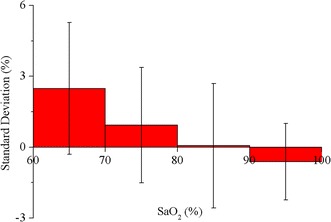
Results: A total of 20 subjects participated in the hypoxia experiment. The degree of comfort for wearing this system was accepted by them. The PPG signals were detected effectively at SpO2 levels from about 100-70%. The experiment validated the accuracy of the system was 2.34%, compared to the invasive measurements. Both the LMS and RLS algorithms improved the performance during motion. The total current consumed by the system was only 8 mA.
Conclusions: It is feasible to detect PPG signal and monitor SpO2 at the location of hypothenar. This novel system can achieve reliable SpO2 measurements at different SpO2 levels and on different individuals. The system is light-weighted, easy to wear and power-saving. It has the potential to be a solution for wearable monitoring, although more work should be conducted to improve the motion-resistant performance significantly.
Figures


Similar articles
-
A wrist worn SpO2 monitor with custom finger probe for motion artifact removal.Annu Int Conf IEEE Eng Med Biol Soc. 2016 Aug;2016:5777-5780. doi: 10.1109/EMBC.2016.7592040. Annu Int Conf IEEE Eng Med Biol Soc. 2016. PMID: 28269567
-
A comparative evaluation of adaptive noise cancellation algorithms for minimizing motion artifacts in a forehead-mounted wearable pulse oximeter.Annu Int Conf IEEE Eng Med Biol Soc. 2007;2007:1528-31. doi: 10.1109/IEMBS.2007.4352592. Annu Int Conf IEEE Eng Med Biol Soc. 2007. PMID: 18002258
-
Wearable Upper Arm SpO2 Sensor for Wellness Monitoring.IEEE Trans Biomed Eng. 2025 May;72(5):1766-1774. doi: 10.1109/TBME.2024.3521189. Epub 2025 Apr 22. IEEE Trans Biomed Eng. 2025. PMID: 40030686
-
Recent Progress in Flexible and Wearable All Organic Photoplethysmography Sensors for SpO2 Monitoring.Adv Sci (Weinh). 2023 Nov;10(31):e2302752. doi: 10.1002/advs.202302752. Epub 2023 Sep 23. Adv Sci (Weinh). 2023. PMID: 37740697 Free PMC article. Review.
-
Advanced Uses of Pulse Oximetry for Monitoring Mechanically Ventilated Patients.Anesth Analg. 2017 Jan;124(1):62-71. doi: 10.1213/ANE.0000000000001283. Anesth Analg. 2017. PMID: 27183375 Review.
Cited by
-
Reflection-Boosted Wearable Ring-Type Pulse Oximeters for SpO2 Measurement with High Sensitivity and Low Power Consumption.Biosensors (Basel). 2023 Jul 5;13(7):711. doi: 10.3390/bios13070711. Biosensors (Basel). 2023. PMID: 37504110 Free PMC article.
-
A comparative study of accuracy in major adaptive filters for motion artifact removal in sleep apnea tests.Med Biol Eng Comput. 2024 Mar;62(3):829-842. doi: 10.1007/s11517-023-02979-9. Epub 2023 Dec 5. Med Biol Eng Comput. 2024. PMID: 38052880 Free PMC article.
-
Home Respiratory Care: Design of a Prototype for Continuous Measurement at the Nasal Septum.Healthcare (Basel). 2022 Feb 8;10(2):318. doi: 10.3390/healthcare10020318. Healthcare (Basel). 2022. PMID: 35206932 Free PMC article.
-
Comparing peripheral limb and forehead vital sign monitoring in newborn infants at birth.Pediatr Res. 2024 Oct 17. doi: 10.1038/s41390-024-03651-0. Online ahead of print. Pediatr Res. 2024. PMID: 39420152
-
Modulation of thalamic network connectivity using transcranial direct current stimulation based on resting-state functional magnetic resonance imaging to improve hypoxia-induced cognitive impairments.Front Neurosci. 2022 Aug 25;16:955096. doi: 10.3389/fnins.2022.955096. eCollection 2022. Front Neurosci. 2022. PMID: 36090294 Free PMC article.
References
-
- Tamura T, Maeda Y, Sekine M, Yoshida M. Wearable photoplethysmographic sensors—past and present. Electronics. 2014;3(2):282–302. doi: 10.3390/electronics3020282. - DOI
Publication types
MeSH terms
Substances
LinkOut - more resources
Full Text Sources
Other Literature Sources
