. 2016 Mar;9(2):352-63.
doi: 10.1038/mi.2015.65. Epub 2015 Aug 5.

CD11c(+) monocyte/macrophages promote chronic Helicobacter hepaticus-induced intestinal inflammation through the production of IL-23

Affiliations

CD11c(+) monocyte/macrophages promote chronic Helicobacter hepaticus-induced intestinal inflammation through the production of IL-23

I C Arnold et al. Mucosal Immunol. 2016 Mar.

Abstract

In inflammatory bowel diseases, a breakdown in host microbial interactions accompanies sustained activation of immune cells in the gut. Functional studies suggest a key role for interleukin-23 (IL-23) in orchestrating intestinal inflammation. IL-23 can be produced by various mononuclear phagocytes (MNPs) following acute microbial stimulation, but little is known about the key cellular sources of IL-23 that drive chronic intestinal inflammation. Here we have addressed this question using a physiological model of bacteria-driven colitis. By combining conditional gene ablation and gene expression profiling, we found that IL-23 production by CD11c(+) MNPs was essential to trigger intestinal immunopathology and identified MHCII(+) monocytes and macrophages as the major source of IL-23. Expression of IL-23 by monocytes was acquired during their differentiation in the intestine and correlated with the expression of major histocompatibility complex class II (MHCII) and CD64. In contrast, Batf3-dependent CD103(+) CD11b(-) dendritic cells were dispensable for bacteria-induced colitis in this model. These studies reinforce the pathogenic role of monocytes in dysregulated responses to intestinal bacteria and identify production of IL-23 as a key component of this response. Further understanding of the functional sources of IL-23 in diverse forms of intestinal inflammation may lead to novel therapeutic strategies aimed at interrupting IL-23-driven immune pathology.


Figures

Figure 1
Figure 1
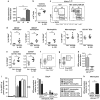
Helicobacter hepaticus (Hh)-driven inflammation alters the intestinal mononuclear phagocyte compartment. CX3CR1GFP/+ mice were infected with Hh and treated with anti-IL-10R monoclonal antibody (mAb), or with the respective single controls as indicated, and were compared with uninfected controls (Ctrl). Mice were analyzed after 2–3 weeks. (a) Colon histopathology scores. (b) Total number of colonic lamina propria cells per mouse. (c) Frequency of myeloid cell subsets among total colonic CD11b+ leukocytes. (d) Representative fluorescence-activated cell sorting (FACS) plots and (e) histograms of the indicated myeloid subsets: MHCII+ monocytes (CD11b+ CX3CR1int Ly6Chi, red subset), macrophages (CD11b+ CX3CR1hi Ly6Clo cells, green subset), CD11b+ DCs (CD11c+ CD103- CD11b+ CX3CR1int cells, gray subset), and CD103+ DCs (CD11c+ CD103+ CX3CR1- cells, orange subset). All cells were pregated on live CD45+ leukocytes, excluding neutrophils and eosinophils. Fluorescence minus one (FMO) controls for CD11b+ MHCII+ cells are shown. (f) Frequency of CD206+ cells among the indicated subsets determined by flow cytometry. Data points represent individual mice, bars indicate medians. All data are representative of at least two independent experiments. **P<0.01, ***P<0.001 as determined by one-way analysis of variance (ANOVA) with Bonferroni's post-test. DC, dendritic cell; IL-10, interleukin-10; LPL, lamina propria leukocyte.
Figure 2
Figure 2
Interleukin-23 (IL-23) from CD11c+ cells drives Helicobacter hepaticus (Hh)-induced colitis. CD11cIL-23+ and CD11cIL-23- mice were infected with Hh combined with anti-IL-10R monoclonal antibody (mAb) treatment and analyzed after 3 weeks. Uninfected mice served as control. (a) Representative micrographs of hematoxylin and eosin-stained sections (bar-200 μm) and histopathology scores of the colon and cecum. (b) Total number of lamina propria cells per mouse. (c) Spleen weight. (d) Hh colonization level quantified by quantitative PCR (qPCR). (e,f) Expression of cytokines assessed by (e) multiplex flow cytometric assay or (f) enzyme-linked immunosorbent assay (ELISA) on the supernatants of unstimulated lamina propria cells cultured for 48 h. Data points represent individual mice, bars indicate medians. Data are pooled from two independent experiments and are representative of four experiments. **P<0.01, ***P<0.001 as determined by (a–c) one-way analysis of variance (ANOVA) with Bonferroni's post-test or (df) Mann–Whitney U-test. IFNγ, interferon-γ TNFα, tumor necrosis factor-α.
Figure 3
Figure 3
MHCII+ monocytes and pathogenic T cells are reduced in Helicobacter hepaticus (Hh)-infected and anti-IL-10R-treated CD11cIL-23- mice. CD11cIL-23+ and CD11cIL-23- mice were infected with Hh combined with anti-IL-10R monoclonal antibody (mAb) treatment and analyzed after 3 weeks. (a) Representative fluorescence-activated cell sorting (FACS) plots, frequencies among CD45+ leukocytes, and absolute numbers of the indicated myeloid subsets in the colonic lamina propria. (b) Frequencies of CD4+ T cells among CD45+ leukocytes. (c) Representative FACS plots and frequencies of IFNγ+, IFNγ+ IL-17A+, and IL-17A+ cells among CD4+ T cells upon restimulation with phorbol 12-myristate 13-acetate (PMA) and ionomycin. Data points represent individual mice, bars indicate medians. Data are representative of two independent experiments. *P<0.05, **P<0.01 as determined by Mann–Whitney U-test. IFNγ, interferon-γ IL, interleukin; MHCII, major histocompatibility complex class II; TCR, T cell receptor.
Figure 4
Figure 4
MHCII+ monocytes and macrophages are the major producers of interleukin-23 (IL-23) during Helicobacter hepaticus (Hh)-induced colitis. CD11cIL-23+ mice (Cre-GFP+) were infected with Hh combined with anti-IL-10R monoclonal antibody (mAb) treatment and analyzed 4 days after infection alongside uninfected controls (Ctrl). (a) Quantitative PCR (qPCR) analysis of Il23a mRNA expression in colonic tissue collected from five individual mice at the indicated time points. (b) Total number of lamina propria cells per mouse at day 4. (c) Representative fluorescence-activated cell sorting (FACS) plots and (d,e) frequencies of the indicated myeloid subsets (as defined in Supplementary Figure S2) among colonic CD45+ leukocytes. (f,g) Representative FACS plots of CD11c-Cre-associated green fluorescent protein (GFP) expression vs. (f) CD11c and (g) MHCII. (h) qPCR analysis of Il23a mRNA expression by Cre-GFP+ and Cre-GFP- cells FACS-sorted from colonic leukocytes. (i) Frequency of CD11c-Cre-associated GFP expression among the indicated colonic myeloid subsets. Rectangle indicates Cre-positive subsets that were selected for further analysis in j. (j) qPCR analysis of Il23a mRNA expression by myeloid subsets FACS-sorted from CD11cIL-23+ and CD11cIL-23- mice. Statistics comparing cells from CD11cIL-23+ and CD11cIL-23- mice are shown. (k) qPCR analysis of Il23a mRNA expression by FACS-sorted MHCII- and MHCII+ monocytes. Data points represent individual mice, bars indicate medians. All bar charts of FACS-sorted cells represent the mean±s.e.m. of 10–15 pooled mice, sorted in two biological replicates. Data are representative of two independent experiments. *P<0.05, **P<0.01, ***P<0.001, as determined by (a, j) one-way analysis of variance (ANOVA) with Bonferroni's post-test or (b–h, k) Mann–Whitney U-test. DC, dendritic cell; MHCII, major histocompatibility complex class II.
Figure 5
Figure 5
Interleukin-23 (IL-23) production during colitis is restricted to CX3CR1-expressing CD64+ subsets. CX3CR1GFP/+ mice were infected with Helicobacter hepaticus (Hh) combined with anti-IL-10R monoclonal antibody (mAb) treatment and analyzed 2 weeks after infection alongside uninfected controls (Ctrl). Colonic lamina propria cells were sorted by flow cytometry and Il23a mRNA expression was analyzed by quantitative PCR (qPCR). (a) Il23a mRNA expression and representative fluorescence-activated cell sorting (FACS) plots of the following sorted populations: (1) MHCII+ monocytes (Mono), (2) Ly6Clo CX3CR1int macrophages/DCs, (3) CX3CR1hi macrophages, and (4) CD103+ DCs. (b) Il23a mRNA expression and representative FACS plots of the following sorted populations: (1) CX3CR1int MHCII+ CD64- and (2) CX3CR1int MHCII+ CD64+ cells. Bar charts represent the mean+s.e.m. of 10–15 pooled mice, sorted in two biological replicates. Data are representative of three independent experiments. **P<0.01, ***P<0.001, as determined by one-way analysis of variance (ANOVA) with Bonferroni's post-test. DC, dendritic cell; Macs, macrophages; MHCII, major histocompatibility complex class II; Mono, monocyte; NS, not significant.
Figure 6
Figure 6
Batf3-dependent dendritic cells (DCs) are dispensable for the production of interleukin-23 (IL-23) in Helicobacter hepaticus (Hh)-driven colitis. Wild-type (WT) and Batf3−/− mice were infected with Hh combined with anti-IL-10R monoclonal antibody (mAb) treatment and analyzed after 2 weeks alongside uninfected controls (Ctrl). (a) Representative fluorescence-activated cell sorting (FACS) plots and (b) frequencies and numbers of CD103+ CD11b- and CD103+ CD11b+ cells among CD45+ colonic leukocytes. (c) Total number of lamina propria cells per mouse. (d) Histopathology scores of the colon. Data points represent individual mice, bars indicate medians. *P<0.05 as determined by Mann–Whitney U-test, NS, not significant.
Figure 7
Figure 7
Macrophages share functional redundancy with MHCII+ monocytes for interleukin-23 (IL-23) production. CX3CR1GFP/+ mice were treated with a blocking anti-CSF-1R monoclonal antibody (mAb) or isotype (Iso) control and analyzed (ae) 4 days or (f, g) 2 weeks after Helicobacter hepaticus (Hh) and anti-IL-10R mAb treatment. (a) Representative fluorescence-activated cell sorting (FACS) plots and (b) frequencies among CD45+ leukocytes of the indicated myeloid subsets, as defined in Figure 1c. (c) Total number of colonic lamina propria cells per mouse. (d) Frequencies of neutrophils among CD45+ cells. (e) Quantitative PCR (qPCR) analysis of Il23a mRNA expression by total colonic lamina propria cells analyzed at day 4. (f) Total number of colonic lamina propria cells per mouse 2 weeks after Hh and anti-IL-10R mAb treatment. (g) Colonic histopathology scores. Data points represent individual mice, bars indicate medians. Data are pooled from two experiments and representative of three independent experiments. *P<0.05, **P<0.01, as determined by Mann–Whitney U-test. CSF, colony-stimulating factor; DC, dendritic cell; Macs, macrophages; MHCII, major histocompatibility complex class II; NS, not significant; Uninf, uninfected.

Similar articles

Cited by

References

    1. Kaser, A., Zeissig, S. & Blumberg, R.S. Inflammatory bowel disease. Annu. Rev. Immunol. 28, 573–621 (2010). - PMC - PubMed
    1. Geissmann, F., Manz, M.G., Jung, S., Sieweke, M.H., Merad, M. & Ley, K. Development of monocytes, macrophages, and dendritic cells. Science 327, 656–661 (2010). - PMC - PubMed
    1. Cerovic, V. et al. Intestinal CD103(-) dendritic cells migrate in lymph and prime effector T cells. Mucosal Immunol. 6, 104–113 (2013). - PubMed
    1. Persson, E.K. et al. IRF4 transcription-factor-dependent CD103(+)CD11b(+) dendritic cells drive mucosal T helper 17 cell differentiation. Immunity 38, 958–969 (2013). - PubMed
    1. Coombes, J.L. et al. A functionally specialized population of mucosal CD103+ DCs induces Foxp3+ regulatory T cells via a TGF-beta and retinoic acid-dependent mechanism. J. Exp. Med. 204, 1757–1764 (2007). - PMC - PubMed

Publication types

MeSH terms