. 2015 Sep 25;290(39):23616-30.
doi: 10.1074/jbc.M115.656595. Epub 2015 Aug 4.

Structural Insight into Specificity of Interactions between Nonconventional Three-finger Weak Toxin from Naja kaouthia (WTX) and Muscarinic Acetylcholine Receptors

Affiliations

Structural Insight into Specificity of Interactions between Nonconventional Three-finger Weak Toxin from Naja kaouthia (WTX) and Muscarinic Acetylcholine Receptors

Ekaterina N Lyukmanova et al. J Biol Chem. .

Abstract

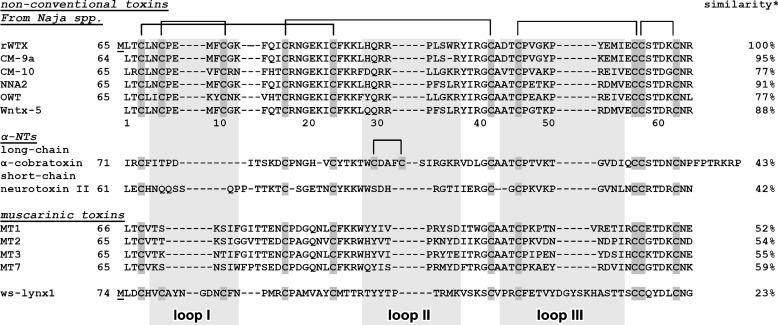
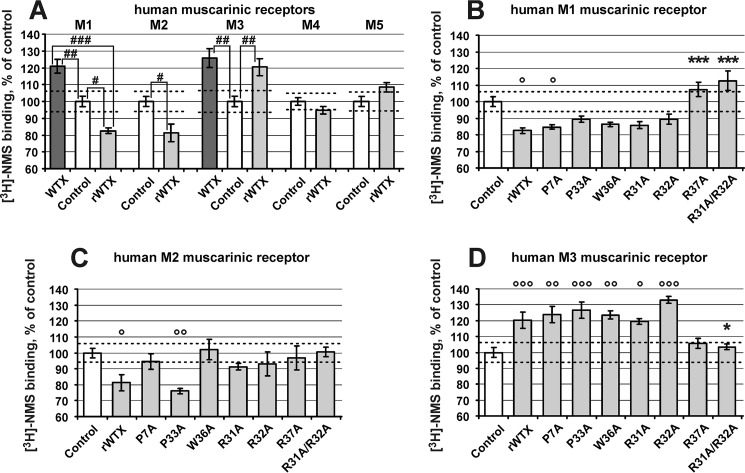
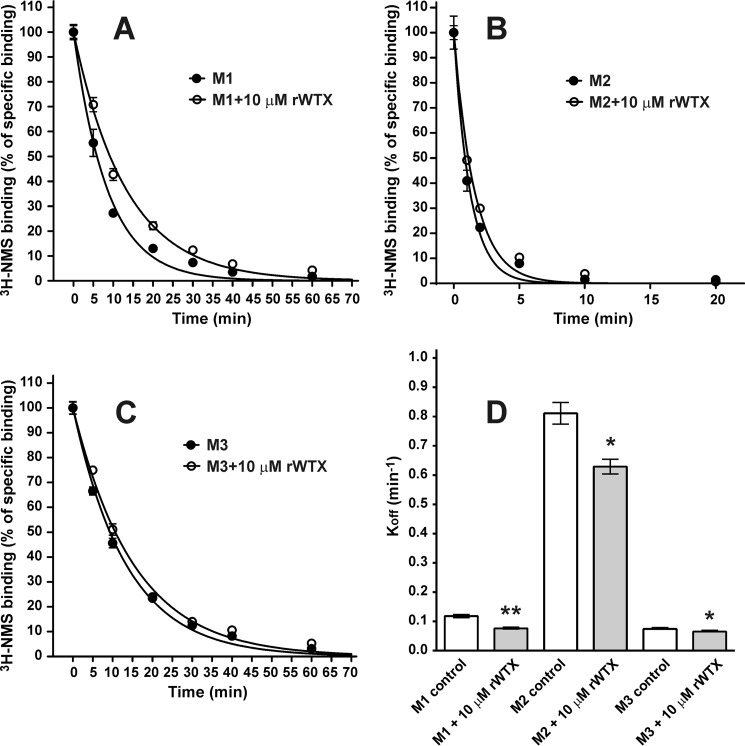
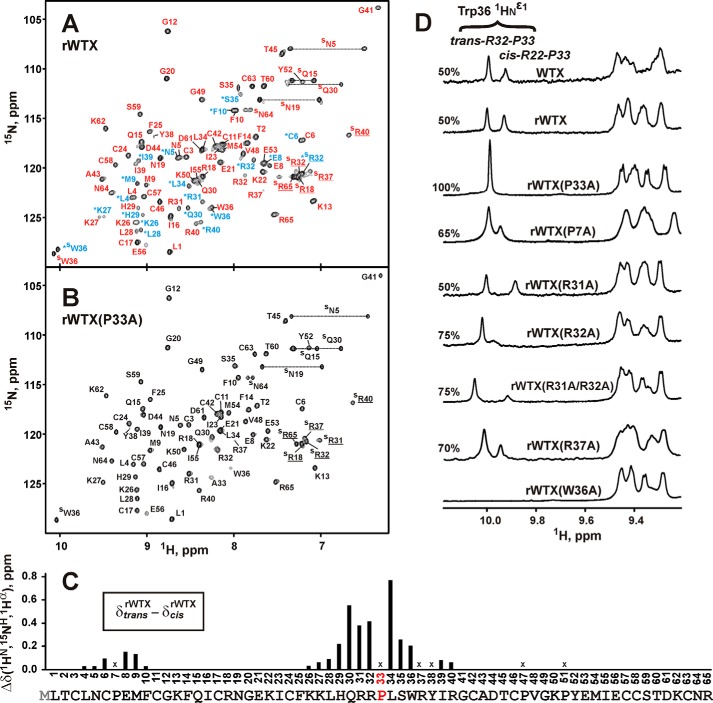
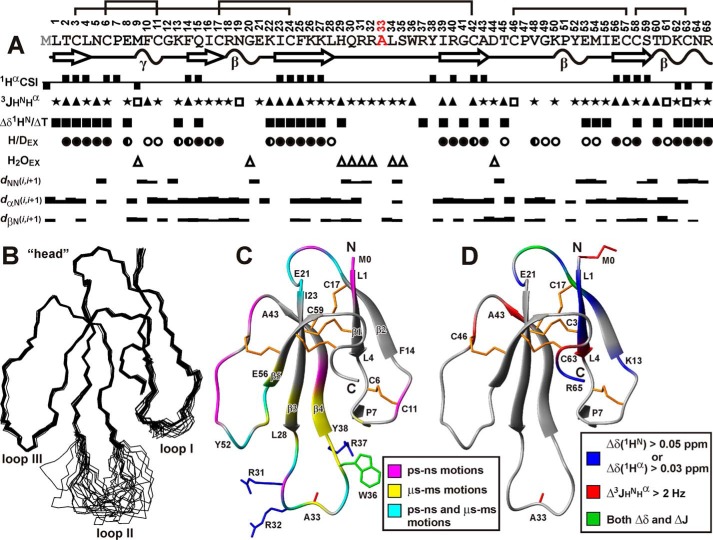
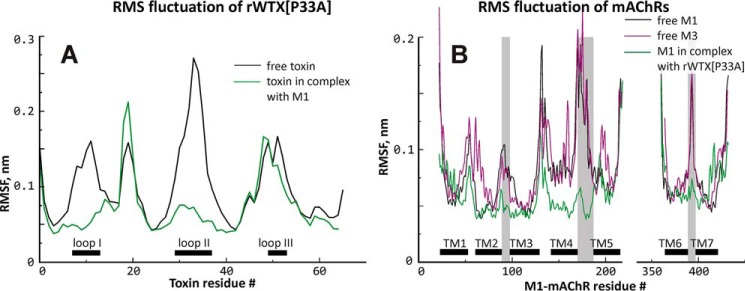
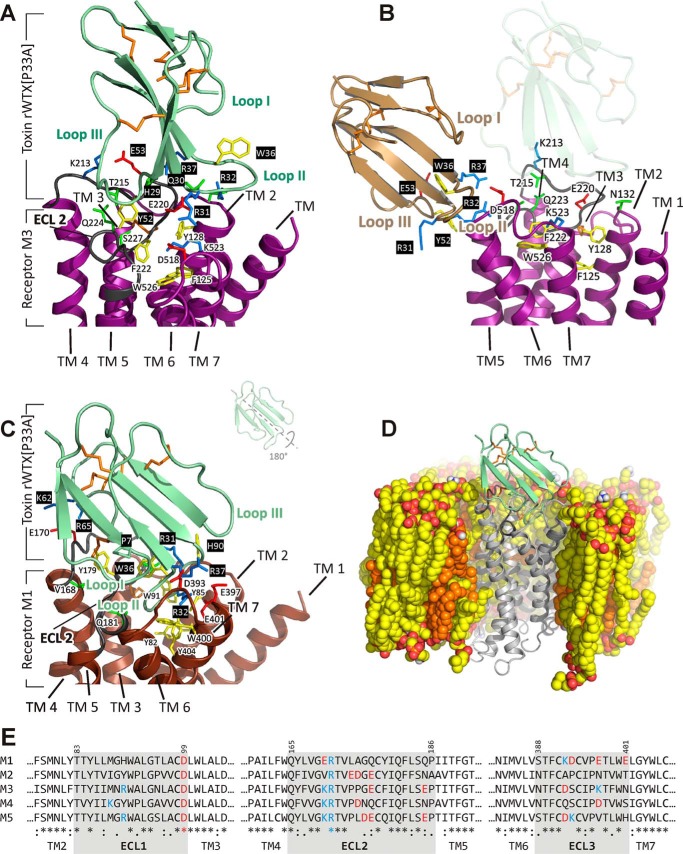
Weak toxin from Naja kaouthia (WTX) belongs to the group of nonconventional "three-finger" snake neurotoxins. It irreversibly inhibits nicotinic acetylcholine receptors and allosterically interacts with muscarinic acetylcholine receptors (mAChRs). Using site-directed mutagenesis, NMR spectroscopy, and computer modeling, we investigated the recombinant mutant WTX analogue (rWTX) which, compared with the native toxin, has an additional N-terminal methionine residue. In comparison with the wild-type toxin, rWTX demonstrated an altered pharmacological profile, decreased binding of orthosteric antagonist N-methylscopolamine to human M1- and M2-mAChRs, and increased antagonist binding to M3-mAChR. Positively charged arginine residues located in the flexible loop II were found to be crucial for rWTX interactions with all types of mAChR. Computer modeling suggested that the rWTX loop II protrudes to the M1-mAChR allosteric ligand-binding site blocking the entrance to the orthosteric site. In contrast, toxin interacts with M3-mAChR by loop II without penetration into the allosteric site. Data obtained provide new structural insight into the target-specific allosteric regulation of mAChRs by "three-finger" snake neurotoxins.

Keywords: G protein-coupled receptor (GPCR); computer modeling; nuclear magnetic resonance (NMR); protein dynamic; recombinant protein expression; site-directed mutagenesis; snake neurotoxin.


Figures

FIGURE 1.
FIGURE 1.
Alignment of amino acid sequences of rWTX, nonconventional toxins from Naja species, α-neurotoxins, muscarinic toxins, and water-soluble domain of human Lynx1 (ws-Lynx1). Cysteines are shown over a dark gray background. Position of the rWTX loops is shown by the light gray background. Additional N-terminal methionine residue in the rWTX sequence appearing due to translation of the starting atg codon (underlined) is shown. Sequence similarity between rWTX and other proteins was calculated by EMBOSS Stretcher (EMBL-EBI). Amino acid residue numbering is given for wild-type WTX.
FIGURE 2.
FIGURE 2.
Influence of rWTX and its mutants on [3H]NMS binding to mAChRs. Results are given as means ± S.E. of 3–7 values expressed in percent of control binding without toxin obtained in the same experiment. Dashed lines indicate 95% confidence interval of control binding that was in pmol/mg protein: M1, 1.81 ± 0.06, n = 12; M2, 0.28 ± 0.01, n = 9; M3, 1.46 ± 0.05, n = 9; M4, 0.49 ± 0.01, n = 9; M5, 0.32 ± 0.01, n = 9. A single concentration (10 μm) of the toxins was tested. A, comparison of effects of wild-type WTX and rWTX on [3H]NMS binding at mAChRs. No effects of wild-type WTX on [3H]NMS binding with M2, M4, and M5 receptors were previously reported (15). Data indicated as follows: #, p < 0.05; ##, p < 0.01, and ###, p < 0.001 are significantly different from each other. B–D, all mutants were compared with rWTX and control by analysis of variance followed by Dunnett's multiple comparisons test. Data indicated as * and ° (p < 0.05), ** and °° (p < 0.01), and *** and °°° (p < 0.001) are significantly different from rWTX and control, respectively.
FIGURE 3.
FIGURE 3.
Influence of rWTX on rate of orthosteric antagonist [3H]NMS dissociation at M1, M2, and M3 mAChRs. A–C, time course of dissociation of [3H]NMS in the presence and absence of 10 μm rWTX was determined as described under “Experimental Procedures.” Specific binding of [3H]NMS was calculated as a difference between total and nonspecific binding measured in the same experiment and is expressed in percent of initial binding (ordinate). Results are given as means ± S.E. (n = 3). D, 10 μm rWTX decreased [3H]NMS dissociation rate constants (Koff, min−1) from 0.118 ± 0.005 to 0.076 ± 0.003, from 0.81 ± 0.04 to 0.63 ± 0.03, and from 0.074 ± 0.002 to 0.065 ± 0.002 at the M1, M2, and M3 subtypes, respectively. Data designated as *, p < 0.05, and **, p < 0.01, are significantly different from control by two-tailed t test.
FIGURE 4.
FIGURE 4.
Conformational heterogeneity in rWTX molecule associated with the cis-trans-isomerization of the Arg-32–Pro-33 peptide bond. A and B, two-dimensional 1H,15N-HSQC spectra of 0.5 mm rWTX and rWTX(P33A) (pH 3.0, 40 °C). Signals of rWTX conformers with trans- and cis-configuration of Arg-32–Pro-33 peptide bond are marked by red and blue lettering, respectively. The signals of the cis form are also marked by asterisks. C, normalized difference of 1HN, 1Hα, and 15NH chemical shifts (√(Δδ1HN)2 + (Δδ1Hα)2 + (Δδ15NH/5)2) between “trans” and “cis” forms of rWTX. The data for proline residues and for Arg-37 and Tyr-38 (crosses) were not calculated. Signals of Arg-37 and Tyr-38 residues from the trans form of rWTX were not assigned. D, analysis of conformational heterogeneity in rWTX mutants. The fragments of one-dimensional 1H NMR spectra containing HNϵ1 signals of the Trp-36 side chain are shown. The relative content (%) of the trans form is shown above each spectrum.
FIGURE 5.
FIGURE 5.
Spatial structure and backbone dynamics of rWTX(P33A) in aqueous solution. A, overview of NMR data collected for rWTX(P33A). The positive and negative values of Hα chemical shift indices (CSIs) denote β-strand and α-helical propensity, respectively. The large (>8.5 Hz), small (<5 Hz), and medium (others) 3JHNHα coupling constants are designated by the filled triangles, open squares, and stars, respectively. The filled squares denote amide protons with temperature gradients (ΔδHNT) less than 4.5 ppb/K. The filled, half-open, and open circles denote HN protons with slow (half-exchange time >24 h), slow-intermediate (half-exchange time >1 h), and intermediate (half-exchange time >15 min) H-D exchange rates (H/DEX), respectively. Amide protons that demonstrate fast exchange with water protons (H2OEX) are shown by open triangles. The corresponding peaks were observed in a 20-ms CLEANEX-PM spectrum. The NOE connectivities are denoted as usual. The widths of the bars correspond to the relative intensity of the cross-peak in the 100-ms NOESY spectrum. Elements of secondary structure are shown on a separate line; the β-strands are designated by arrows and tight β/γ-turns by wavy lines. B, set of the best 20 rWTX(P33A) structures, superimposed over the backbone atoms in regions with well defined structure. The three loops and head of the toxin are labeled. C, ribbon representation of rWTX(P33A) spatial structure. The disulfide bonds are in orange. The side chains of mutated residues are shown. The ribbon of rWTX(P33A) is colored according to obtained dynamical NMR data (see supplemental Table). The residues affected by dynamic processes on the picosecond-nanosecond time scale (one with heteronuclear NOE <0.7 or S2 <0.8) or microsecond-millisecond time scale (having REX >2 Hz) are shown in magenta and yellow, respectively. The residues demonstrating mobility on both time scales are in cyan. D, qualitative data describing changes in the WTX conformation upon introduction of N-terminal Met residue (see Fig. 6, B and C) are mapped on the spatial structure of rWTX(P33A). The residues demonstrating large changes in backbone (1HN, 1Hα) chemical shifts or 3JHNHα coupling constants are shown in blue and red, respectively. The residues demonstrating both types of effects are in cyan. The side chains of Met-0 and Ala-33 are shown in red.
FIGURE 6.
FIGURE 6.
Qualitative comparison of backbone conformation and dynamics for wild-type WTX, rWTX, and rWTX(P33A). A, relative intensity of 15N-HSQC signals for trans and cis forms of rWTX and rWTX(P33A) mutant. For clarity, the intensities for two forms of rWTX are shown in joint columns. Residues with unassigned HN resonances and prolines are marked by crosses. B, difference of 1HN and 1Hα chemical shifts between wild-type WTX and rWTX (trans and cis forms) at pH ∼3.0 and 40 °C. The arbitrarily chosen threshold values (0.05 and 0.03 ppm for 1HN and 1Hα, respectively) are shown. C, comparison of 3JHNHα couplings measured for the trans form of native WTX and rWTX(P33A). The values with difference exceeding 2 Hz are connected by vertical lines. Uncertainties in the measured 3JHNHα values do not exceed 1 Hz. Chemical shifts and J-coupling constants for trans and cis forms of wild-type WTX were taken from Ref. .
FIGURE 7.
FIGURE 7.
Root-mean-square fluctuation (RMSF) of rWTX(P33A) (A) and mAChRs (B). Free and bound rWTX(P33A) and M1-mAChR are shown with black and green lines, respectively. Free M3-mAChR is shown with purple line. For rWTX(P33A) and mAChRs, location of loops I–III and TM α-helices, respectively, is shown. Intracellular loop 3 of the receptor located between TM helices 5 and 6 is absent from the model. Amino acid residue numbering is provided for rWTX(P33A) and M1 receptor.
FIGURE 8.
FIGURE 8.
Modeled complexes of rWTX(P33A) with M1- and M3-mAChRs. A, close-up view of rWTX(P33A) in complex with M3-mAchR (the structure from cluster 2 of solutions). Toxin molecule is shown in pale green, and the receptor is shown in purple. The M3-mAChR residues from ECL2 and ECL3 are shown. B, close-up view of rWTX(P33A) in complex with M3-mAChR (the structure from cluster 3 of solutions). Toxin molecule is shown in wheat, and the receptor is shown in purple. For comparison, the position of the toxin in cluster 2 of the solutions is shown by a shadow. C, close-up view of rWTX(P33A) (pale green) penetrating by the loop II into M1-mAChR (brown) TM helical bundle; ECL2 of the receptor (dark gray) leaves enough space for this interaction. The M1-mAChR residues that are critical for binding are shown. Negatively or positively charged, polar, and aromatic residues are in red, blue, green and yellow, respectively; toxin's residues are shown over a black background. Disulfide bonds are shown in orange. D, view of rWTX(P33A)·M1-mAChR complex in the POPC/POPE/cholesterol (2:1:1) bilayer after MD relaxation. Hydrophobic atoms of lipids and cholesterol are shown by yellow and orange, respectively. Oxygen and nitrogen atoms of phospholipids are shown by red and blue, respectively. The proximal parts of the membrane, water, and ions are removed for clarity. E, sequence comparison of ECLs in M1-M5 receptors.

References

    1. Tsetlin V. I., Hucho F. (2004) Snake and snail toxins acting on nicotinic acetylcholine receptors: fundamental aspects and medical applications. FEBS Lett. 557, 9–13 - PubMed
    1. Kini R. M., Doley R. (2010) Structure, function and evolution of three-finger toxins: mini proteins with multiple targets. Toxicon 56, 855–867 - PubMed
    1. Papke R. L. (2014) Merging old and new perspectives on nicotinic acetylcholine receptors. Biochem. Pharmacol. 89, 1–11 - PMC - PubMed
    1. Kruse A. C., Kobilka B. K., Gautam D., Sexton P. M., Christopoulos A., Wess J. (2014) Muscarinic acetylcholine receptors: novel opportunities for drug development. Nat. Rev. Drug Discov. 13, 549–560 - PMC - PubMed
    1. Wess J., Eglen R. M., Gautam D. (2007) Muscarinic acetylcholine receptors: mutant mice provide new insights for drug development. Nat. Rev. Drug Discov. 6, 721–733 - PubMed

Publication types

LinkOut - more resources