. 2015 Aug;27(8):2261-72.
doi: 10.1105/tpc.15.00433. Epub 2015 Aug 4.

Brassinosteroids Are Master Regulators of Gibberellin Biosynthesis in Arabidopsis

Affiliations

Brassinosteroids Are Master Regulators of Gibberellin Biosynthesis in Arabidopsis

Simon J Unterholzner et al. Plant Cell. 2015 Aug.

Abstract

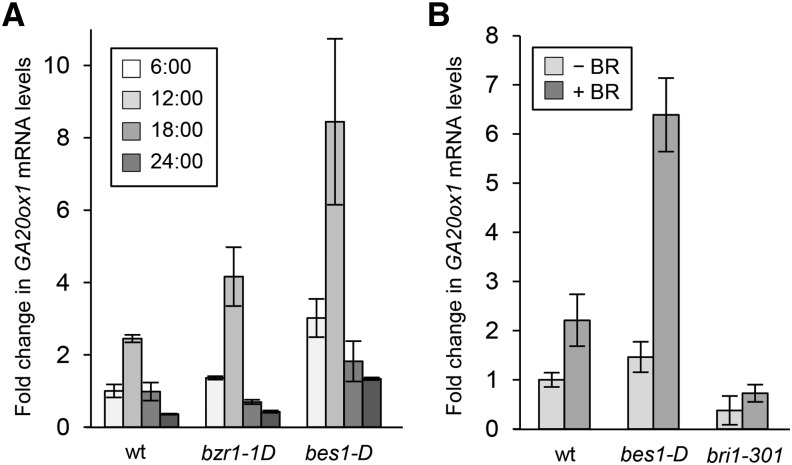
Plant growth and development are highly regulated processes that are coordinated by hormones including the brassinosteroids (BRs), a group of steroids with structural similarity to steroid hormones of mammals. Although it is well understood how BRs are produced and how their signals are transduced, BR targets, which directly confer the hormone's growth-promoting effects, have remained largely elusive. Here, we show that BRs regulate the biosynthesis of gibberellins (GAs), another class of growth-promoting hormones, in Arabidopsis thaliana. We reveal that Arabidopsis mutants deficient in BR signaling are severely impaired in the production of bioactive GA, which is correlated with defective GA biosynthetic gene expression. Expression of the key GA biosynthesis gene GA20ox1 in the BR signaling mutant bri1-301 rescues many of its developmental defects. We provide evidence that supports a model in which the BR-regulated transcription factor BES1 binds to a regulatory element in promoters of GA biosynthesis genes in a BR-induced manner to control their expression. In summary, our study underscores a role of BRs as master regulators of GA biosynthesis and shows that this function is of major relevance for the growth and development of vascular plants.


Figures

Figure 1.
Figure 1.
GA Application Rescues Growth Defects of BR Mutants. (A) to (D) Germination assays. At least 100 seeds per line were plated on water agar and germination, defined as radical emergence, was scored 6 d later. Results are given in percentages. Statistical significance was calculated with the χ2 test; the resulting P values are shown. (A) Germination of cpd, bri1-1, and bri1-301 seeds on water agar supplemented with 1 μM GA4 or DMSO as a control. (B) Germination of wild-type and bri1-301 seeds stratified for 0, 1, or 4 d. (C) Germination of wild-type and bri1-301 seeds on water-agar supplemented with 1 μM GA4 or half-strength MS salts. (D) Germination of wild-type and bri1-301 seeds on water-agar supplemented with half-strength MS salts or KNO3 (same amount as in half-strength MS). (E) Hypocotyl elongation of wild-type, cpd, and bri1-1 plants grown on half-strength MS medium supplemented with 1 μM GA4 or with DMSO as a control. Mean values and sd from 20 seedlings grown for 7 d in standard growth conditions are shown. (F) Hypocotyl elongation of wild-type, cpd, bri1-1, and bri1-301 plants grown on water agar supplemented with 1 μM GA4 or with DMSO as a control. Mean values and sd from 35 seedlings grown for 7 d in standard growth conditions are shown. (G) Flowering time of wild-type, bri1-1, and bri1-301 plants grown in soil in standard conditions. The plants were sprayed three times a week with 1, 10, or 100 μM GA4+7 or with water as a control. Flowering time was scored as total leaf number (TLN) at bolting; the mean of at least 20 treated plants and the sd are shown.
Figure 2.
Figure 2.
BRs Regulate GA Biosynthesis. (A) qPCR analysis of the expression of GA biosynthesis genes in 10-d-old seedlings of the indicated lines. The sd was calculated from three biological replicates. (B) Measurements of GAs in 21-d-old plants of the wild type and ASKθoe. The values are in ng/g dry weight. The mean and sd from three biological replicates are shown. (C) qPCR analysis of the expression of GA20ox1 in 8-d-old cpd plants grown on half-strength MS medium supplemented with the indicated amounts of epi-BL (in nM). Medium + DMSO was the 0 control. (D) qPCR analysis (performed as in [A]) of the expression of GA20ox1 in 10-d-old plants of bri1-1 and the wild type treated with GA4 for 2 h. Fold change compared with untreated wild type is shown.
Figure 3.
Figure 3.
GA20ox1 Expression in the BRI1 Domains Restores bri1-301 Growth Defects. (A) cMyc-tagged GA20ox1 was expressed under BRI1 promoter control in bri1-301 and four lines with different levels of GA20ox1-cMyc abundance were selected by immunoblotting. Staining with Coomassie blue (CBB) is shown as a loading control. (B) Hypocotyl length and primary root length of 8-d-old, light-grown seedlings of the wild type, bri1-301, and the four complementation lines. The mean and sd of at least 20 measured seedlings are shown. (C) Lateral roots per primary root of 8-d-old, light-grown seedlings of the wild type, bri1-301, and the four complementation lines. The mean and sd of at least 25 measured primary roots are shown. (D) Dry weight of 8-d-old seedlings of the indicated lines. The mean and sd of at least 18 seedlings are shown. (E) Flowering time, assessed as total leaf number (TLN) at bolting, of the wild type, bri1-301, and the complementation lines grown in soil under long-day growth conditions. The mean and sd of at least 17 plants are shown. (F) Adult phenotype of the complementation lines grown in long days. A representative plant of each line is shown.
Figure 4.
Figure 4.
GA20ox1 Induction by BRs is BRI1-Dependent and Promoted by bes1-D. qPCR analysis of the expression of GA20ox1 in the lines shown. Plants were grown for 8 d in long-day growth conditions. Samples were harvested at different times of day (A) or were grown on medium supplemented with 1 μM epi-BL (B). Fold changes compared with the wild type at 6:00 (A) or untreated (B) are shown. The sd was calculated from three biological repeats after normalization to GAPC2.
Figure 5.
Figure 5.
In Vitro Characterization of a BES1 Binding Motif. In EMSAs with recombinant BES1-GST, in vitro DNA binding to radiolabeled fragments of the GA20ox1 promoter was analyzed to map the BES1 binding site. (A) EMSA shows BES1-GST binding to overlapping 250-bp DNA fragments (P1-P3) upstream of the ATG. P1 (−188 to +102); P2 (−165 to −426); P3 (−393 to −692). (B) EMSA shows BES1-GST binding to overlapping 100-bp DNA fragments that mapped binding to region P3f. P3a (−165 to −264); P3b (−328 to −229); P3c (−393 to −294); P3d (−359 to −458); P3e (−424 to −523); P3f (−588 to −489); P3g (−554 to −653). (C) EMSA shows BES1-GST binding to the radiolabeled P3f fragment. The addition of 100× molar excess of competitor oligonucleotides (36 bp) of C1 (–588 to –553), C2 (–570 to –535), C3 (–552 to –517), C4 (–534 to –499), or C5 (−525 to −490) and mutated versions of C3 (C*1-C*5; sequences as shown; mutations marked in red) were used to characterize the BES1-GST binding site. Mutating 5′-AATCAAnnnCCT-3′ (in C3*1, C3*2, and C3*4) inhibits the competition for DNA binding, as shown in red in the table. (D) Illustration of the non-E-box BES1 binding site in the GA20ox1 promoter (bound fragments in red). (E) EMSA to investigate BES1 binding to probe P3f in the presence of 10× molar excess of competitor oligonucleotides in which the indicated base of the binding motif was mutated to all other possible bases. (F) EMSA to investigate BES1 binding to probe P3f in the presence of 10× molar excess of competitor oligonucleotides in which the CCT part of the motif was moved either 5′ (−) or 3′ (+) in the indicated base pair steps. (G) Illustration of the non-E-Box BES1 binding motif identified.
Figure 6.
Figure 6.
GO Enrichment of the Non-E-Box Motif in Arabidopsis. (A) Bubble chart depicting the enrichment of the non-E-Box motif within 750 bp upstream of the transcriptional start site in GO annotations of biological processes in Arabidopsis using Revigo software. The chart shows the −log10(P) value of the enrichment (x axis, size, and color) and the size of the GO term group (y axis) among all GO annotations. (B) Genes of Arabidopsis involved in GO GA biosynthetic process (GO:0009686) that contain the non-E-Box motif within 750 bp upstream of the transcriptional start site.
Figure 7.
Figure 7.
BES1 Binding to the Identified Motif in the Promoters of the GA Biosynthesis Genes GA20ox1, GA3ox1, and GA3ox4 in Vivo. (A) BES1-GST binding to a radiolabeled 100-bp DNA fragment of the GA20ox1 promoter (same probe as in Figure 5C) in the presence of 10×, 100×, or 1000× molar excess of different competitor oligos, which were 36-bp sequences of the GA20ox1, GA3ox1, or GA3ox4 promoters that contained the identified non E-box motif. A 36-bp sequence of the GA20ox2 promoter that contains an imperfect version of this motif (5′-AAACAAnnnCAT-3′) was used for verification. (B) qPCR analysis of the expression of GA3ox1 in 8-d-old cpd seedlings grown on half-strength MS medium supplemented with the indicated amounts of epi-BL (in nM). Medium supplemented with DMSO was the 0 control. The sd was calculated from three biological repeats after normalization to GAPC2. (C) qPCR analysis of the expression of GA3ox1 in the lines shown. Plants were grown for 8 d on half-strength MS medium supplemented with 1 μM epiBL or DMSO as a control. The sd was calculated from three biological repeats after normalization to GAPC2. (D) BL-induced enrichment of BES1-CFP on the promoters of GA20ox1, GA3ox1, and GA3ox4. For ChIP, 21-d-old BES1-CFP plants were sprayed with 10 μM epiBL (+ BR) or with DMSO as a control (− BR). Dephosphorylation of BES1-CFP following the treatment was verified by immunoblotting with an α-GFP antibody (left). Enrichment of BES1-CFP on fragments containing the non-E-box motif was determined by qPCR and calculating the ratio between samples without antibody and samples with antibody. Values are the mean from three biological replicates with the se as error bars (right).
Figure 8.
Figure 8.
Model for the Control of GA-Regulated Growth by BRs. 1. Upon activation of BR signaling, BES1 accumulates in its nonphosphorylated form and induces the expression of multiple genes encoding enzymes of the GA biosynthetic pathway by binding to a non-E-box motif. 2. As a consequence, GA production is increased, which promotes DELLA degradation and releases their repressive action on BES1 in the transcription of targets further downstream in signaling. Also in this stage, BR signaling is required to maintain BES1 in its nonphosphorylated, active form. 3. This results in the promotion of growth and development and is of relevance throughout the plant life cycle.

Comment in

Similar articles

Cited by

References

    1. Alboresi A., Gestin C., Leydecker M.T., Bedu M., Meyer C., Truong H.N. (2005). Nitrate, a signal relieving seed dormancy in Arabidopsis. Plant Cell Environ. 28: 500–512. - PubMed
    1. Bai M.Y., Shang J.X., Oh E., Fan M., Bai Y., Zentella R., Sun T.P., Wang Z.Y. (2012). Brassinosteroid, gibberellin and phytochrome impinge on a common transcription module in Arabidopsis. Nat. Cell Biol. 14: 810–817. - PMC - PubMed
    1. Bernardo-García S., de Lucas M., Martínez C., Espinosa-Ruiz A., Davière J.M., Prat S. (2014). BR-dependent phosphorylation modulates PIF4 transcriptional activity and shapes diurnal hypocotyl growth. Genes Dev. 28: 1681–1694. - PMC - PubMed
    1. Clouse S.D. (2011). Brassinosteroids. Arabidopsis Book 9: e0151. - PMC - PubMed
    1. Clouse S.D., Langford M., McMorris T.C. (1996). A brassinosteroid-insensitive mutant in Arabidopsis thaliana exhibits multiple defects in growth and development. Plant Physiol. 111: 671–678. - PMC - PubMed

Publication types

MeSH terms

LinkOut - more resources