. 2015 Oct;169(2):1214-24.
doi: 10.1104/pp.15.00570. Epub 2015 Aug 4.

SHORT VEGETATIVE PHASE Up-Regulates TEMPRANILLO2 Floral Repressor at Low Ambient Temperatures

Affiliations

SHORT VEGETATIVE PHASE Up-Regulates TEMPRANILLO2 Floral Repressor at Low Ambient Temperatures

Esther Marín-González et al. Plant Physiol. 2015 Oct.

Abstract

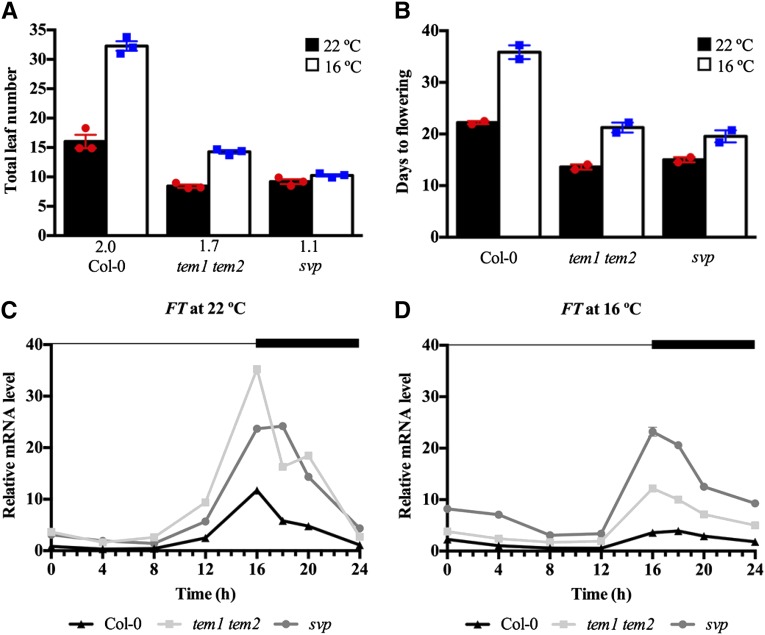
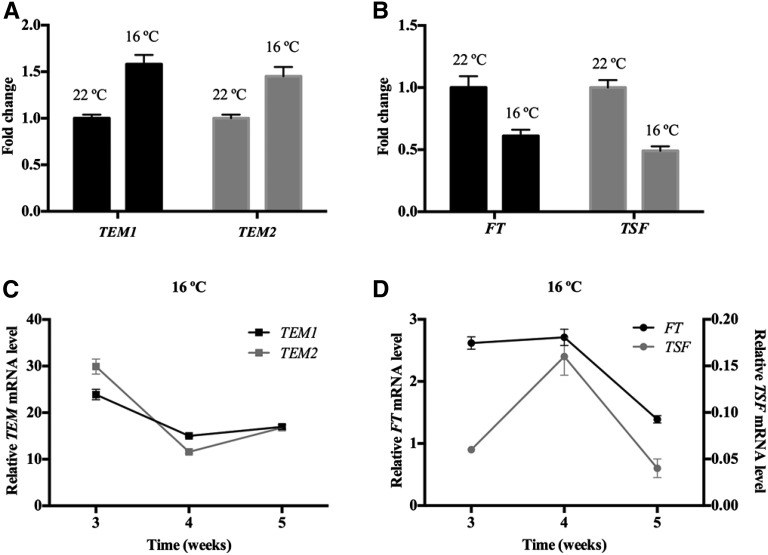
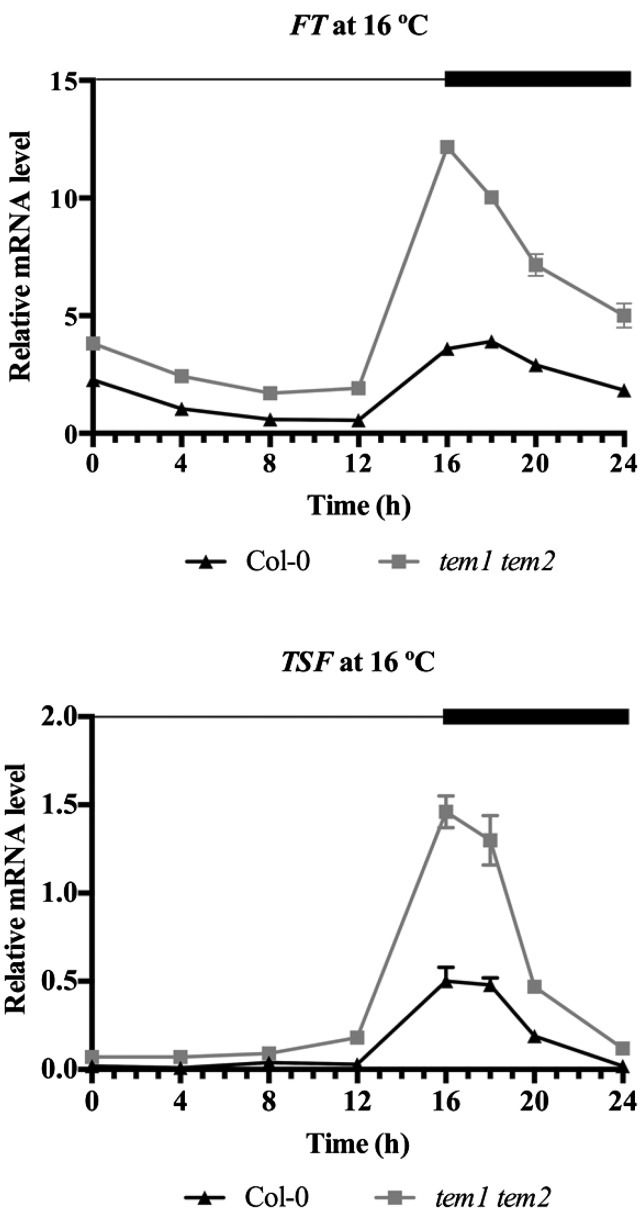
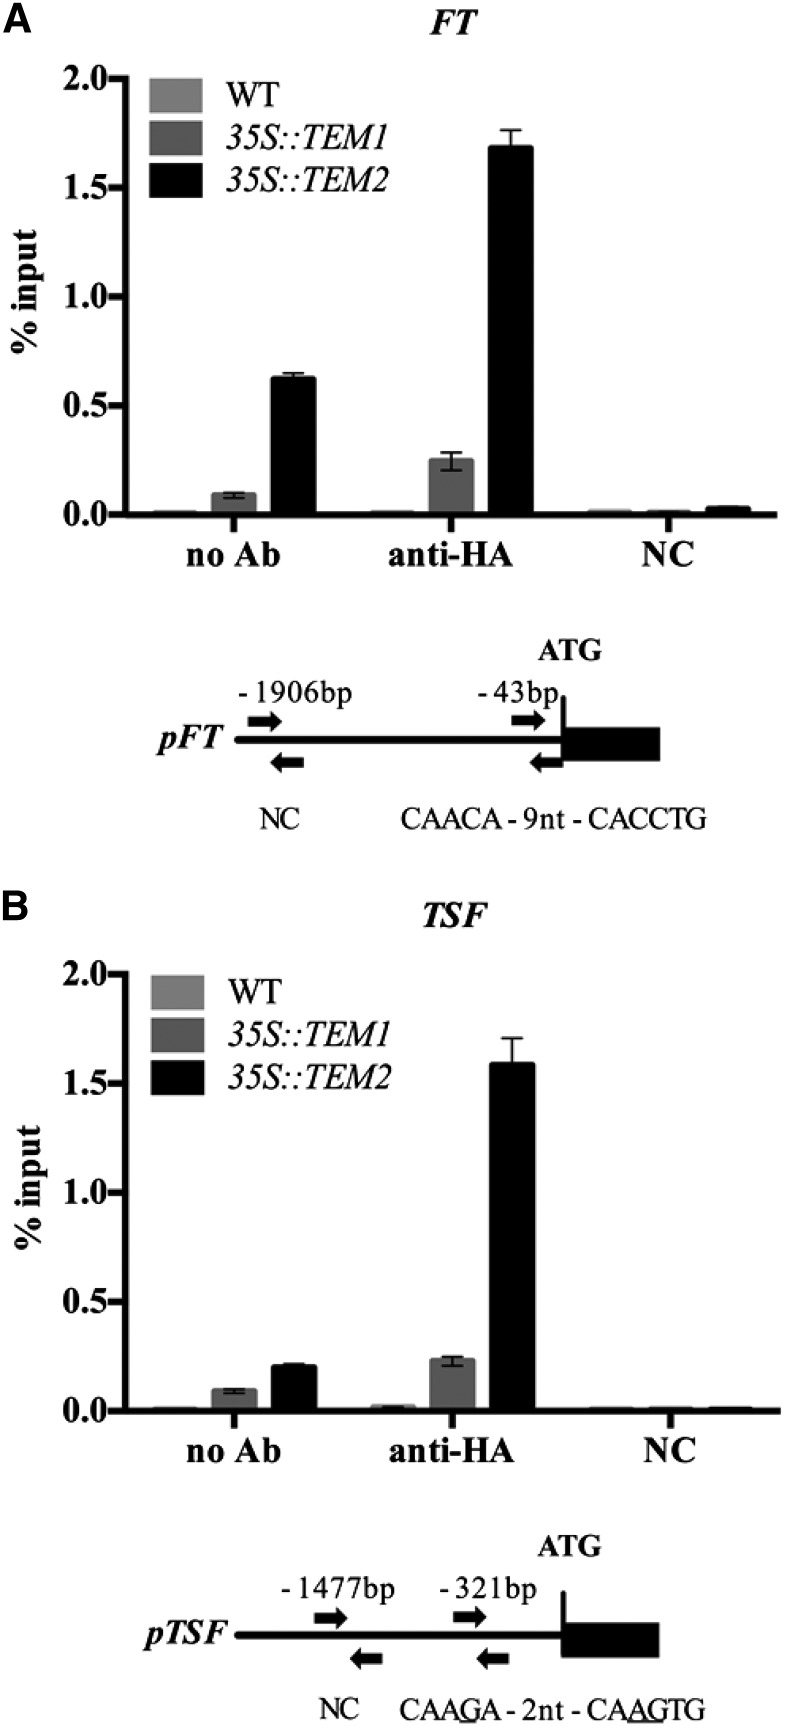
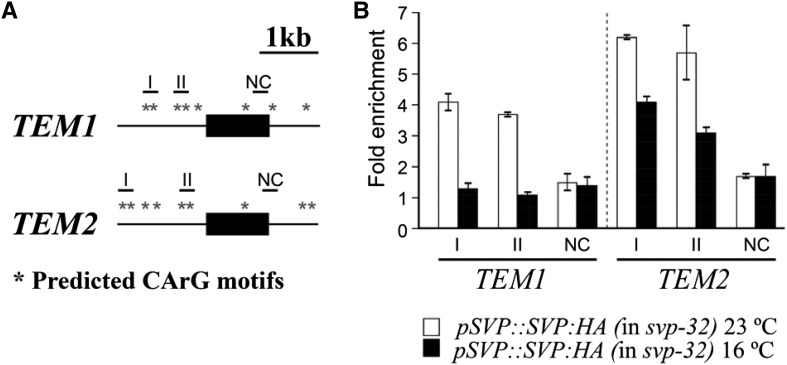
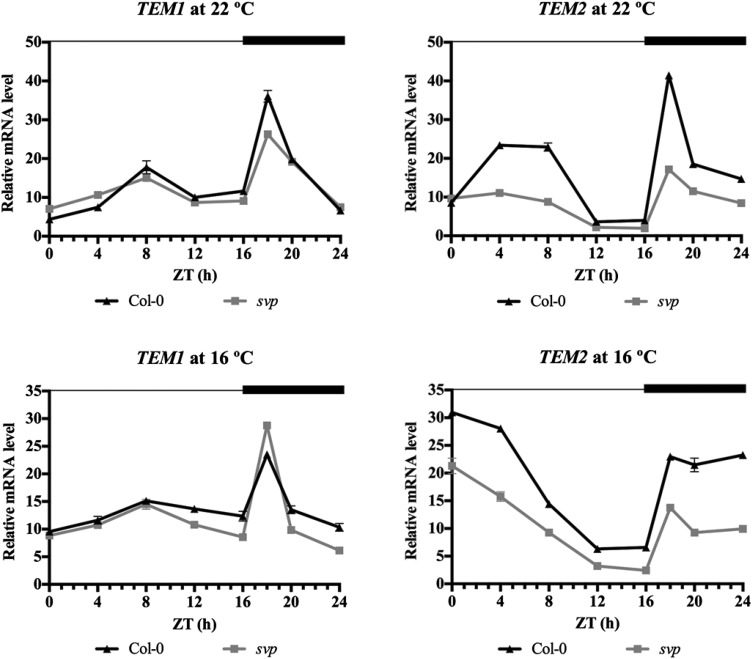
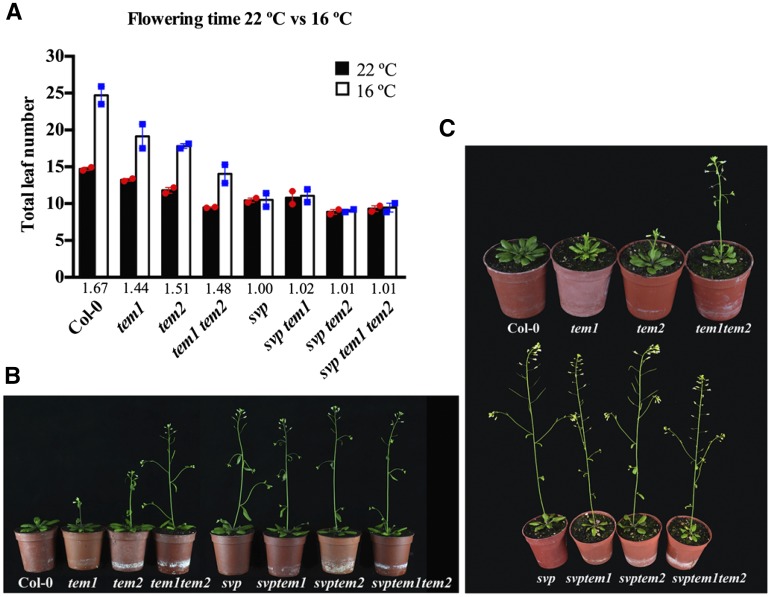
Plants integrate day length and ambient temperature to determine the optimal timing for developmental transitions. In Arabidopsis (Arabidopsis thaliana), the floral integrator FLOWERING LOCUS T (FT) and its closest homolog TWIN SISTER OF FT promote flowering in response to their activator CONSTANS under long-day inductive conditions. Low ambient temperature (16°C) delays flowering, even under inductive photoperiods, through repression of FT, revealing the importance of floral repressors acting at low temperatures. Previously, we have reported that the floral repressors TEMPRANILLO (TEM; TEM1 and TEM2) control flowering time through direct regulation of FT at 22°C. Here, we show that tem mutants are less sensitive than the wild type to changes in ambient growth temperature, indicating that TEM genes may play a role in floral repression at 16°C. Moreover, we have found that TEM2 directly represses the expression of FT and TWIN SISTER OF FT at 16°C. In addition, the floral repressor SHORT VEGETATIVE PHASE (SVP) directly regulates TEM2 but not TEM1 expression at 16°C. Flowering time analyses of svp tem mutants indicate that TEM may act in the same genetic pathway as SVP to repress flowering at 22°C but that SVP and TEM are partially independent at 16°C. Thus, TEM2 partially mediates the temperature-dependent function of SVP at low temperatures. Taken together, our results indicate that TEM genes are also able to repress flowering at low ambient temperatures under inductive long-day conditions.


Figures

Figure 1.
Figure 1.
tem1 tem2 mutant plants are early flowering at 16°C but still sensitive to changes in ambient growth temperature. Flowering time was measured as the number of total leaves produced at flowering (A) and the number of days to flowering (B) for wild-type (Col-0) plants and tem1 tem2 and svp mutants grown under LD conditions at 22°C (black) or 16°C (white). Data are reported as mean ± sem of three independent experiments (each dot plot represents an independent experiment; red circles indicate experiments performed at 22°C, and blue squares indicate experiments performed at 16°C). A minimum of 12 plants per genotype and experimental condition was analyzed in each independent experiment. The numbers below the bars denote the leaf number ratio (16°C/22°C). For more details, see Supplemental Table S1. C and D, Reverse transcription followed by quantitative real-time PCR (RT-qPCR) analysis of FT expression in wild-type (black triangles), tem1 tem2 (gray squares), and svp (gray circles) plants in 9-d-old seedlings grown under LD conditions at 22°C (C) or 16°C (D). Samples were collected over a 24-h period. The dark period is denoted by the black bar. Two independent experiments gave similar results (Supplemental Fig. S1), and one was chosen as representative. RNA levels were normalized to UBQ10. Error bars show sd of three technical replicates.
Figure 2.
Figure 2.
Opposite expression pattern of TEM and FT/TSF genes at 16°C. Expression analysis of TEM1, TEM2, FT, and TSF in 12-d-old wild-type (Col-0) plants grown at 22°C or 16°C (A and B) and wild-type plants grown at 16°C (C and D) for 5 weeks. Fold change in transcript levels at 16°C is depicted compared with 22°C. All samples were collected at ZT18. Three independent experiments gave similar results (Supplemental Fig. S5), and one was chosen as representative. Error bars show sd of three technical replicates. RNA levels were determined by RT-qPCR and normalized to UBQ10.
Figure 3.
Figure 3.
TEMs regulate FT and TSF levels at 16°C. Relative FT and TSF mRNA levels in tem1 tem2 mutant compared with wild-type (Col-0) plants. Nine-day-old seedlings were sampled at 4-h intervals, except from ZT16 to ZT20, when samples were collected every 2 h. Two independent experiments gave similar results (Supplemental Fig. S6), and one was chosen as representative. Error bars show sd of three technical replicates. RNA levels were determined by RT-qPCR and normalized to UBQ10.
Figure 4.
Figure 4.
Binding of TEM2 protein to the FT and TSF promoters at 16°C. ChIP assay of binding of TEM1-HA and TEM2-HA proteins to the RAV motifs in the FT (A) and TSF (B) promoters. Fragments containing the canonical RAV binding site for FT, a putative RAV binding site for TSF, and noncontaining RAV binding sequences (used as negative controls [NCs]) were analyzed by ChIP using 9-d-old 35S::TEM1 and 35S::TEM2 plants carrying an HA tag. Precipitated chromatin was used as a template in qPCR. Immunoprecipitated DNA enrichment is presented as a percentage of input DNA. Two (FT) or three (TSF) independent experiments gave similar results (Supplemental Fig. S7), and one was chosen as representative. Error bars show sd of three technical replicates. Schematic diagrams of the FT and TSF promoters are shown below graphs. Arrows indicate fragments amplified by qPCR after ChIP. WT, Wild type.
Figure 5.
Figure 5.
Binding of SVP protein to the TEM1 and TEM2 genomic loci. A, Schematic diagram of the TEM1 and TEM2 genomic regions. Black boxes and thin lines represent exons and introns, respectively. Asterisks indicate the predicted CArG and variant CArG motifs. Short horizontal lines indicate amplicons in ChIP-qPCR assays. Regions I and II, carrying CArG motifs, were selected to amplify; negative control (NC) was the amplicon used as a negative control. B, ChIP analysis of binding of SVP protein to the TEM1 and TEM2 genomic regions at 23°C and 16°C in 9-d-old pSVP::SVP:HA svp-32 plants. An anti-HA antibody was used for immunoprecipitation. Black bars denote the amplified fragments in qPCR: region I (−1,005 to −920; relative to ATG), region II (−350 to −271), and NC (+1,011 to +1,085) for TEM1 and region I (−1,429 to −1,385; relative to ATG), region II (−434 to −345), and NC (+1,005 to +1,065) for TEM2. Two independent experiments gave similar results (Supplemental Fig. S9), and one was chosen as representative. Error bars show sd of three technical replicates.
Figure 6.
Figure 6.
SVP positively regulates TEM2 expression at 22°C and 16°C. Relative mRNA levels of TEM1 and TEM2 at 22°C (upper) and 16°C (lower) in svp mutant compared with wild-type (Col-0) plants. Nine-day-old seedlings were sampled at 4-h intervals, except from ZT16 to ZT20, when samples were collected every 2 h. Two independent experiments gave similar results (Supplemental Fig. S10), and one was chosen as representative. Error bars show sd of three technical replicates. RNA levels were determined by RT-qPCR and normalized to UBQ10.
Figure 7.
Figure 7.
Genetic interaction between tem and svp mutants. A, Flowering time measured as the number of total leaves produced at flowering for the wild type (Col-0), tem mutants, and svp tem double and triple mutants grown under LD conditions at 22°C or 16°C. Data are reported as mean ± sem of two independent experiments (each dot plot represents an independent experiment; red circles indicate experiments performed at 22°C, and blue squares indicate experiments performed at 16°C). A minimum of 10 plants per genotype and experimental condition was analyzed in each independent experiment. The numbers below the bars denote the leaf number ratio (16°C/22°C). For more details, see Supplemental Table S2. B and C, Photographs of plants used in flowering time analysis grown for 24 d at 22°C (B) and 32 d at 16°C (C).

References

    1. Andrés F, Coupland G (2012) The genetic basis of flowering responses to seasonal cues. Nat Rev Genet 13: 627–639 - PubMed
    1. Balasubramanian S, Sureshkumar S, Lempe J, Weigel D (2006) Potent induction of Arabidopsis thaliana flowering by elevated growth temperature. PLoS Genet 2: e106. - PMC - PubMed
    1. Bergonzi S, Albani MC (2011) Reproductive competence from an annual and a perennial perspective. J Exp Bot 62: 4415–4422 - PubMed
    1. Blázquez MA, Ahn JH, Weigel D (2003) A thermosensory pathway controlling flowering time in Arabidopsis thaliana. Nat Genet 33: 168–171 - PubMed
    1. Capovilla G, Schmid M, Posé D (2015) Control of flowering by ambient temperature. J Exp Bot 66: 59–69 - PubMed

Publication types

MeSH terms

LinkOut - more resources