. 2015 Sep 29;6(29):27613-27.
doi: 10.18632/oncotarget.4546.

Genetic determinants of FOXM1 overexpression in epithelial ovarian cancer and functional contribution to cell cycle progression

Affiliations

Genetic determinants of FOXM1 overexpression in epithelial ovarian cancer and functional contribution to cell cycle progression

Carter J Barger et al. Oncotarget. .

Abstract

The FOXM1 transcription factor network is frequently activated in high-grade serous ovarian cancer (HGSOC), the most common and lethal subtype of epithelial ovarian cancer (EOC). We used primary human EOC tissues, HGSOC cell lines, mouse and human ovarian surface epithelial (OSE) cells, and a murine transgenic ovarian cancer model to investigate genetic determinants of FOXM1 overexpression in EOC, and to begin to define its functional contribution to disease pathology. The Cancer Genome Atlas (TCGA) data indicated that the FOXM1 locus is amplified in ~12% of HGSOC, greater than any other tumor type examined, and that FOXM1 amplification correlates with increased expression and poor survival. In an independent set of primary EOC tissues, FOXM1 expression correlated with advanced stage and grade. Of the three known FOXM1 isoforms, FOXM1c showed highest expression in EOC. In murine OSE cells, combined knockout of Rb1 and Trp53 synergistically induced FOXM1. Consistently, human OSE cells immortalized with SV40 Large T antigen (IOSE-SV) had significantly higher FOXM1 expression than OSE immortalized with hTERT (IOSE-T). FOXM1 was overexpressed in murine ovarian tumors driven by combined Rb1/Trp53 disruption. FOXM1 induction in IOSE-SV cells was partially dependent on E2F1, and FOXM1 expression correlated with E2F1 expression in human EOC tissues. Finally, FOXM1 functionally contributed to cell cycle progression and relevant target gene expression in human OSE and HGSOC cell models. In summary, gene amplification, p53 and Rb disruption, and E2F1 activation drive FOXM1 expression in EOC, and FOXM1 promotes cell cycle progression in EOC cell models.

Keywords: E2F1; FOXM1; Rb; epithelial ovarian cancer; p53.


Conflict of interest statement

CONFLICTS OF INTEREST

The authors declare there are no conflicts of interest.

Figures

Figure 1
Figure 1. FOXM1 copy number alterations (CNA) in HGSOC
A. FOXM1 amplification frequency in TCGA datasets. Arrow indicates HGSOC. B. FOXM1 CNA in HGSOC TCGA datasets as determined by GISTIC. C. FOXM1 expression (RNA Seq V2 RSEM, log2) compared to FOXM1 copy number in HGSOC TCGA datasets. The p value for ANOVA with post-test for linear trend is shown. Lines represent group medians. D. Overall survival as a function of FOXM1 amplification in HGSOC TCGA datasets. The p value for Logrank test is shown.
Figure 2
Figure 2. FOXM1 expression in EOC
A. FOXM1 expression measured with RT-qPCR (log10) in EOC histological subtypes as compared to normal ovary (NO). FOXM1 expression was normalized to 18s rRNA. B. FOXM1 expression in NO and in EOC as a function of disease stage. C. FOXM1 expression in NO and in EOC as a function of pathological grade. Lines represent group medians. Mann-Whitney test p values are shown. D. FOXM1 Western blot analysis in NO and EOC. Ponceau S staining is shown as a loading control. E. FOXM1 isoform specific RT-qPCR (log10) measured in HGSOC tissues. Lines represent group medians. The Mann-Whitney test p value is shown. p value designation: **** < 0.0001, *** < 0.001, ** < 0.01, * < 0.05.
Figure 3
Figure 3. FOXM1 expression in HGSOC cell lines
A. Relevant genetic alterations in HGSOC cell lines. Data were retrieved from CCLE and copy number alterations were visualized with IGV as described in Methods. B. Pan-FOXM1 mRNA expression in HGSOC cell lines and hOSE cells (control) was measured by RT-qPCR. C. Isoform specific FOXM1 mRNA expression in HGSOC cell lines was measured by RT-qPCR (log10). For B–C, bars represent mean ± SD.
Figure 4
Figure 4. FOXM1 expression in murine and human OSE cells following Rb and/or p53 abrogation
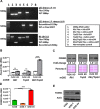
A. PCR genotyping of mOSE cells following infection with recombinant adenovirus expressing enhanced GFP (Ad-eGFP, control) or Cre recombinase + eGFP (AdCre-eGFP). B–C. FOXM1 expression in Rb and/or p53 floxed (control) and knockout (post-Cre infection) mOSE cells. B. Foxm1 RT-qPCR with respective fold-change relative to the floxed control. Data represents mean ± SD. Students t-test p value is shown. C. FOXM1 Western blot with respective fold change relative to the floxed control, performed with nuclear lysates. Ponceau S staining is shown as a loading control. D–E. FOXM1 expression in primary and immortalized human OSE cells (hOSE, IOSE-T, IOSE-SV). Cell line descriptions are provided in the Methods. D. FOXM1 RT-qPCR. Data represent mean ± SD. E. FOXM1 Western blot. β-actin is shown as a loading control. Students t-test p values: **** < 0.0001, *** < 0.001, ** < 0.01, * < 0.05.
Figure 5
Figure 5. FOXM1 expression in Rb1/Trp53 knockout-driven murine ovarian cancer
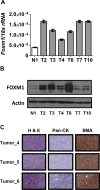
A–B. FOXM1 expression in Rb1/Trp53 knockout murine ovarian tumor tissues (T) and murine normal ovary control tissue (N) The mouse model is described in Methods. A. Foxm1 RT-qPCR. Data represents means ± SD. B. FOXM1 Western blot. β-actin is shown as a loading control. C. Ovarian tumor histology in Rb/p53 knockout mice. Paraffin sections of the tumors were stained with H&E or specific antibodies to pan-cytokeratin (Pan-CK) or smooth muscle actin (SMA). Images were captured using 20X magnification. Antigen detection is indicated by the presence of a brownish-red stain.
Figure 6
Figure 6. E2F1 and FOXM1 expression in IOSE-SV cells, HGSOC cells, and primary tumors
A–B. siRNA knockdown of E2F1 (10 nM) in IOSE-SV and COV362 cells for 72 hours. A. E2F1 Western blot. β-actin is shown as a loading control. B. FOXM1 RT-qPCR, normalized to 18s rRNA. Data represent mean ± SD. Student's t-test p value is shown. C–D. E2F1 and FOXM1 expression correlation in human EOC. C. Correlation in 263 HGSOC tissues from TCGA datasets (gene expression determined by RNA seq V2, log2). D. Correlation in an independent set of 40 EOC tissues (gene expression determined by Affymetrix HG 1.0ST microarray, log2).
Figure 7
Figure 7. Impact of FOXM1 knockdown on cell cycle progression and target gene expression in IOSE-SV and COV362 cells
Transient siRNA-mediated knockdown of FOXM1 (20 nM) was completed for 72 hours. A. Validation of FOXM1 protein knockdown in IOSE-SV cells. FOXM1 protein expression was determined by Western blot, and β-actin is shown as a loading control. B. Cell cycle analysis of IOSE-SV cells following FOXM1 or control siRNA treatment. C. FOXM1 target gene expression determined by RT-qPCR in IOSE-SV cells, following FOXM1 or control siRNA treatment. Expression data are shown for SKP2, PLK1, and CCNB1, each normalized to 18s rRNA. D–F. Same as A-C, except the experiment was performed using COV362 cells. Bars represent mean ± SD. Student's t test p values are shown. P value designation: **** < 0.0001, *** < 0.001, ** < 0.01, * < 0.05.
Figure 8
Figure 8. Impact of FOXM1 overexpression on cell cycle progression and target gene expression in hOSE cells
A–B. Dox-inducible FOXM1b and FOXM1c overexpression in primary hOSE cells after 72 hours of doxycycline treatment as indicated. A. FOXM1 RT-qPCR (log10). B. FOXM1 Western blot. β-actin is shown as a loading control. C. Cell cycle analysis following Dox-inducible FOXM1c overexpression in primary hOSE cells after 72 hours of treatment. Cells treated with 250 ng/ml and 1000 ng/ml doxycycline were combined for analysis and compared against the control without treatment. D. FOXM1 target gene expression was measured by RT-qPCR in hOSE cells following 72 hours of doxycycline treatment to induce FOXM1c. Expression data are shown for SKP2, PLK1, and CCNB1, each normalized to 18s rRNA. Data represents mean ± SD. Student's t-test p values are shown. P value designation: **** < 0.0001, *** < 0.001, ** < 0.01, * < 0.05.

References

    1. Cannistra S.A. Cancer of the ovary. The New England journal of medicine. 2004;351:2519–29. - PubMed
    1. Vaughan S, et al. Rethinking ovarian cancer: recommendations for improving outcomes. Nature reviews Cancer. 2011;11:719–25. - PMC - PubMed
    1. Bast R.C, Jr., Hennessy B, Mills G.B. The biology of ovarian cancer: new opportunities for translation. Nat Rev Cancer. 2009;9:415–28. - PMC - PubMed
    1. Cancer Genome Atlas Research, N Integrated genomic analyses of ovarian carcinoma. Nature. 2011;474:609–15. - PMC - PubMed
    1. Kuo K.T, et al. Analysis of DNA copy number alterations in ovarian serous tumors identifies new molecular genetic changes in low-grade and high-grade carcinomas. Cancer Res. 2009;69:4036–42. - PMC - PubMed

Publication types

MeSH terms