

Monocytes from HIV-infected individuals show impaired cholesterol efflux and increased foam cell formation after transendothelial migration
- PMID: 26244384
- PMCID: PMC5086669
- DOI: 10.1097/QAD.0000000000000739
Monocytes from HIV-infected individuals show impaired cholesterol efflux and increased foam cell formation after transendothelial migration
Abstract
Design: HIV-infected (HIV+) individuals have an increased risk of atherosclerosis and cardiovascular disease which is independent of antiretroviral therapy and traditional risk factors. Monocytes play a central role in the development of atherosclerosis, and HIV-related chronic inflammation and monocyte activation may contribute to increased atherosclerosis, but the mechanisms are unknown.
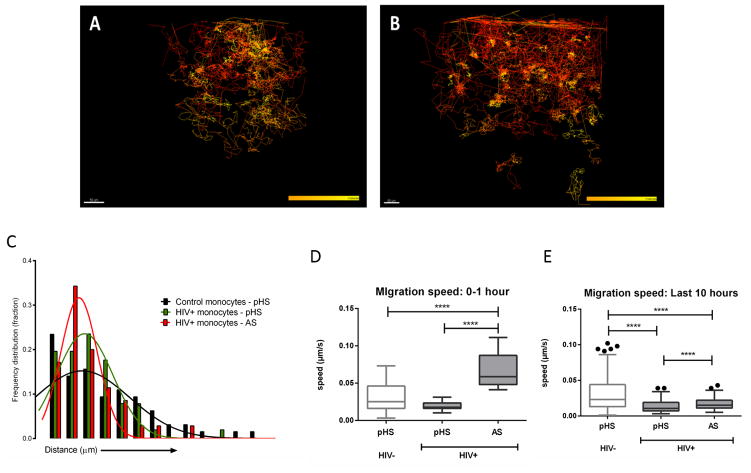
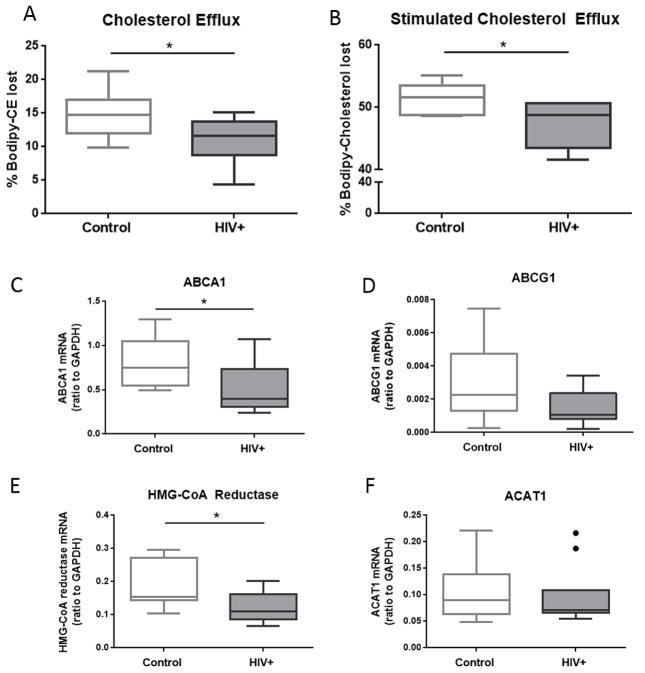
Methods: Using an in-vitro model of atherosclerotic plaque formation, we measured the transendothelial migration of purified monocytes from age-matched HIV+ and uninfected donors and examined their differentiation into foam cells. Cholesterol efflux and the expression of cholesterol metabolism genes were also assessed.
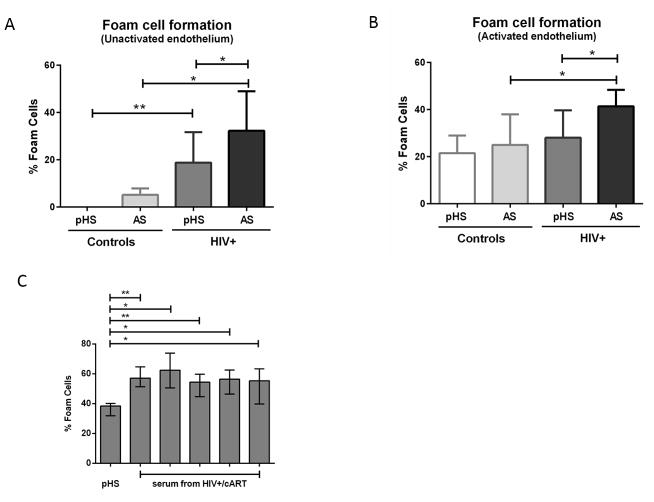
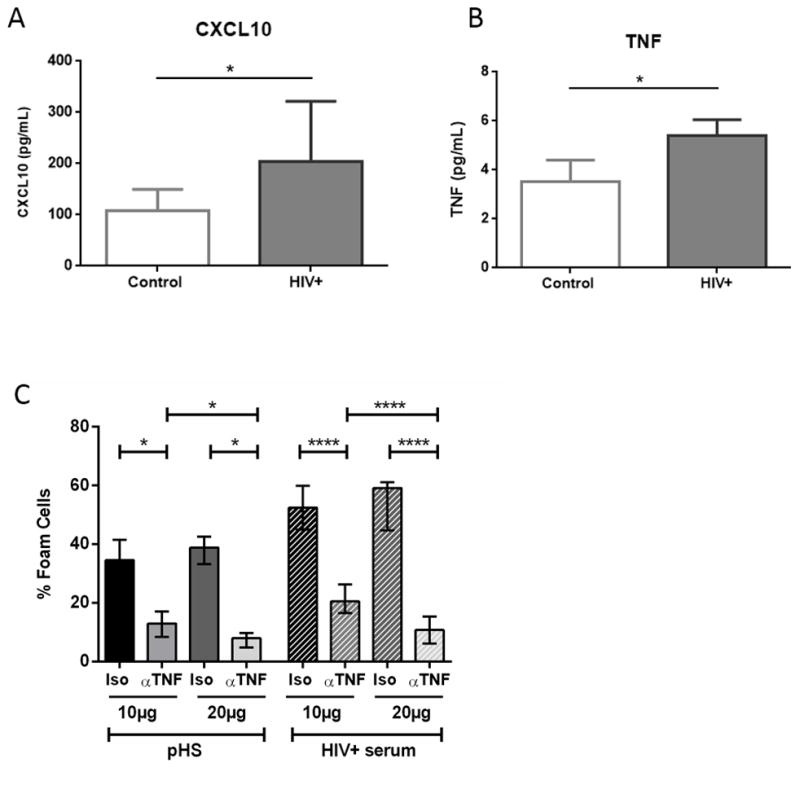
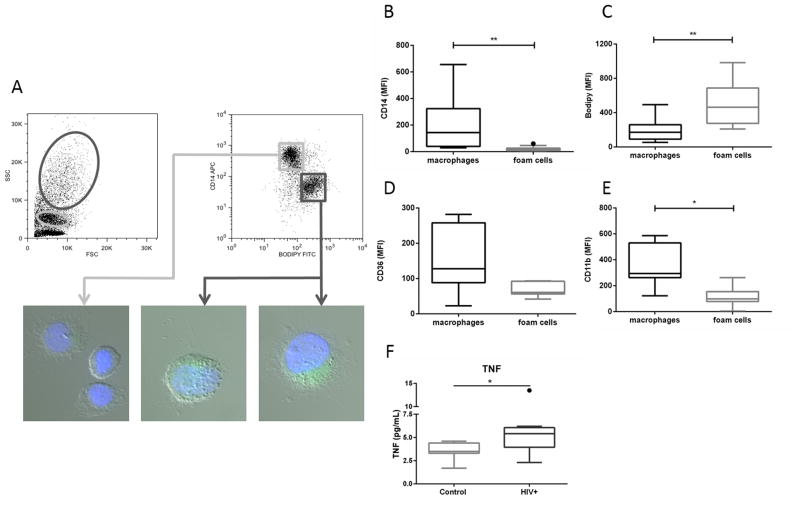
Results: Monocytes from HIV+ individuals showed increased foam cell formation compared with controls (18.9 vs. 0%, respectively, P = 0.004) and serum from virologically suppressed HIV+ individuals potentiated foam cell formation by monocytes from both uninfected and HIV+ donors. Plasma tumour necrosis factor (TNF) levels were increased in HIV+ vs. control donors (5.9 vs. 3.5 pg/ml, P = 0.02) and foam cell formation was inhibited by blocking antibodies to TNF receptors, suggesting a direct effect on monocyte differentiation to foam cells. Monocytes from virologically suppressed HIV+ donors showed impaired cholesterol efflux and decreased expression of key genes regulating cholesterol metabolism, including the cholesterol transporter ABCA1 (P = 0.02).
Conclusion: Monocytes from HIV+ individuals show impaired cholesterol efflux and are primed for foam cell formation following transendothelial migration. Factors present in HIV+ serum, including elevated TNF levels, further enhance foam cell formation. The proatherogenic phenotype of monocytes persists in virologically suppressed HIV+ individuals and may contribute mechanistically to increased atherosclerosis in this population.
Conflict of interest statement
The authors declare no conflicts of interest.
Figures
Similar articles
-
Ex vivo foam cell formation is enhanced in monocytes from older individuals by both extrinsic and intrinsic mechanisms.Exp Gerontol. 2016 Jul;80:17-26. doi: 10.1016/j.exger.2016.04.006. Epub 2016 Apr 9. Exp Gerontol. 2016. PMID: 27073169
-
Monocytes from men living with HIV exhibit heightened atherogenic potential despite long-term viral suppression with antiretroviral therapy.AIDS. 2020 Mar 15;34(4):513-518. doi: 10.1097/QAD.0000000000002460. AIDS. 2020. PMID: 32108672
-
Dysfunctional high-density lipoprotein from HIV+ individuals promotes monocyte-derived foam cell formation in vitro.AIDS. 2017 Nov 13;31(17):2331-2336. doi: 10.1097/QAD.0000000000001642. AIDS. 2017. PMID: 28926407 Free PMC article.
-
How Monocytes Contribute to Increased Risk of Atherosclerosis in Virologically-Suppressed HIV-Positive Individuals Receiving Combination Antiretroviral Therapy.Front Immunol. 2019 Jun 19;10:1378. doi: 10.3389/fimmu.2019.01378. eCollection 2019. Front Immunol. 2019. PMID: 31275317 Free PMC article. Review.
-
HIV, inflammation, and calcium in atherosclerosis.Arterioscler Thromb Vasc Biol. 2014 Feb;34(2):244-50. doi: 10.1161/ATVBAHA.113.302191. Epub 2013 Nov 21. Arterioscler Thromb Vasc Biol. 2014. PMID: 24265418 Review.
Cited by
-
Association of Endothelial Dysfunction and Antiretroviral Therapy in Early HIV Infection.JAMA Netw Open. 2019 Oct 2;2(10):e1913615. doi: 10.1001/jamanetworkopen.2019.13615. JAMA Netw Open. 2019. PMID: 31626317 Free PMC article.
-
HIV infection, antiretroviral therapy, and measures of endothelial function, inflammation, metabolism, and oxidative stress.PLoS One. 2017 Aug 17;12(8):e0183511. doi: 10.1371/journal.pone.0183511. eCollection 2017. PLoS One. 2017. PMID: 28817706 Free PMC article.
-
Dysregulation of sterol regulatory element-binding protein 2 gene in HIV treatment-experienced individuals.PLoS One. 2019 Dec 17;14(12):e0226573. doi: 10.1371/journal.pone.0226573. eCollection 2019. PLoS One. 2019. PMID: 31846498 Free PMC article.
-
Lipidome Abnormalities and Cardiovascular Disease Risk in HIV Infection.Curr HIV/AIDS Rep. 2019 Jun;16(3):214-223. doi: 10.1007/s11904-019-00442-9. Curr HIV/AIDS Rep. 2019. PMID: 30993515 Free PMC article. Review.
-
Prevalence and risk factors of high cholesterol and triglycerides among people with HIV in Texas.AIDS Res Ther. 2022 Sep 19;19(1):43. doi: 10.1186/s12981-022-00467-y. AIDS Res Ther. 2022. PMID: 36123679 Free PMC article.
References
-
- Rodger AJ, Lodwick R, Schechter M, Deeks S, Amin J, Gilson R, et al. Mortality in well controlled HIV in the continuous antiretroviral therapy arms of the SMART and ESPRIT trials compared with the general population. AIDS. 2013;27(6):973–9. - PubMed
-
- Currier JS, Taylor A, Boyd F, Dezii CM, Kawabata H, Burtcel B, et al. Coronary heart disease in HIV-infected individuals. J Acquir Immune Defic Syndr. 2003;33(4):506–12. - PubMed
Publication types
MeSH terms
Substances
Grants and funding
LinkOut - more resources
Full Text Sources
Medical
