. 2015 Aug 5;11(8):e1005086.
doi: 10.1371/journal.ppat.1005086. eCollection 2015 Aug.

A Non-enveloped Virus Hijacks Host Disaggregation Machinery to Translocate across the Endoplasmic Reticulum Membrane

Affiliations

A Non-enveloped Virus Hijacks Host Disaggregation Machinery to Translocate across the Endoplasmic Reticulum Membrane

Madhu Sudhan Ravindran et al. PLoS Pathog. .

Abstract

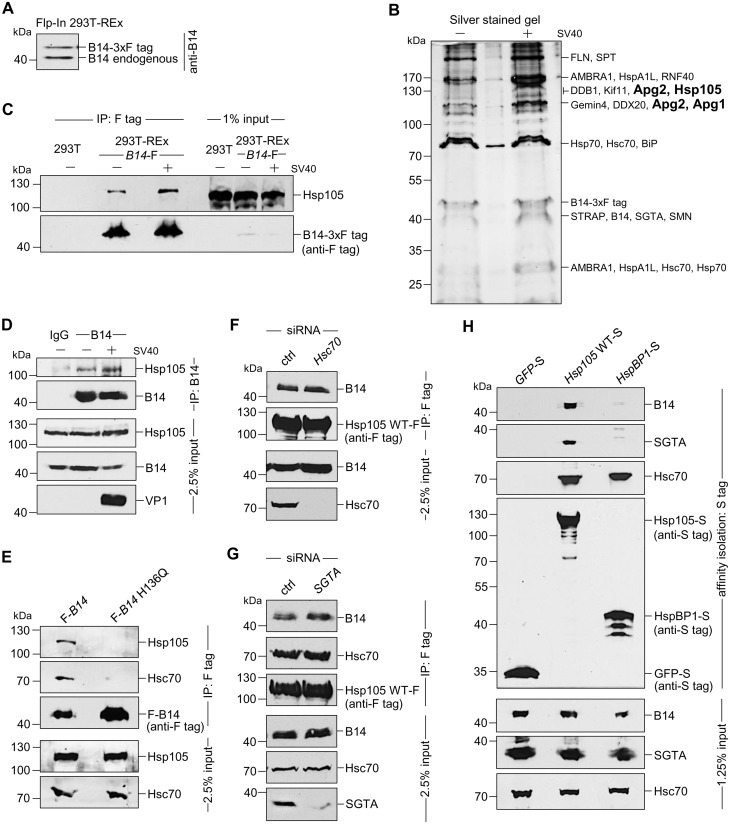
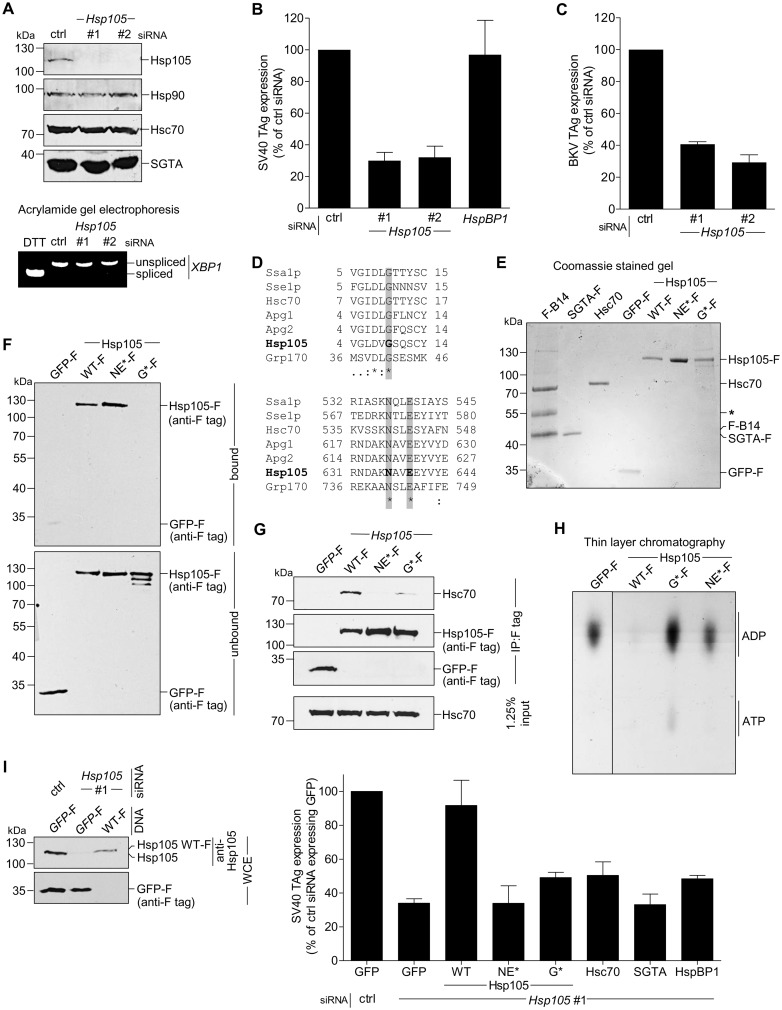
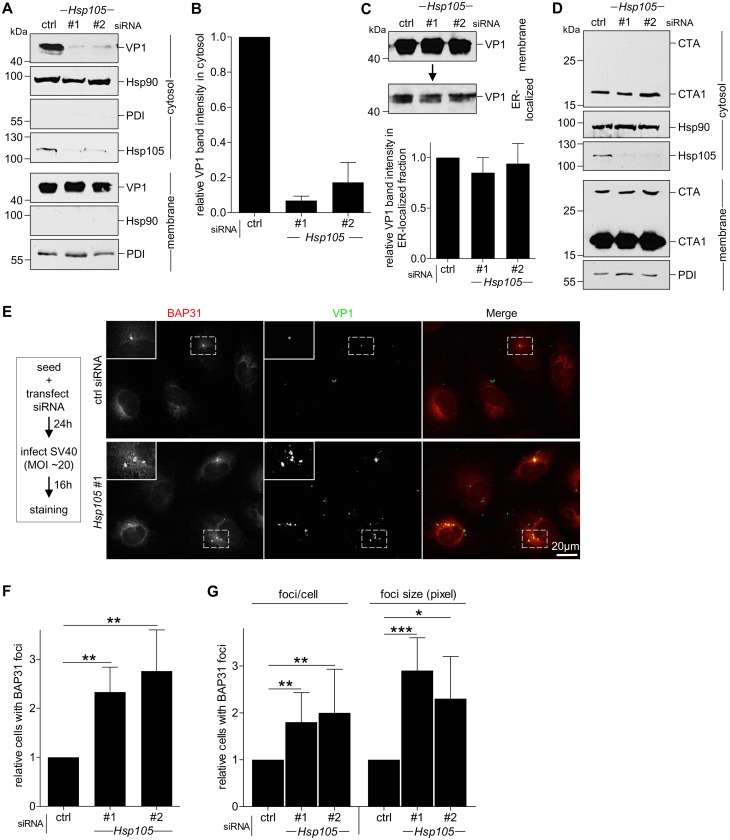
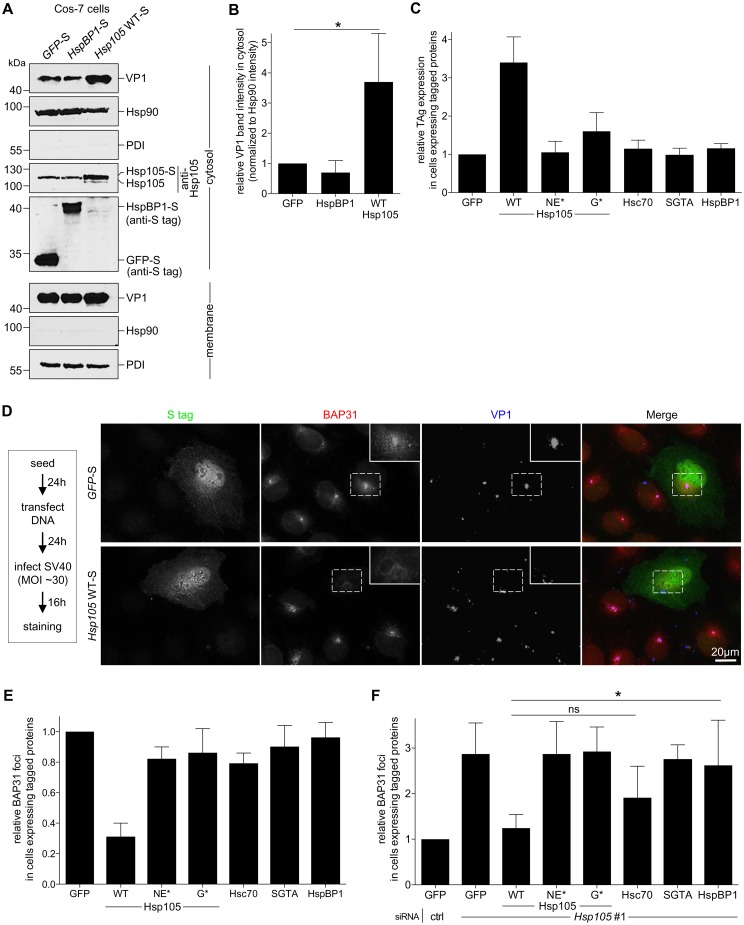
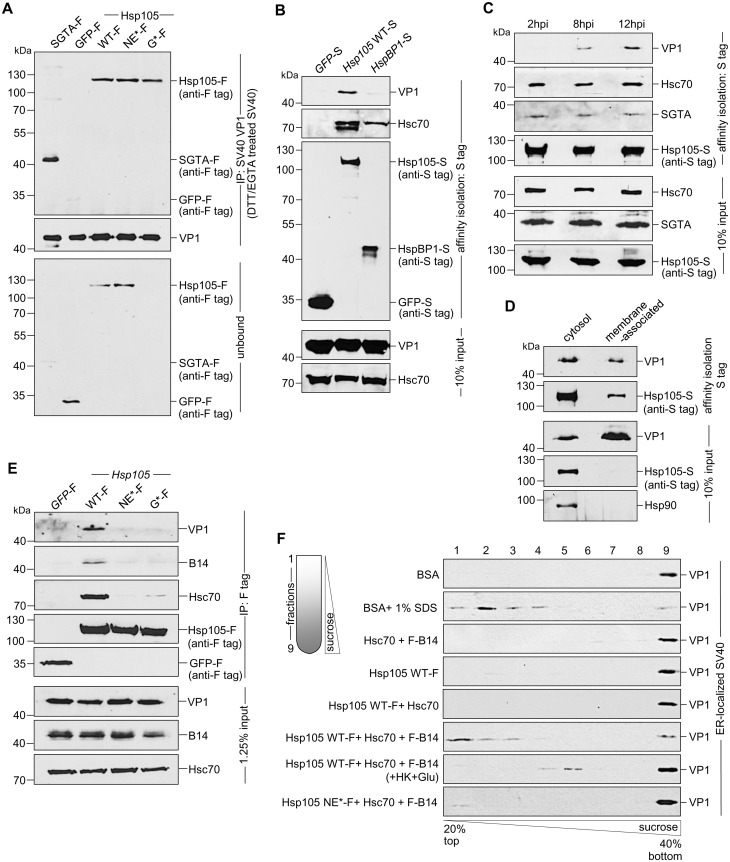
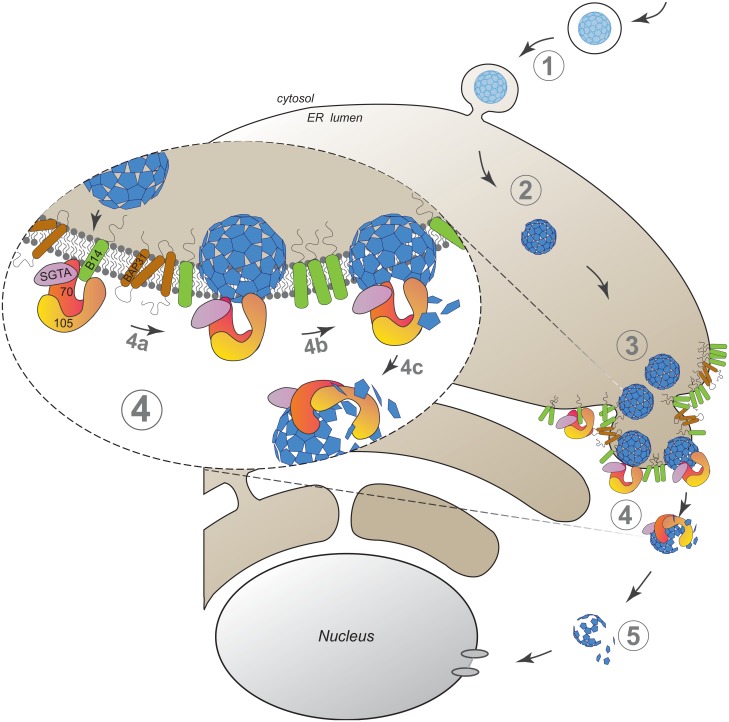
Mammalian cytosolic Hsp110 family, in concert with the Hsc70:J-protein complex, functions as a disaggregation machinery to rectify protein misfolding problems. Here we uncover a novel role of this machinery in driving membrane translocation during viral entry. The non-enveloped virus SV40 penetrates the endoplasmic reticulum (ER) membrane to reach the cytosol, a critical infection step. Combining biochemical, cell-based, and imaging approaches, we find that the Hsp110 family member Hsp105 associates with the ER membrane J-protein B14. Here Hsp105 cooperates with Hsc70 and extracts the membrane-penetrating SV40 into the cytosol, potentially by disassembling the membrane-embedded virus. Hence the energy provided by the Hsc70-dependent Hsp105 disaggregation machinery can be harnessed to catalyze a membrane translocation event.


Conflict of interest statement

The authors have declared that no competing interests exist.

Figures

Fig 1
Fig 1. The cytosolic Hsp105 interacts with the ER membrane J-protein B14
A. Expression of B14-3xF and endogenous B14 in Flp-In 293 T-Rex cell lysates were analyzed by immunoblotting against B14. A corresponding molecular weight marker in kDa is shown on the left. B. B14-3xF was immunopurified from Flp-In 293 T-Rex cells infected with SV40 MOI ~50 (‘+’) or uninfected (‘-’). Bound proteins were eluted with 3x FLAG peptide, and the samples separated by SDS-PAGE followed by silver staining. Bands (indicated on the right) were excised and subjected to mass spectrometry analysis. Protein identities of the bands are listed on the right side of the gel. C. Samples in (B) were immunoblotted with the indicated antibodies. Uninfected HEK 293T cells not expressing B14-3xF were used as a control. D. CV-1 cells were cross-linked with DSP, lysed, the endogenous B14 immunoprecipitated, and the precipitated samples subjected to immunoblotting using the indicated antibodies. Where indicated, cells were infected with SV40. E. Cells expressing F-B14 or F-B14 H136Q were cross-linked, lysed, and the FLAG-tagged proteins immunoprecipitated followed by immunoblotting using the indicated antibodies. F. CV-1 cells treated with a control (ctrl) or Hsc70 siRNA were transfected with Hsp105 WT-F, and the FLAG-tagged protein immunoprecipitated followed by immunoblotting using the indicated antibodies. G. As in F, except SGTA siRNA was used. H. The S-tagged protein in CV-1 cells were affinity purified and immunoblotted using the indicated antibodies.
Fig 2
Fig 2. Hsp105 is essential for polyomavirus infection.
A. CV-1 cells were transfected with a ctrl siRNA, or Hsp105 siRNA #1 or #2 for 24 h, and the resulting WCE were immunoblotted with the indicated antibodies (top panel) or RT-PCR analysis was performed to observe the XBP1 splicing (bottom panel). Cells treated with DTT were used as a positive control. B. Cells in (A) were infected with SV40 (MOI ~0.5) for 24 h, fixed, and immunostained against SV40 large T antigen (TAg). Infection was scored using immunofluorescence microscopy (counting >1000 cells for each condition). Data are normalized to the ctrl siRNA. Values represent the mean ± SD (n≥3). C. As in (B), except cells were infected with BKV for 40 h before immunostaining for BKV TAg. D. Multiple sequence alignment of Hsp70 and Hsp110 family proteins from yeast and humans. Only the relevant sequences are shown. The highlighted regions indicate the amino acid(s) that were altered to generate the Hsp105 mutants (see Methods). E. The indicated F-tagged proteins were purified from 293T cells, and their purity analyzed by SDS-PAGE followed by staining with Brilliant Blue R250. Hsc70 was obtained from commercial source (see Methods). The asterisk indicates an antibody heavy chain band. F. Purified proteins in (E) were incubated with ATP conjugated-agarose beads. Unbound and bound proteins were analyzed by immunoblotting using a FLAG antibody. G. CV-1 cells expressing the indicated F-tagged proteins were immunoprecipitated, and the eluted samples were analyzed by immunoblotting. H. Thin layer chromatography was used to determine the level of radiolabeled ADP that remain bound to Hsc70 after the indicated purified protein was incubated with radiolabeled ADP-Hsc70. The black line indicates that an intervening lane has been spliced out of the same film. I. CV-1 cells were reverse transfected with ctrl or Hsp105 siRNA #1 for 24 h prior to transfection with the indicated tagged constructs for 24 h. Cells were then infected with SV40 (MOI ~0.5) for 24 h, fixed, and stained with anti-FLAG/S and anti-TAg antibodies. The percentage of TAg positive cells were counted only in cells expressing the indicated tagged protein by immunofluorescence microscopy (right graph). Values represent mean ± SD (n≥3). The protein expression levels of endogenous Hsp105, as well as transfected Hsp105 WT-F and GFP-F, in cell extracts derived from control and Hsp105-depleted cells (transfected with either GFP-F or Hsp105 WT-F) are shown (left panels). The three lanes in the immunoblot correspond to the first three bars in the right graph.
Fig 3
Fig 3. Hsp105 is indispensable for SV40 cytosol arrival.
A. CV-1 cells transfected with the indicated siRNAs for 24 h were incubated with SV40 (MOI ~5), harvested 12 hpi, and processed according to the semi-permeabilized cytosol arrival assay (see Methods). Hsp90 and PDI serve as markers for the cytosol and membrane fraction, respectively. B. Relative VP1 band intensities in the cytosol fraction in (A) were quantified. Data are normalized to ctrl siRNA. Values represent the mean ± SD (n = 3). C. Membrane fraction in (A) was solubilized in a buffer containing 1% Triton X-100. After centrifugation, the extracted material containing ER-localized SV40 was analyzed by immunoblotting with VP1 antibodies (top panel). Relative VP1 band intensities in the ER-localized fraction were quantified as in (B) (bottom panel). D. As in (A), except cells were treated with 10 nM cholera toxin for 90 min before harvesting and analyzing using the indicated antibodies. E. CV-1 cells were transfected with either ctrl or Hsp105 siRNA #1. After 24 h, cells were infected with SV40 (MOI ~20) for 16 h. Cells were then fixed, stained, and analyzed by immunofluorescence microscopy. The experimental set-up is depicted on the left side of the figure. The insert shows a 2x enlarged area of the dotted box. Scale bar, 20 μm. F. The siRNA-transfected cells were scored for the presence of at least one BAP31-positive focus in each cell, and the values normalized to the ctrl siRNA. The bar graphs represent mean values ± SD (n≥3). ** p <0.01. G. Results in (F) were further assessed by quantifying the number of BAP31 foci/cell under control and knockdown conditions, or the size of the BAP31 foci based on the measured area (in pixels) using the ImageJ software. * p <0.05, ** p <0.01, *** p <0.001.
Fig 4
Fig 4. Hsp105 overexpression enhances SV40 extraction into the cytosol.
A. COS-7 cells expressing the indicated S-tagged construct were infected with SV40 (MOI ~5). 12 hpi, cells were processed as in Fig 3A, and the samples immunoblotted using the indicated antibodies. B. VP1 band intensities of the cytosol-localized SV40 in (A) were quantified and normalized against the Hsp90 band intensity. Values represent the mean ± SD (n≥3). * p <0.05. C. Cells expressing the indicated F- or S-tagged construct are scored for the TAg expression after 24 hpi (MOI ~0.5), and the values normalized to GFP. The bar graphs represent mean values ± SD (n≥3). D. CV-1 cells expressing GFP-S or Hsp105 WT-S were infected with SV40 (MOI ~30) for 16 h. Cells were fixed, stained with BAP31 and VP1 antibodies, and imaged as in Fig 3E. The experimental set-up is depicted on the left side of the figure. In the first column, a representative cell expressing GFP-S (top row) or Hsp105 WT-S (second row) amongst cells not expressing this protein is shown. The insert shows a 2x enlarged area of the dotted box. Scale bar, 20 μm. E. Cells expressing the indicated tagged construct are scored for the presence of at least one BAP31-positive focus in each cell, and the values normalized to GFP. The bar graphs represent mean values ± SD (n≥3). F. Cells transfected with either ctrl or Hsp105 siRNA #1 were subsequently transfected with the indicated tagged construct, and BAP31 foci were quantified as in (E). * p <0.05.
Fig 5
Fig 5. Hsp105 engages ER membrane-penetrating SV40 and promotes disassembly of the virus.
A. The indicated purified protein in Fig 2E was incubated with DTT/EGTA-treated SV40. SV40 was immunoprecipitated from the sample and analyzed by immunoblotting using the indicated antibodies. B. CV-1 cells expressing the indicated S-tagged protein were infected with SV40 (MOI ~10). 12 hpi, S-tagged proteins affinity purified from WCE and immunoblot was performed with the indicated antibodies. C. As in (B), except cells were infected with SV40 for the indicated time. D. Cells expressing Hsp105 WT-S were infected with SV40 for 12 h, cross-linked with DSP, and fractionated to generate a cytosol and membrane fraction. Hsp105 WT-S was affinity isolated from each fraction, and the samples analyzed by immunoblotting with the indicated antibodies. E. As in (B), except the indicated F-tagged constructs were expressed in the cells. F. Triton X-100 extracted, ER-localized SV40 was incubated with the indicated purified protein(s), and subjected to discontinuous sucrose gradient centrifugation. Fractions were collected (as shown on the left side of the figure) from the top of the gradient and analyzed for the presence of SV40 by immunoblotting using VP1 antibodies.
Fig 6
Fig 6. A model depicting Hsp105-dependent extraction of SV40 from the ER into the cytosol.
SV40 infection is initiated when the virus traffics from the cell surface to the ER (step 1). In the ER, specific ER-resident isomerase and reductase induce conformational changes to the virus, generating a hydrophobic particle (step 2). The hydrophobic virus then binds to and integrates into the ER membrane where SV40 accumulates into discrete foci (step 3). We envision that Hsp105, anchored to the membrane-bound J-protein B14 directly or indirectly via Hsc70/Hsp70, binds to the membrane-penetrating virus (step 4a, see insert). Continuous cycles of binding-release of SV40 by Hsp105-Hsc70 initiates the extraction process, a step that may be coupled to disassembly of the membrane-embedded viral particle (step 4b). Extraction is completed when SV40 is fully released into the cytosol (step 4c). Upon cytosol arrival, a partially disassembled viral particle intermediate mobilizes into the nucleus to stimulate infection (step 5).

Similar articles

Cited by

References

    1. Buchberger A, Bukau B, Sommer T (2010) Protein quality control in the cytosol and the endoplasmic reticulum: brothers in arms. Mol Cell 40: 238–252. 10.1016/j.molcel.2010.10.001 - DOI - PubMed
    1. Hartl FU, Bracher A, Hayer-Hartl M (2011) Molecular chaperones in protein folding and proteostasis. Nature 475: 324–332. 10.1038/nature10317 - DOI - PubMed
    1. Saibil H (2013) Chaperone machines for protein folding, unfolding and disaggregation. Nat Rev Mol Cell Biol 14: 630–642. 10.1038/nrm3658 - DOI - PMC - PubMed
    1. Hetz C, Chevet E, Harding HP (2013) Targeting the unfolded protein response in disease. Nat Rev Drug Discov 12: 703–719. 10.1038/nrd3976 - DOI - PubMed
    1. Sontag EM, Vonk WI, Frydman J (2014) Sorting out the trash: the spatial nature of eukaryotic protein quality control. Curr Opin Cell Biol 26: 139–146. 10.1016/j.ceb.2013.12.006 - DOI - PMC - PubMed

Publication types

MeSH terms

Substances

LinkOut - more resources