Comparison of Leaf Sheath Transcriptome Profiles with Physiological Traits of Bread Wheat Cultivars under Salinity Stress
- PMID: 26244554
- PMCID: PMC4526543
- DOI: 10.1371/journal.pone.0133322
Comparison of Leaf Sheath Transcriptome Profiles with Physiological Traits of Bread Wheat Cultivars under Salinity Stress
Abstract
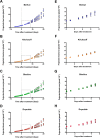
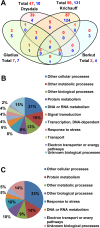
Salinity stress has significant negative effects on plant biomass production and crop yield. Salinity tolerance is controlled by complex systems of gene expression and ion transport. The relationship between specific features of mild salinity stress adaptation and gene expression was analyzed using four commercial varieties of bread wheat (Triticum aestivum) that have different levels of salinity tolerance. The high-throughput phenotyping system in The Plant Accelerator at the Australian Plant Phenomics Facility revealed variation in shoot relative growth rate and salinity tolerance among the four cultivars. Comparative analysis of gene expression in the leaf sheaths identified genes whose functions are potentially linked to shoot biomass development and salinity tolerance. Early responses to mild salinity stress through changes in gene expression have an influence on the acquisition of stress tolerance and improvement in biomass accumulation during the early "osmotic" phase of salinity stress. In addition, results revealed transcript profiles for the wheat cultivars that were different from those of usual stress-inducible genes, but were related to those of plant growth. These findings suggest that, in the process of breeding, selection of specific traits with various salinity stress-inducible genes in commercial bread wheat has led to adaptation to mild salinity conditions.
Conflict of interest statement
Figures


Similar articles
-
Sodium exclusion QTL associated with improved seedling growth in bread wheat under salinity stress.Theor Appl Genet. 2010 Sep;121(5):877-94. doi: 10.1007/s00122-010-1357-y. Epub 2010 May 19. Theor Appl Genet. 2010. PMID: 20490443
-
A rice stress-responsive NAC gene enhances tolerance of transgenic wheat to drought and salt stresses.Plant Sci. 2013 Apr;203-204:33-40. doi: 10.1016/j.plantsci.2012.12.016. Epub 2013 Jan 3. Plant Sci. 2013. PMID: 23415326
-
Gel-free/label-free proteomic analysis of wheat shoot in stress tolerant varieties under iron nanoparticles exposure.Biochim Biophys Acta. 2016 Nov;1864(11):1586-98. doi: 10.1016/j.bbapap.2016.08.009. Epub 2016 Aug 12. Biochim Biophys Acta. 2016. PMID: 27530299
-
Insights into Salinity Tolerance in Wheat.Genes (Basel). 2024 Apr 29;15(5):573. doi: 10.3390/genes15050573. Genes (Basel). 2024. PMID: 38790202 Free PMC article. Review.
-
Comparative genetic, biochemical and physiological analysis of sodium and chlorine in wheat.Mol Biol Rep. 2022 Oct;49(10):9715-9724. doi: 10.1007/s11033-022-07453-7. Epub 2022 May 5. Mol Biol Rep. 2022. PMID: 35513633 Review.
Cited by
-
Salinity stress tolerance and omics approaches: revisiting the progress and achievements in major cereal crops.Heredity (Edinb). 2022 Jun;128(6):497-518. doi: 10.1038/s41437-022-00516-2. Epub 2022 Mar 5. Heredity (Edinb). 2022. PMID: 35249098 Free PMC article. Review.
-
Digital Phenotyping to Delineate Salinity Response in Safflower Genotypes.Front Plant Sci. 2021 Jun 16;12:662498. doi: 10.3389/fpls.2021.662498. eCollection 2021. Front Plant Sci. 2021. PMID: 34220887 Free PMC article.
-
Performance valuation of onion (Allium cepa L.) genotypes under different levels of salinity for the development of cultivars suitable for saline regions.Front Plant Sci. 2023 Mar 31;14:1154051. doi: 10.3389/fpls.2023.1154051. eCollection 2023. Front Plant Sci. 2023. PMID: 37063224 Free PMC article.
-
A GBS-based genome-wide association study reveals the genetic basis of salinity tolerance at the seedling stage in bread wheat (Triticum aestivum L.).Front Genet. 2022 Sep 27;13:997901. doi: 10.3389/fgene.2022.997901. eCollection 2022. Front Genet. 2022. PMID: 36238161 Free PMC article.
-
Phenomic and Physiological Analysis of Salinity Effects on Lettuce.Sensors (Basel). 2019 Nov 5;19(21):4814. doi: 10.3390/s19214814. Sensors (Basel). 2019. PMID: 31694293 Free PMC article.
References
-
- Munns R, James RA. Screening methods for salinity tolerance: a case study with tetraploid wheat. Plant and Soil. 2003;253:201–18.
Publication types
MeSH terms
Substances
LinkOut - more resources
Full Text Sources
Other Literature Sources

