. 2015 Aug 5;10(8):e0133512.
doi: 10.1371/journal.pone.0133512. eCollection 2015.

Novel Histone Deacetylase Class IIa Selective Substrate Radiotracers for PET Imaging of Epigenetic Regulation in the Brain

Affiliations

Novel Histone Deacetylase Class IIa Selective Substrate Radiotracers for PET Imaging of Epigenetic Regulation in the Brain

Robin Bonomi et al. PLoS One. .

Abstract

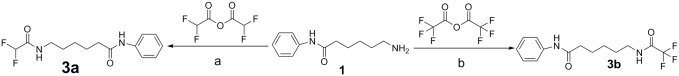
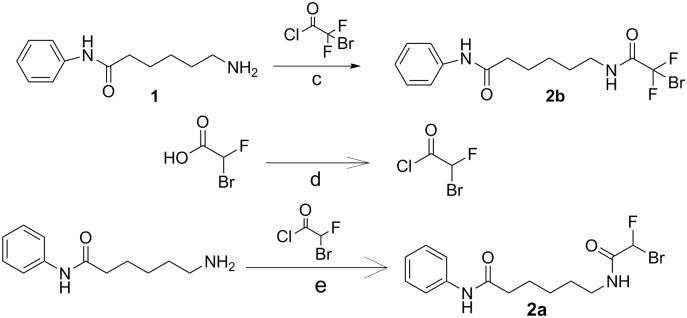
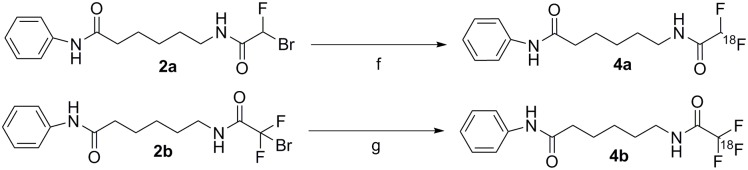
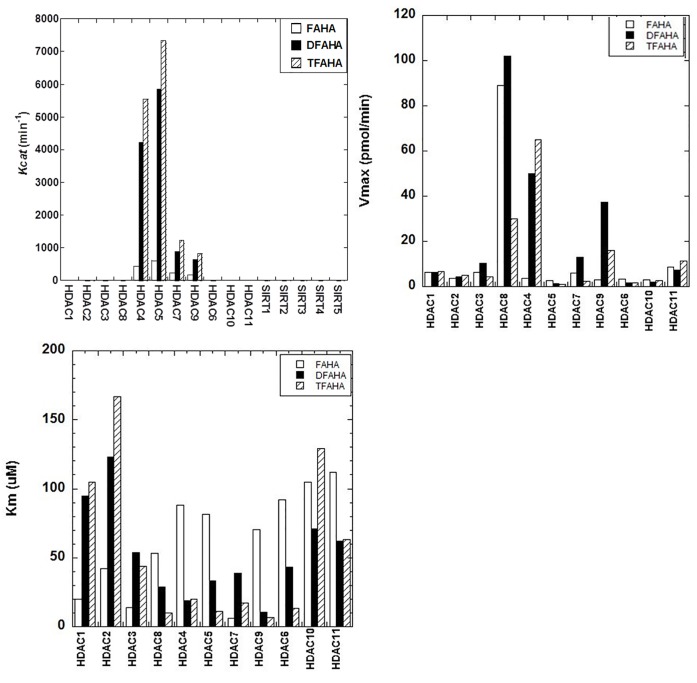
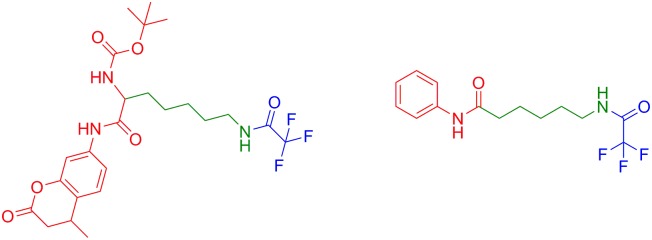
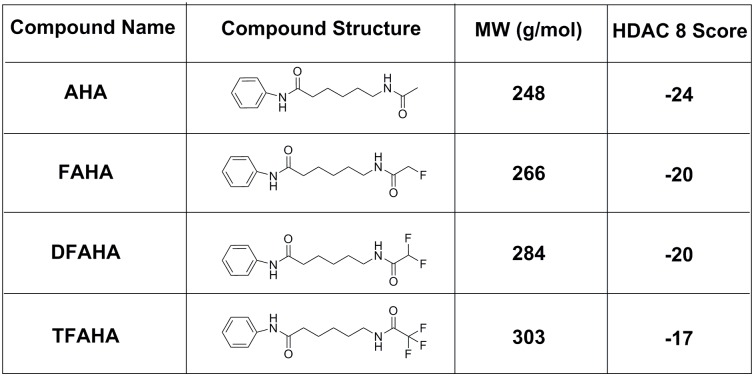
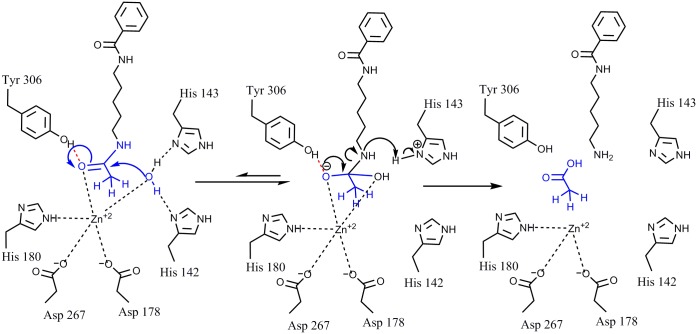
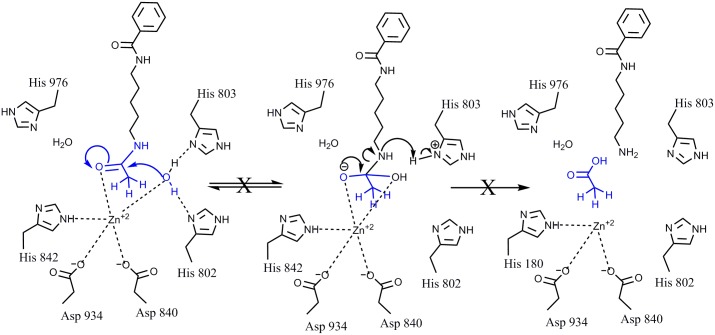
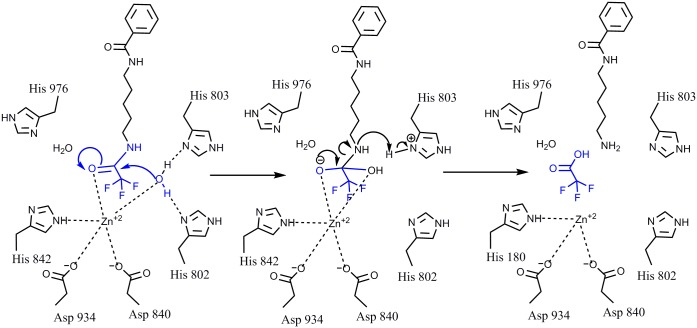
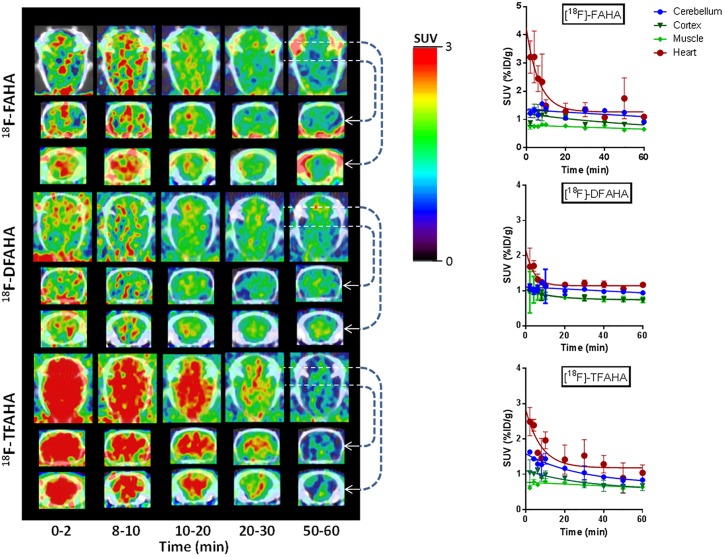
Histone deacetylases (HDAC's) became increasingly important targets for therapy of various diseases, resulting in a pressing need to develop HDAC class- and isoform-selective inhibitors. Class IIa deacetylases possess only minimal deacetylase activity against acetylated histones, but have several other client proteins as substrates through which they participate in epigenetic regulation. Herein, we report the radiosyntheses of the second generation of HDAC class IIa-specific radiotracers: 6-(di-fluoroacetamido)-1-hexanoicanilide (DFAHA) and 6-(tri-fluoroacetamido)-1-hexanoicanilide ([18F]-TFAHA). The selectivity of these radiotracer substrates to HDAC class IIa enzymes was assessed in vitro, in a panel of recombinant HDACs, and in vivo using PET/CT imaging in rats. [18F]TFAHA showed significantly higher selectivity for HDAC class IIa enzymes, as compared to [18F]DFAHA and previously reported [18F]FAHA. PET imaging with [18F]TFAHA can be used to visualize and quantify spatial distribution and magnitude of HDAC class IIa expression-activity in different organs and tissues in vivo. Furthermore, PET imaging with [18F]TFAHA may advance the understanding of HDACs class IIa mediated epigenetic regulation of normal and pathophysiological processes, and facilitate the development of novel HDAC class IIa-specific inhibitors for therapy of different diseases.


Conflict of interest statement

Competing Interests: The authors have declared that no competing interests exist.

Figures

Fig 1
Fig 1. Synthesis of DFAHA and TFAHA.
Reaction conditions are as follows: a) RT overnight; b) 2mL DCM, stirred overnight.
Fig 2
Fig 2. Synthesis of DFAHA and TFAHA precursors.
Reaction conditions are as follows: c) pyridine, acetyl chloride added drop-wise at 0°C, stirred overnight at RT d) 0.9 eq. SOCl2, 12 hr. stirred under argon at 40°C, catalytic DMF; e) DCM, triethylamine added drop-wise at 0°C, stirred 24 hr. under argon at RT.
Fig 3
Fig 3. Synthesis of [18F]DFAHA and [18F]TFAHA.
Reaction conditions are as follows: f) [18F]KF, K2,2,2; 0.4mL ACN, 105°C 25 min.; g)[18F]KF, K2,2,2; 0.4mL ACN, 105°C 25 min.
Fig 4
Fig 4
A: Shows Compound 4a in blue co-injected with compound 3a, the cold standard, in red. B: Compound 4b shown in blue with compound 3b, the cold standard, shown in red. The blue shows the clean radioactive spectrum, of the pure compound. UV detection was done at 254nm.
Fig 5
Fig 5
A) Substrate affinity of FAHA, DFAHA, and TFAHA to different recombinant HDACs in vitro. The substrate affinity is expressed as Kcat. B) Maximum catalytic rate of FAHA, DFAHA, and TFAHA for different recombinant HDACs in vitro, expressed as v max. C) The concentration required for half of the maximal catalytic activity for all recombinant HDACs expressed as k m.
Fig 6
Fig 6. The three parts of a HDAC substrate, the cap (red), the linker (green), and the leaving group (blue).
Fig 7
Fig 7. The structures of compounds and docking scores with HDAC8, a HDAC Class I enzyme.
A lower docking score indicates higher affinity.
Fig 8
Fig 8. Mechanism of deactylation of AHA by HDAC8.
In HDAC8 and other HDACs class I enzymes, the hydrogen bond forming between Tyr306 and the carbonyl oxygen of the acetyl moiety increases the electrophilicity of the carbonyl carbon, rendering it more susceptible to the nucleophilic attack by the activated water molecule, bound to His142 and His143. This leads to the formation of a tetrahedral oxyanion intermediate stabilized by Zn2+ ion and the hydroxyl group of Tyr306. Subsequently, the amide bond is cleaved and the acetyl moiety is released.
Fig 9
Fig 9. The mechanism of action of HDAC4.
As compared to HDAC class I, HDAC class IIa enzymes exhibit significantly reduced ability to deacetylate. In class IIa enzymes the His976 located in the same position in the catalytic site as Tyr306 in class I HDACs does not serve as a hydrogen bond donor to bind to the carbonyl oxygen of the leaving acetyl group and thus reduces the susceptibility of carbonyl carbon to nucleophilic attack by the water, as in HDAC class I (see Fig 4).
Fig 10
Fig 10. Proposed mechanism of de-trifluoroacetylation by HDAC4.
Increased electronegativity of trifluoromethyl moiety of the trifluoroacetyl leaving group increases the susceptibility of the carbonyl carbon to the nucleophilic attack by the water molecule bound to His802 and His803 and enables the catalytic activity of HDACs class IIa. This results in formation of the tetrahedral oxyanion, which is irreversible, thereby releasing the trifluoroacetate.
Fig 11
Fig 11
PET/CT images (A) of the spatial and temporal dynamics of influx, distribution, clearance and retention of each of the three radiotracers at different time intervals after intravenous administration: [18F]FAHA (top panel), [18F]DFAHA (middle panel), and [18F]TFAHA (bottom panel). In each panel, PET/CT images are provided in three different planes: top row—axial images through the middle of the brain; middle row–coronal images through the middle of the brain; bottom row—coronal images through the cerebellum area. Images are color-coded to range of standard uptake values (SUV) shown in the color bar and cross-normalized to facilitate direct comparison of radioactivity distribution. Corresponding time-activity plots (B) of each radiotracer are provided on the right hand side for: cerebellum (blue diamonds), muscle (green triangles), cortex (red squares), and heart (grey crosshairs).

References

    1. Haberland M, Montgomery RL, Olson EN (2009) The many roles of histone deacetylases in development and physiology: implications for disease and therapy. Nat Rev Genet 10: 32–42. 10.1038/nrg2485 - DOI - PMC - PubMed
    1. Park JH, Jung Y, Kim TY, Kim SG, Jong HS, et al. (2004) Class I histone deacetylase-selective novel synthetic inhibitors potently inhibit human tumor proliferation. Clin Cancer Res 10: 5271–5281. - PubMed
    1. de Ruijter AJ, van Gennip AH, Caron HN, Kemp S, van Kuilenburg AB (2003) Histone deacetylases (HDACs): characterization of the classical HDAC family. Biochem J 370: 737–749. - PMC - PubMed
    1. Khochbin S, Verdel A, Lemercier C, Seigneurin-Berny D (2001) Functional significance of histone deacetylase diversity. Curr Opin Genet Dev 11: 162–166. - PubMed
    1. Yang X-J, Grégoire S (2005) Class II Histone Deacetylases: from Sequence to Function, Regulation, and Clinical Implication. Molecular and Cellular Biology 25: 2873–2884. - PMC - PubMed

Publication types