

Effectiveness of a Medifast meal replacement program on weight, body composition and cardiometabolic risk factors in overweight and obese adults: a multicenter systematic retrospective chart review study
- PMID: 26245279
- PMCID: PMC4527127
- DOI: 10.1186/s12937-015-0062-8
Effectiveness of a Medifast meal replacement program on weight, body composition and cardiometabolic risk factors in overweight and obese adults: a multicenter systematic retrospective chart review study
Abstract
Background: Recent medical guidelines emphasize the importance of actively treating overweight and obesity with diet and lifestyle intervention to achieve ≥ 5% weight loss in a 6-month period. Commercial programs offer one approach provided there is evidence of their efficacy and safety. This study was conducted to evaluate the effectiveness of the Medifast® 4 & 2 & 1 Plan™ on weight loss, body composition and cardiometabolic risk factors in overweight and obese adults.
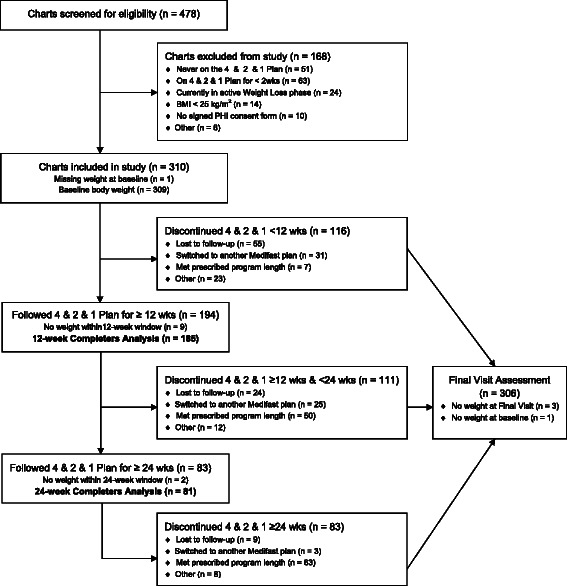
Methods: A systematic retrospective chart review of 310 overweight and obese clients following the Medifast 4 & 2 & 1 Plan at one of 21 Medifast Weight Control Centers® was conducted. Data were recorded electronically and key data points were independently verified. The primary endpoint was change from baseline body weight at 12 weeks. Within group paired t-tests were used to examine changes from baseline in a completers population. Differences between gender and age subgroups were examined using bivariate t-tests and mixed model regression analyses.
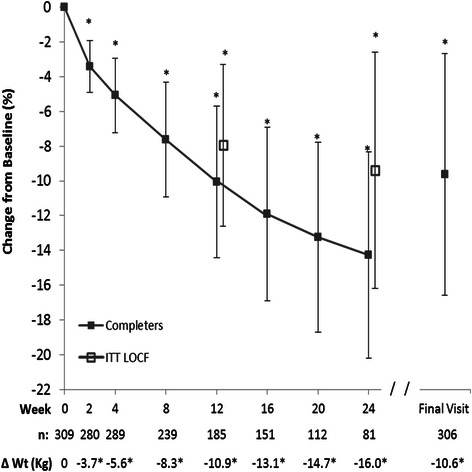
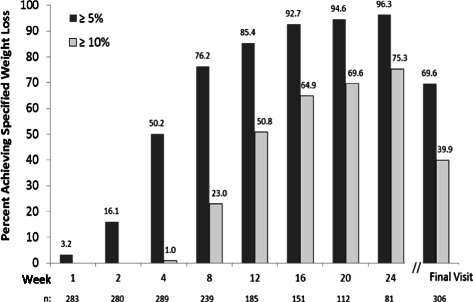
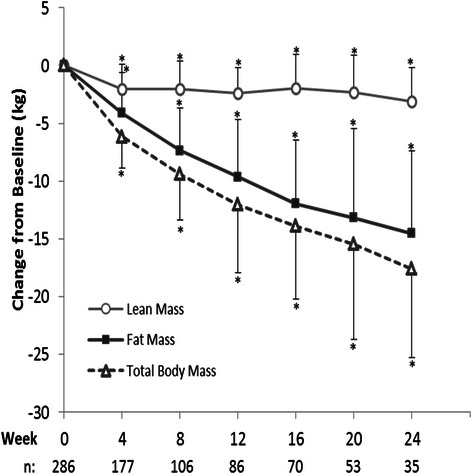
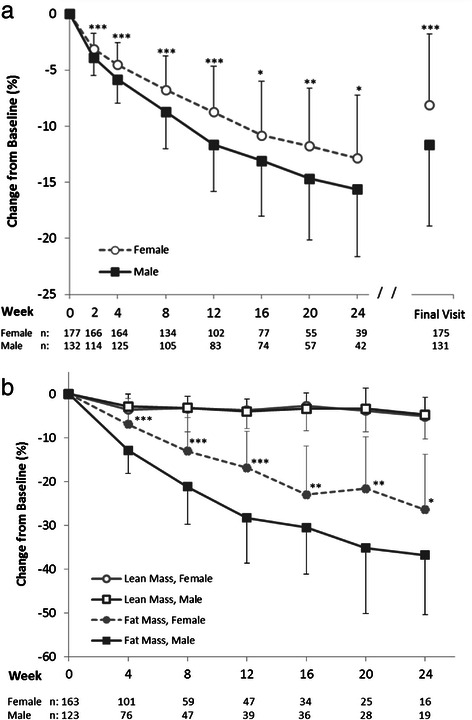
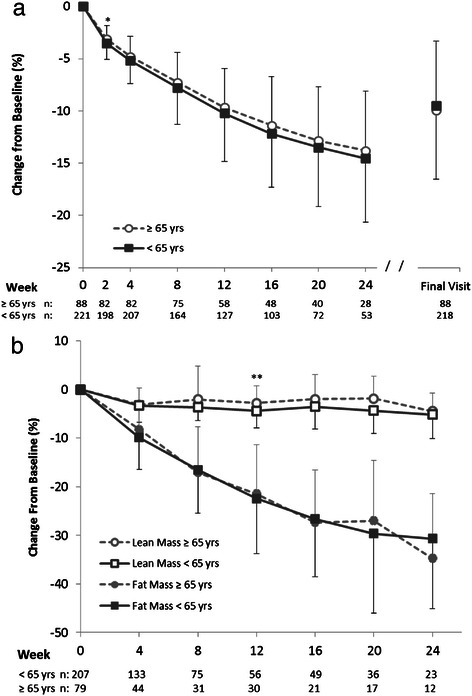
Results: For the primary endpoint at 12 weeks, body weight among completers (n = 185) was reduced by a mean of 10.9 ± 5.6 kg (-10.1%, p < 0.0001), and at 24 weeks (n = 81) mean weight was reduced by 16.0 ± 7.9 kg (-14.3%). At 12 and 24 weeks, 85% and 96% of those remaining on the plan, respectively, had lost ≥ 5% of their baseline body weight. Lean mass was preserved to within 5% of baseline throughout the 24 weeks, and fat mass represented ≥ 80% of the body weight lost from 12 weeks onward. Men, women, seniors (≥ 65 years), and non-seniors (<65 years) all had significant weight reductions with preservation of lean mass. Significant improvements in blood pressure, pulse and waist-to-hip ratio were observed. Mean weight regain among the subset who entered a formal maintenance phase was <2% during an average follow-up of 34 weeks. The meal plan was well tolerated, and program adherence was >85%.
Conclusions: The 4 & 2 & 1 Plan used at Medifast Weight Control Centers was effective for weight loss, preservation of lean mass and improvement in cardiometabolic risk factors. The plan was generally well tolerated in a broad population of overweight and obese adults. #NCT02150837.
Figures
References
-
- Jensen MD, Ryan DH, Apovian CM, Ard JD, Comuzzie AG, Donato KA, et al. AHA/ACC/TOS guideline for the management of overweight and obesity in adults: a report of the American College of Cardiology/American Heart Association Task Force on practice guidelines and the Obesity Society. Circulation. 2013;128:1–69. - PubMed
-
- United States. Public Health Service. Office of the Surgeon General, United States. Office of Disease Prevention and Health Promotion. Centers for Disease Control and Prevention (U.S.) National Institutes of Health (U.S.) The Surgeon General’s Call to Action to Prevent and Decrease Overweight and Obesity. Washington, DC: U.S. Dept. of Health and Human Services, Public Health Service, For sale by the Supt. of Docs., U.S. G.P.O; 2001.
-
- Ogden CL, Carroll MD, Kit BK, Flegal KM. Prevalence of obesity in the United States, 2009–2010. NCHS Data Brief. 2012;82:1–8. - PubMed
Publication types
MeSH terms
Associated data
LinkOut - more resources
Full Text Sources
Other Literature Sources
Medical
