. 2015 Oct;114(4):2230-41.
doi: 10.1152/jn.00188.2015. Epub 2015 Aug 5.

Rod- and cone-driven responses in mice expressing human L-cone pigment

Affiliations

Rod- and cone-driven responses in mice expressing human L-cone pigment

Tina I Tsai et al. J Neurophysiol. 2015 Oct.

Abstract

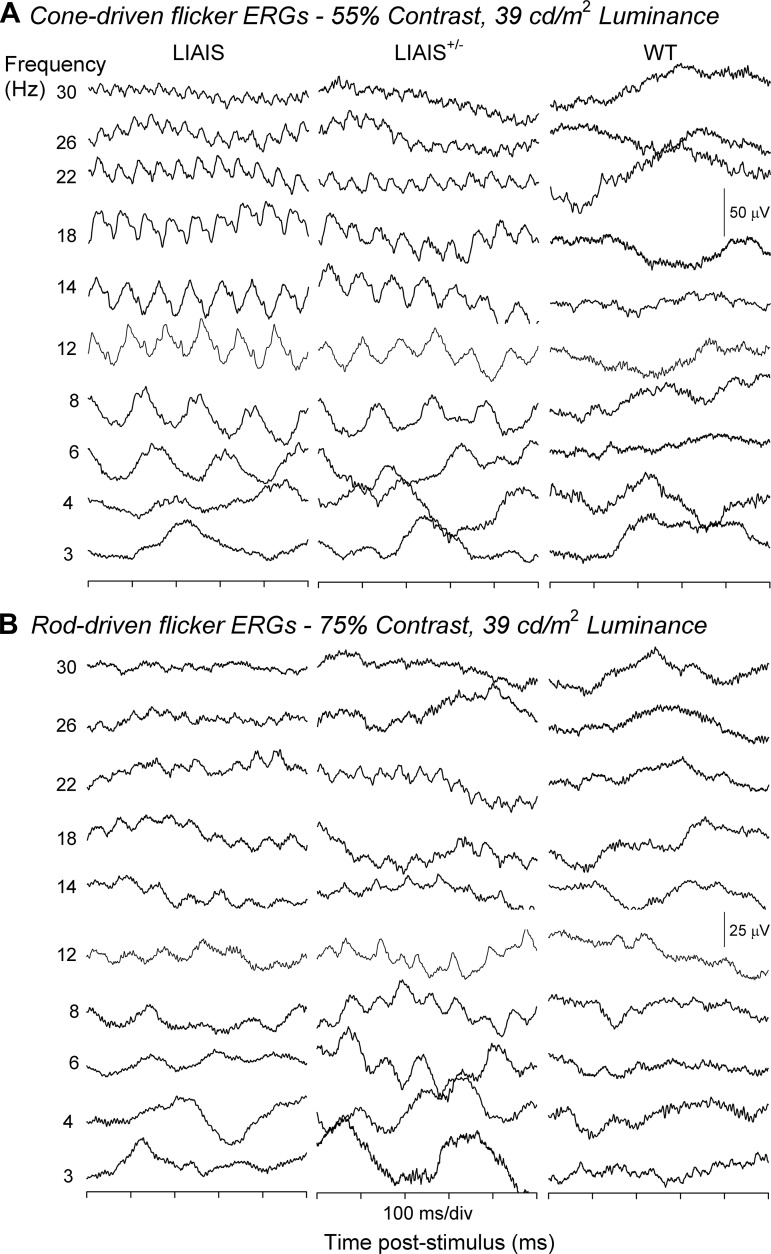
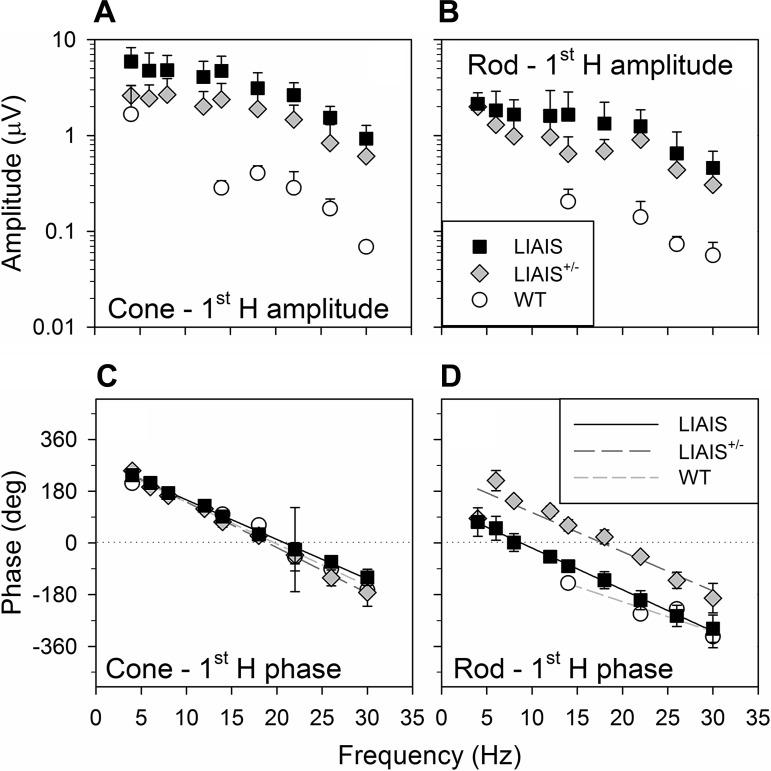
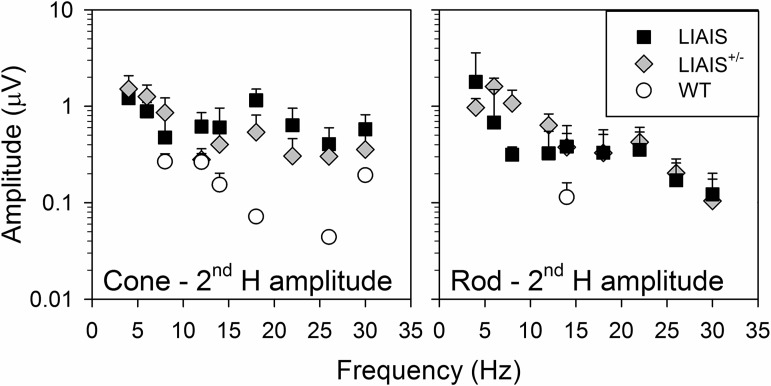
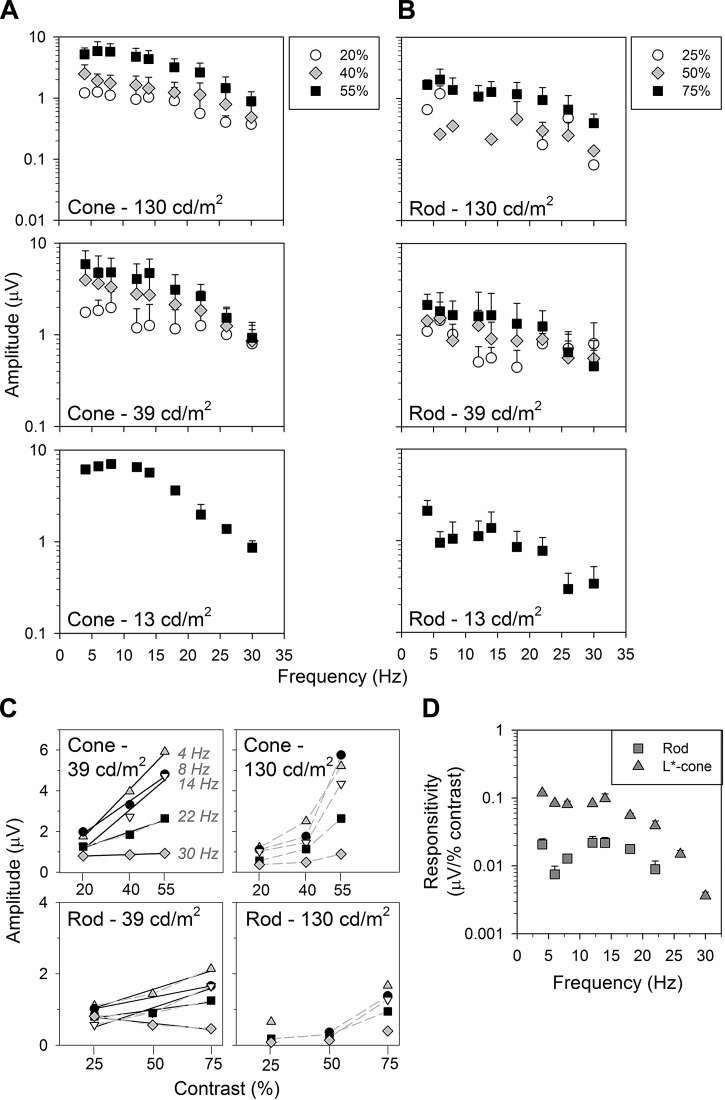
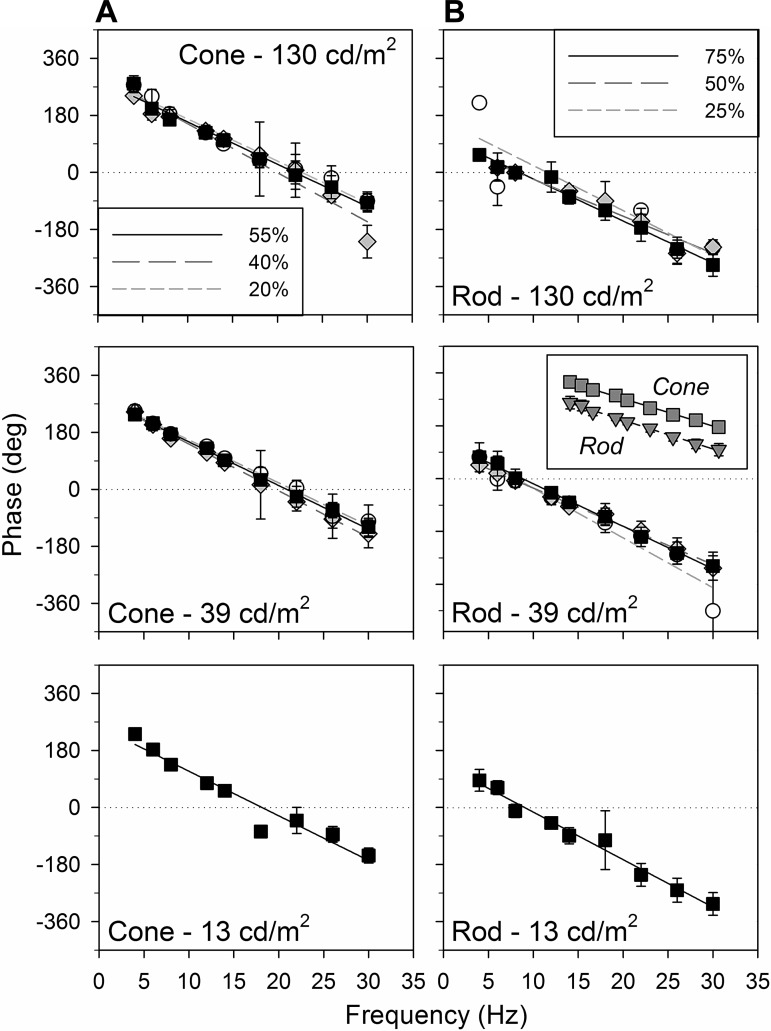
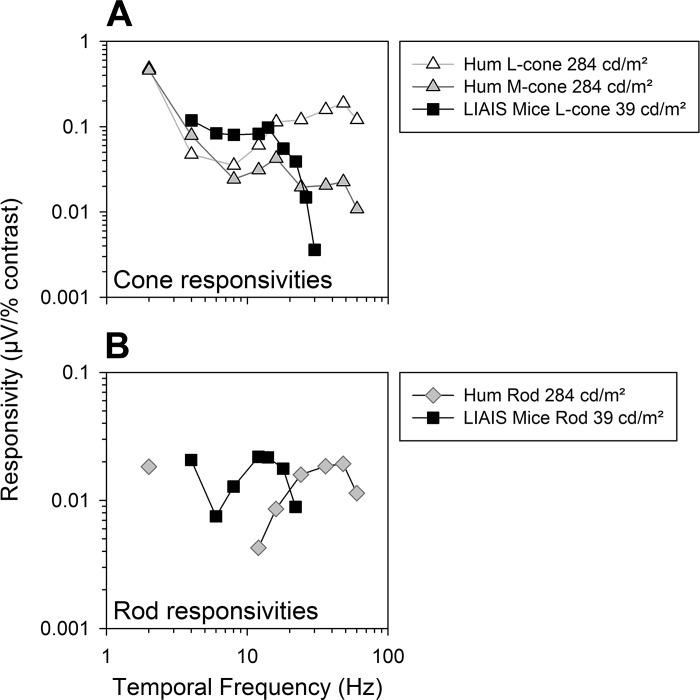
The mouse is commonly used for studying retinal processing, primarily because it is amenable to genetic manipulation. To accurately study photoreceptor driven signals in the healthy and diseased retina, it is of great importance to isolate the responses of single photoreceptor types. This is not easily achieved in mice because of the strong overlap of rod and M-cone absorption spectra (i.e., maxima at 498 and 508 nm, respectively). With a newly developed mouse model (Opn1lw(LIAIS)) expressing a variant of the human L-cone pigment (561 nm) instead of the mouse M-opsin, the absorption spectra are substantially separated, allowing retinal physiology to be studied using silent substitution stimuli. Unlike conventional chromatic isolation methods, this spectral compensation approach can isolate single photoreceptor subtypes without changing the retinal adaptation. We measured flicker electroretinograms in these mutants under ketamine-xylazine sedation with double silent substitution (silent S-cone and either rod or M/L-cones) and obtained robust responses for both rods and (L-)cones. Small signals were yielded in wild-type mice, whereas heterozygotes exhibited responses that were generally intermediate to both. Fundamental response amplitudes and phase behaviors (as a function of temporal frequency) in all genotypes were largely similar. Surprisingly, isolated (L-)cone and rod response properties in the mutant strain were alike. Thus the LIAIS mouse warrants a more comprehensive in vivo assessment of photoreceptor subtype-specific physiology, because it overcomes the hindrance of overlapping spectral sensitivities present in the normal mouse.

Keywords: keywords electrophysiology; mouse; photoreceptors; silent substitution.


Figures

Fig. 1.
Fig. 1.
Flicker electroretinography (ERG) responses recorded from mouse variants. Responses were elicited by M- or L*-cone (A)- and rod-isolating stimuli (B) in mutant (LIAIS, n = 4–11; left), heterozygous (LIAIS+/−, n = 2–5; middle), and wild-type mice (WT, n = 2–4; right). Displayed are identical 500-ms episodes of responses to sinusoidal stimuli of 3–30 Hz (indicated at far left) and at the highest attainable contrast (55% cone contrast and 75% rod contrast for mutants, 5% rod and cone contrasts for WT, and a mixture of contrasts for heterozygous animals; see materials and methods). The mean luminance was 39 cd/m2. L*-cone activity was recordable in both LIAIS and LIAIS+/− mice. M-cone responses elicited from WT mice were substantially smaller and less regular in comparison. Waveforms elicited from rod-isolating conditions are also clearly observable in mutants and heterozygous animals, and less so in WT mice.
Fig. 2.
Fig. 2.
Fundamental ERG parameters (first harmonic, 1st H) of responses from each mouse strain. Data are averages (±SD) plotted as a function of temporal frequency from LIAIS (black squares; L*-cone, n = 11; rod, n = 10), LIAIS+/− (gray diamonds; L*-cone, n = 6; rod, n = 5), and WT mice (open circles; M-cone, n = 2; rod, n = 4) that were obtained with the highest stimulus contrast measured (cone: 55% for mutants and 5% for WT; rod: 75% for mutants and 5% for WT) under a mean luminance condition of 39 cd/m2. Cone (A)- and rod-driven (B) response amplitudes were largest in LIAIS mice. The response amplitudes were relatively constant up to a frequency of about 15 Hz (possibly with a local minimum at about 10 Hz) and decreased with increasing stimulus frequency above 15 Hz. Those obtained from the LIAIS+/− group were approximately half the size, whereas WT mice showed responses that were smaller by about a factor of 10 and just above noise. Phases are shown in C and D, described with linear regressions (LIAIS, black solid lines; LIAIS+/−, dark gray long-dashed lines; WT, light gray short-dashed lines). The phases of the cone-driven responses are shifted by 180° to account for the counter phase modulation of the rods and cones. Similar frequency dependency of the phases is shown in LIAIS and WT mice, whereas those obtained from the LIAIS+/− mice are about 180° shifted.
Fig. 3.
Fig. 3.
Average (±SD) second harmonic (2nd H) component amplitudes as a function of temporal frequency for LIAIS (black squares; cone, n = 11; rod, n = 10), LIAIS+/− (gray diamonds; cone, n = 6; rod, n = 5), and WT mice (open circles; cone, n = 2; rod, n = 4). Only responses to cone (left)- and rod-isolating stimuli (right) for the highest stimulus contrast measured (cone: 55%, rod for mutants: 75%, rod for WT: 5%) and a mean luminance of 39 cd/m2 are given, as in Fig. 2. Similar to 1st H data, photoreceptor amplitudes generally decreased with increasing stimulus frequency. Note that 2nd H rod amplitudes for LIAIS+/− mice were large at low temporal frequencies, even exceeding those of LIAIS mice.
Fig. 4.
Fig. 4.
Amplitudes show similar profiles in their dependency on temporal frequency under the same luminance. A and B: data are average (±SD) frequency-response functions of the 1st H components (log) obtained under L*-cone (A; n = 5–11, except at 13 cd/m2, where n = 1–4)- and rod-isolating conditions (B; n = 2–10) in LIAIS mice. Only the highest contrasts (55 and 75%; black squares) were obtained at 13 cd/m2 (bottom), whereas data from all 3 contrasts were collected at 39 (middle) and 130 cd/m2 (top). C: data sampled across temporal frequencies from the top 2 mean luminances are plotted against photoreceptor contrasts, with different symbols denoting various temporal frequencies sampled from A and B. Where applicable (goodness-of-fit; r2 ≥ 0.90), plots were modeled with (solid black) linear regression lines. Amplitude depends approximately linearly on contrast when mean luminance is 39 cd/m2, whereas the relationship is more exponential (gray dashed lines) when mean luminance is 130 cd/m2. This trend is more prominent for cone- than for rod-driven responses. In comparison, the effect of mean luminance on these amplitudes was variable and not as strong. D: L*-cone (triangles; n = 11) vs. rod comparisons (squares; n = 10) as a function of temporal frequency can also be converted to show photoreceptor responsivity.
Fig. 5.
Fig. 5.
Average (±SD) LIAIS mouse frequency-phase profiles from L*-cone (A)- and rod-isolating stimuli (B) are similar under different mean luminance and contrast settings. Plots are modeled with a linear regression. See main text for slope comparisons. Inset: rod vs. cone at top contrast and 39 cd/m2 mean luminance.
Fig. 6.
Fig. 6.
Differences are evident between data from LIAIS mice (from Fig. 4D) and human photoreceptor responsivities (n = 5; Kremers and Pangeni 2012). L-cone (A) and rod responsivities (B) for each species are shown as a function of temporal frequency.

References

    1. Allen AE, Storchi R, Martial FP, Petersen RS, Montemurro MA, Brown TM, Lucas RJ. Melanopsin-driven light adaptation in mouse vision. Curr Biol 24: 2481–2490, 2014. - PMC - PubMed
    1. Atorf J, Scholz M, Garreis F, Lehmann J, Brauer L, Kremers J. Functional protective effects of long-term memantine treatment in the DBA/2J mouse. Doc Ophthalmol 126: 221–232, 2013. - PubMed
    1. Bessler P, Klee S, Kellner U, Haueisen J. Silent substitution stimulation of S-cone pathway and L- and M-cone pathway in glaucoma. Invest Ophthalmol Vis Sci 51: 319–326, 2010. - PubMed
    1. Bloomfield SA, Dacheux RF. Rod vision: pathways and processing in the mammalian retina. Prog Retin Eye Res 20: 351–384, 2001. - PubMed
    1. Brainard DH, Calderone JB, Nugent AK, Jacobs GH. Flicker ERG responses to stimuli parametrically modulated in color space. Invest Ophthalmol Vis Sci 40: 2840–2847, 1999. - PubMed

Publication types

LinkOut - more resources